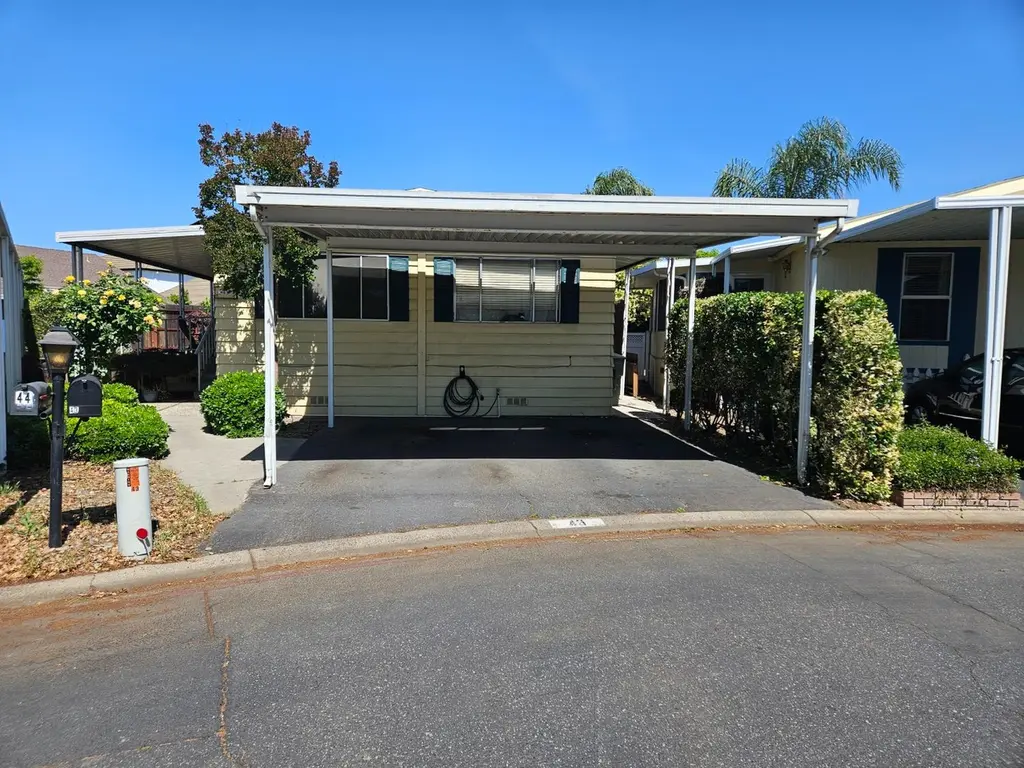
43 Clipper Ln · Modesto, CA
Flood risk 1/10 · Minimal
- FEMA flood zone
- X (unshaded)
- Chance of flooding over 30 yrs
- 0.0%
- Est. flood insurance / yr
- $507 – $1,088
Fire risk 6/10 · Moderate
- Est. fire insurance / yr
- $659 – $1,223
Heat risk 7/10 · Major
- Hot days now (above 102°F)
- 7 days/yr
- Hot days in 30 yrs
- 15 days/yr
Wind risk 1/10 · Minimal
- Chance of severe wind over 30 yrs
- —
Air-quality risk 10/10 · Severe
- Unhealthy air days now
- 28 days/yr
- Unhealthy air days in 30 yrs
- 32 days/yr
Risk factors via First Street. Map © Google.
Why this score? — see what drove the D grade
The composite is a weighted blend of 9 inputs, each scored 0–100. Each bar is that input's sub-score; the figure is the points it added to the 100-point composite (weight × sub-score).
- Cash flow +15.0/30.0
- ARV discount +7.5/15.0
- 1% rule +5.0/10.0
- DSCR +5.0/10.0
- Schools +4.4/10.0
- Livability +3.2/5.0
- Rent growth +2.5/5.0
- Condition / age +2.2/5.0
- Appreciation +0.0/10.0
$47,500
🖨 Deal sheet 📄 Offer letter ✓ Due diligence
Listing remarks
Adult 55 plus park and very nice with many amenities. Home needs TLC with 3/2 double wide and 1440 sq ft situated on large lot. With some newpaint, flooring and other updates home can shine
Key facts
- 2 parking spots
- Built 1974
- Listed 62 days
Property features AI
Finance
- Financial info: Land lease: No (land lease amount field present but listing indicates no land lease)
- HOA & community: No association; Senior community
Exterior
- Utilities: Cable available; 220 volts in laundry; Other water source; Other sewer
- Home design: Manufactured in park (double wide); Fixer condition; Built in 1974; Silvercrest make (manufactured home); Aluminum skirting
- Construction: Other roof material
- Exterior features: Porch; Other lot features
Interior
- Kitchen: Dishwasher; Laminate countertops
- Bedrooms: 3 bedrooms
- Flooring: Carpet
- Bathrooms: 2 full bathrooms; Tub with shower over
- Heating & cooling: Central heating; Central air conditioning
- Interior features: Great room; Porch; Kitchen and family room combined; Laminate kitchen counters; Pets allowed
- Laundry & utility: Laundry hookups with 220 volts in laundry
Neighborhood map
What this means for you Summary
Snapshot
- This is a 3-bed/2.0-bath manufactured listed at $48k. Condition is rated fair.
Deal economics
- At list price, monthly cash flow is $1k ($17k/yr) — positive.
- The deal already cash-flows at list — no discount required.
- Meets the 1% rule at list price ($2k rent vs $48k).
- Recommended offer: $45k (6.0% below list) — sets the bar for market timing.
- Cap rate 42.2% vs local median 3.2% in Modesto — top-decile yield for the area; either an underpriced asset or a hidden risk that comps aren't pricing in. Stress-test before assuming the spread holds.
Location & tenants
- Location reads 63/100 on livability (#451 in CA) — a middle-class / working-renter tenant base. Strengths: housing A+; Watch: amenities C-, schools D+, health & safety D+.
- Sylvan Union Elementary (urban): math 44% / reading 52% proficiency, ranked #457 of 1,400 in CA (top 33%) — families likely to look elsewhere, expect single-tenant / working-renter base with shorter leases.
- Market conditions: Rents soft (-0.1%/yr); 145 active listings in the ZIP; 13 comparable units currently listed for rent nearby; rentals leasing fast (median 14d on market — plan ~1-2 weeks tenant-placement turnaround); solid renter incomes; 923 units permitted in Stanislaus County in 2024 (63 in 5+ unit buildings).
Forward outlook
- Local home prices are declining (-3.0%/yr); year-one equity from $328 of loan paydown is wiped out by about $1k of value loss. Plan a longer hold.
- Stanislaus County population projected at +14% by 2050 — modest demand growth; plan on rents tracking national, not racing it.
- At projected returns (-3.0% appreciation + 0.0% rent growth), your $13k cash investment doubles in ~1 year — after that, you're playing with house money.
Negotiation context
- It's been on market 62 days — a 6% lower offer ($45k) is reasonable based on typical stale-listing flexibility.
Risks & watch-outs
- Climate carrying-cost: major wildfire risk; extreme-heat days projected 7→15/yr by 2055 (HVAC capex compounding) — expect insurance premiums to compound above CPI over the hold.
Questions for the listing agent
- It's been on market 62 days. Have you received any prior offers? Is the seller open to a 6% concession, seller financing, or rate buy-down credit?
- Have any recent inspections been done? Can we get a copy of the seller's disclosures and any deferred-maintenance estimates?
- Built in 1974 — when were the roof, HVAC, electrical panel, plumbing, and water heater last replaced?
- Why hasn't it sold? Are there any deal-killer items the seller is aware of (foundation, flood, title, zoning, code violations)?
- Is there a deadline driving the sale (1031 exchange, divorce, estate, relocation)? That informs how much negotiation room exists.
- Schools are D-rated, which usually means shorter tenancies and higher turnover. Who's the typical renter profile here, and what's been the actual vacancy rate?
- Crime grade is F in this area — have there been break-ins, vandalism, or insurance claims at this property in the last 3 years? What carrier currently insures it and at what premium?
- The area grade is low — what's the realistic commute time and amenity access for the typical tenant pool here? Any planned neighborhood developments (good or bad) we should know about?
- What's the average days-on-market for RENTAL listings here right now (not sales)? A rising rental-DOM trend means longer vacancies and softer asking-rent achievability than the comps imply.
- What's the recent tenant-quality profile in this submarket — average credit score on applications, eviction rate, late-payment / NSF rate, and stable-employment percentage? A property-management company in the area should have these aggregated.
- How much new for-sale + rental construction is in the pipeline within 1–3 miles? Heavy new supply typically softens prices + rents 12–24 months out; constrained supply supports both.
Investment metrics
- 1% rule
- 4.66% ✓
- Cap rate
- 42.15%
- Cash-on-cash
- 128.06%
- DSCR
- 6.70
- GRM
- 1.8
CMA / ARV
- ARV (on-the-fly)
- $133,920
- Comps found
- 12
Show comp detail 12 sales within ~0.75 mi
| Address | Dist | Beds/Ba | Sqft | Sold | Price | $/sf | Match |
|---|---|---|---|---|---|---|---|
| 3 Schooner Ln | 0.15mi | 2/2.0 (-1) | 1,440 (0%) | 7mo | $118,840 | $83 | 82 |
| 67 Clipper | 0.08mi | 3/2.0 | 1,344 (-7%) | 10mo | $125,000 | $93 | 76 |
| 19 Schooner Ln | 0.16mi | 2/2.0 (-1) | 1,344 (-7%) | 2mo | $114,500 | $85 | 75 |
| 93 Schooner Ln | 0.17mi | 3/2.0 | 1,296 (-10%) | 3mo | $150,000 | $116 | 73 |
| 195 Schooner Ln | 0.12mi | 2/2.0 (-1) | 1,322 (-8%) | 4mo | $132,000 | $100 | 72 |
| 132 Sloop | 0.09mi | 2/2.0 (-1) | 1,344 (-7%) | 10mo | $138,000 | $103 | 71 |
| 68 Clipper | 0.08mi | 2/2.0 (-1) | 1,344 (-7%) | 14mo | $160,000 | $119 | 69 |
| 3955 Coffee #53 | 0.57mi | 2/2.0 (-1) | 1,440 (0%) | 1mo | $81,900 | $57 | 67 |
| 22 Schooner Ln | 0.18mi | 2/2.0 (-1) | 1,344 (-7%) | 14mo | $115,000 | $86 | 64 |
| 4125 Mchenry Ave #107 | 0.46mi | 2/2.0 (-1) | 1,440 (0%) | 15mo | $80,000 | $56 | 61 |
| 30 Schooner #30 | 0.23mi | 2/2.0 (-1) | 1,248 (-13%) | 12mo | $117,500 | $94 | 52 |
| 3955 Coffee Rd #71 | 0.57mi | 2/2.0 (-1) | 1,296 (-10%) | 11mo | $95,000 | $73 | 43 |
Match score weights: distance 35% · size 25% · config 20% · recency 20%. Top-matched comps best support the ARV.
Projected returns pro-forma
-3.0% appreciation · 0.0% rent growth · sell at horizon
- IRR
- —
- Equity multiple
- 6.73×
- Total profit
- $76,255
- Equity at exit
- $7,082
- IRR
- —
- Equity multiple
- 12.87×
- Total profit
- $157,888
- Equity at exit
- $4,107
Cash invested: $13,300 (down + closing). Projections, not guarantees.
Landlord ↔ Tenant lean methodology
- Overall (STATE)
- 18 Strongly Tenant-Friendly
- State California
- 18 Strongly Tenant-Friendly · D+13
- County
- — inherits STATE
- City
- — inherits STATE
ZIP-level market 95356
- Rents YoY
- -0.1%
- Active inventory
- 145
- Price-to-rent
- 1.8×
Monthly cashflow live
- Estimated rent
- $2,212 high interval (Pro) →
- Mortgage (P&I)
- −$249
- Tax est. 1.5%
- −$59 /mo · $712/yr
- Insurance
- −$20
- HOA
- −$0
- Vacancy / Maint / Mgmt
- −$465
- Net cashflow
- $1,419
Break-even live
UW: 25.0% down · 7.5% · 30yr · 1.5% tax · 5.0% vac · 8.0% maint · 8.0% mgmt
Financing live
Cash to close
- Down payment
- $11,875
- Closing costs
- $1,425
- Reserves months
- —
- Total cash needed
- —
Loan-product check · same deal, 3 products live
Conventional
25% down · 7.5% · 30yr
- Down + closing
- —
- Monthly P&I
- —
- Monthly cashflow
- —
- DSCR
- —
- Eligible?
- —
Personal DTI + credit; lowest rate.
DSCR
20% down · 8.5% · 30yr
- Down + closing
- —
- Monthly P&I
- —
- Monthly cashflow
- —
- DSCR
- —
- Eligible?
- —
No personal income docs; deal must DSCR.
Hard money
10% down · 12.0% · 12mo
- Down + closing
- —
- Monthly P&I
- —
- Monthly cashflow
- —
- DSCR
- —
- Eligible?
- —
Short-term bridge; refi at stabilization.
Rent comps 13 comps
| Address | Beds | Baths | Sqft | Rent | $/sqft | DOM | Units | Dist |
|---|---|---|---|---|---|---|---|---|
| 3509 Dragoo Park Dr Unit 3511 Modesto, CA | 3.0 | 2.0 | 1335 | $1,899 | $1.42 | 23d | 1 | 0.60mi |
| 939 Claremont Ct Modesto, CA | 3.0 | 2.5 | 1406 | $2,100 | $1.49 | 13d | 1 | 0.68mi |
| 3904 Monteview Dr Unit 1 Modesto, CA | 3.0 | 2.0 | 1100 | $1,995 | $1.81 | 21d | 1 | 0.78mi |
| 1305 Sylvan Meadows Dr Unit C Modesto, CA | 2.0 | 1.5 | 1037 | $2,150 | $2.07 | 13d | 1 | 0.87mi |
| 3400 Coffee Rd Modesto, CA | 2.0 | 2.0 | 951 | $1,945 | $2.05 | 21d | 1 | 1.06mi |
| 3104 Sherwood Ave Modesto, CA | 2.0 | 1.0 | 820 | $2,071 | $2.53 | 13d | 10 | 1.15mi |
| 204 Emerson Ave Unit A Modesto, CA | 3.0 | 1.0 | 1252 | $2,150 | $1.72 | 23d | 1 | 1.21mi |
| 3701 Colonial Dr #154 Modesto, CA | 2.0 | 1.5 | 978 | $1,950 | $1.99 | 13d | 1 | 1.21mi |
| 3445 Colonial Dr Modesto, CA | 1.0–2.0 | 1.0 | 918 | $2,295 | $2.50 | 13d | 10 | 1.30mi |
| 1339 E Rumble Rd Modesto, CA | 2.0 | 1.0 | 1150 | $1,800 | $1.57 | 13d | 1 | 1.40mi |
| 200 Sheila Ct Modesto, CA | 1.0–2.0 | 1.0–1.5 | 841 | $1,725 | $2.05 | 13d | 1 | 1.47mi |
| 2912 Niabell Pl Modesto, CA | 3.0 | 2.0 | 1470 | $2,700 | $1.84 | 13d | 1 | 1.49mi |
| 3401 Tully Rd Modesto, CA | 2.0 | 2.0 | 1024 | $2,095 | $2.05 | 13d | 2 | 1.50mi |
Listing history 17 events
-
2026-06-18days on market $47,500 Active 62 DOM
-
2026-06-17days on market $47,500 Active 61 DOM
-
2026-06-16days on market $47,500 Active 60 DOM
-
2026-06-15pricedays on market $47,500 Active 59 DOM
-
2026-06-14days on market $52,000 Active 57 DOM
-
2026-06-13days on market $52,000 Active 56 DOM
-
2026-06-10days on market $52,000 Active 54 DOM
-
2026-06-09days on market $52,000 Active 53 DOM
-
2026-06-08days on market $52,000 Active 52 DOM
-
2026-06-07days on market $52,000 Active 51 DOM
-
2026-06-05remarks 189-char remark
-
2026-06-05pricedays on market $52,000 Active 48 DOM
-
2026-06-03days on market $60,000 Active 47 DOM
-
2026-06-02days on market $60,000 Active 46 DOM
-
2026-06-01days on market $60,000 Active 45 DOM
-
2026-05-31days on market $60,000 Active 44 DOM
-
2026-05-30days on market $60,000 Active 43 DOM
ⓘ Source: listings_history table (triggers on properties + properties_extension) + one-shot
backfill from property_details.listing_events for pre-trigger history.
Climate risk First Street
- Flood 1/10 Low FEMA zone X (unshaded) · 0% chance over 30 yrs
- Wildfire 6/10 Major
- Heat 7/10 Severe 7 d/yr ≥102°F today · 15 d/yr by 30 yrs out
- Wind 1/10 Low
- Air quality 10/10 Extreme 28 unhealthy d/yr today · 32 by 30 yrs out
Nearby sold comps map
Loading sold comps map…
Walkable amenities ~0.75 mi
Loading nearby amenities…
Taxation est. · year 1
- Rental income
- $26,547
- − Mortgage interest
- −$2,661
- − Property taxes
- −$712
- − Insurance
- −$238
- − Repairs & maintenance
- −$2,124
- − Management
- −$2,124
- − Depreciation
- −$1,382
- Taxable income
- $17,307
- Est. tax owed @ 24.0%
- −$4,154
- After-tax cash flow
- $12,879/yr
For passive investors: Depreciation is non-cash, so a rental often shows a tax loss while cash-flowing — sheltering income. Rental losses are passive: they offset passive income freely, and up to $25,000/yr can offset ordinary (W-2) income if you actively participate and your MAGI is under $100k (phasing out to $0 by $150k); unused losses carry forward. On sale, claimed depreciation is recaptured at up to 25%, and gains may owe capital-gains tax (a 1031 exchange can defer both). Figures are a year-1 estimate at your 24.0% rate — not tax advice; consult a CPA.
Condition & rehab AI · 4 photos
The home is in fair condition with good exterior and interior walls. Some cosmetic updates, such as painting and cleaning gutters, can significantly increase its value.
Value-add opportunities
- Both Paint the exterior — Painting the exterior can enhance curb appeal and value.
- Both Replace or clean gutters — Clean gutters improve drainage and prevent water damage
Renovation cost estimate screening
Value-add ROI direction
- Both Paint the exterior — Painting the exterior can enhance curb appeal and value. ↑
- Both Replace or clean gutters — Clean gutters improve drainage and prevent water damage ↑
ⓘ Cost ranges are severity-bucket heuristics (US national rule-of-thumb). Get contractor quotes + a written scope before underwriting a rehab budget.
Schools (NCES district)
- District
- Sylvan Union Elementary
- NCES district ID
- 0638670
- Math proficiency
- 44% ▲ 2.00%
- Reading proficiency
- 52% ▬ 0.00%
- Median HH income
- $61,181
- Composite
- 44.28/100
- National rank
- #6167
- State rank
- #457 of 1400 in CA
Livability — Modesto
- Score
- 63/100
- State rank
- #451
- US rank
- #15229
Category grades
Schools grade is shown separately in the Schools card above.
Census & demographics
- Census place
- Modesto, CA
- County
- Stanislaus County · 445,786 people
- City population
- 225,261
- Metro
- Modesto, CA
- Population (ZIP)
- 33,233
- Household income
- $96,886
- Rent vs Own
- Severe rent burden
- 847.0
Population outlook (Stanislaus County) Hauer SSP2
- Today (2025)
- 579,493 people
- By 2030
- 598,000 · +3.2%
- By 2040
- 630,930 · +8.9%
- By 2050
- 658,300 · +13.6%
- By 2075
- 712,363 · +22.9%
- By 2100
- 719,805 · +24.2%
Race, ethnicity, and origin ACS 2023
- Neighborhood character
- Diverse neighborhood (Simpson 0.64)
- Race & ethnicity
- White 50% Hispanic / Latino 32% Two or more races 16% Asian 9% Pacific Islander 2% Black 2% Native American 1%
- Hispanic origin (detail)
- Mexican 28%
- Common ancestry
- Russian 4% Italian 2% Iranian 2%
- Foreign-born
- 17% · Canada, China, Vietnam
- Languages at home
- 69% English-only · Spanish 15% Other Indo-European 6% Russian/Polish/Slavic 2%
Political lean MEDSL · Stanislaus
- 2024 margin
- R (+11.0) · D 43.2% · R 54.2% · Other 2.6%
- 2008→2024 swing
- -12.7pp toward R · 2008: 1.7pp · 2024: -11.0pp
- All cycles
- 2024: R+11.0 2020: D+0.8 2016: D+0.6 2012: D+0.7 2008: D+1.7
Not yet ingested
- Civics
- —
Market trends
- HPI YoY
- ▼ -374.73%
- Current HPI
- 270.6957
- Rent YoY
- ▼ -0.12%
- Metro
- Modesto, CA
- State GDP YoY
- ▲ 3.21%
- F500 in state
- 116
Industry mix (Fortune 500 HQ in CA)
| Industry | F500 HQs | Revenue |
|---|---|---|
| Technology | 27 | $1,492B |
|
||
| Financial Services | 3 | $174B |
|
||
| Retail | 3 | $44B |
|
||
| Insurance | 3 | $26B |
|
||
| Media / Entertainment | 2 | $115B |
|
||
| Pharmaceuticals / Biotech | 2 | $62B |
|
||
Cash-flow waterfall
monthlySold comps — $/sqft
last 12 mo · ≤1 miLoading sold comps…