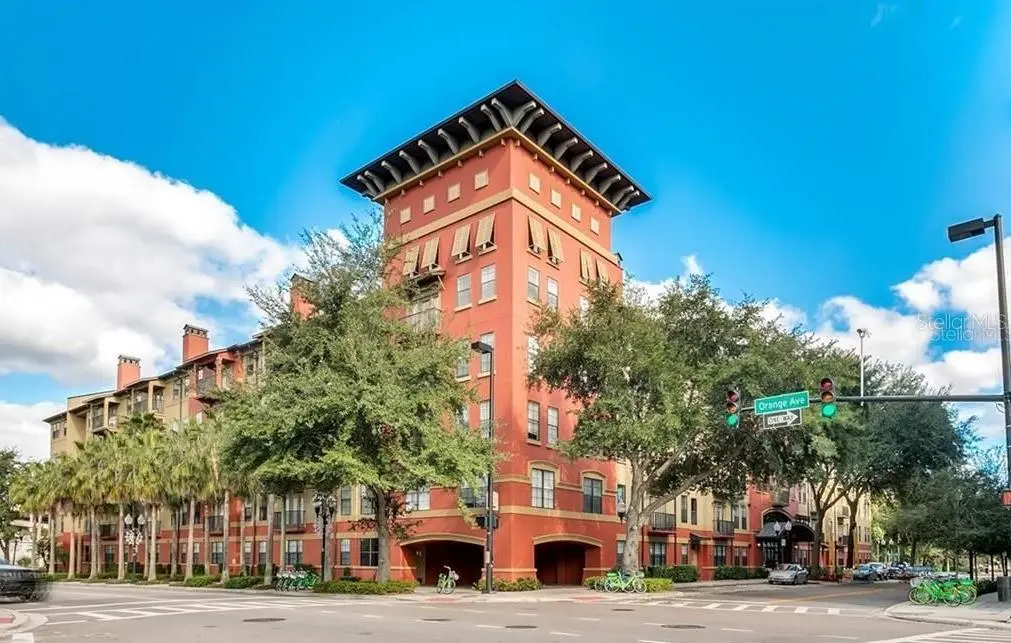
911 N Orange Ave #445 · Orlando, FL
Flood risk No data
- FEMA flood zone
- —
- Chance of flooding over 30 yrs
- —
- Est. flood insurance / yr
- —
Fire risk No data
- Est. fire insurance / yr
- —
Heat risk No data
- Hot days now (above threshold)
- —
- Hot days in 30 yrs
- —
Wind risk No data
- Chance of severe wind over 30 yrs
- —
Air-quality risk No data
- Unhealthy air days now
- —
- Unhealthy air days in 30 yrs
- —
Risk factors via First Street. Map © Google.
Why this score? — see what drove the D grade
The composite is a weighted blend of 9 inputs, each scored 0–100. Each bar is that input's sub-score; the figure is the points it added to the 100-point composite (weight × sub-score).
- Cash flow +10.8/30.0
- ARV discount +7.5/15.0
- 1% rule +6.4/10.0
- Livability +4.3/5.0
- Schools +4.1/10.0
- DSCR +3.1/10.0
- Condition / age +2.5/5.0
- Rent growth +2.4/5.0
- Appreciation +0.0/10.0
$140,000
🖨 Deal sheet (PDF) 📄 Offer letter ✓ Due diligence
Listing remarks
Move in ready 1-bedroom, 1-bath condo on the 4th floor of Uptown Place in the heart of Downtown Orlando. This well maintained unit features an open-concept layout with a spacious living area that flows into the kitchen, creating a comfortable setup for everyday living. The unit also includes a stackable washer and dryer for added convenience. Updates include luxury vinyl plank flooring throughout and a hot water heater replaced in 2023, providing added value and peace of mind. Even better, the community recently reduced the HOA fee, making this one of the most affordable options for Downtown Orlando living. Uptown Place offers great amenities including a pool, fitness center, clubroom, busi
Key facts
- Reduced hoa fee
- Hot water heater
- Pool
Tags
Property features AI
Finance
- Other: Located in downtown NORA district at the corner of Orange Ave and Marks St.; street parking off Orange and Marks with main entrance off Marks
- Financial info: Total monthly fees: $315; Total annual fees: $3,780; Lease restrictions apply
- HOA & community: Monthly condo fee: $315 (includes pool, clubhouse, fitness center, maintenance - structure and grounds, management, sewer, trash, escrow reserves fund, recreational facilities); Association: Don Asher Management / Michael Gray; Association fees required and paid monthly; Pets allowed (max 45 lbs)
Exterior
- Parking: Covered parking; Attached garage; Garage with garage door opener; Ground-level and open parking; 1 garage space
- Utilities: Public water; Public sewer; Electricity connected; Cable available; BB/HS internet available; Phone available; Sewer connected; Water connected
- Home design: Condominium; Residential property; Five-story building; One-level unit; East-facing
- Construction: Stucco and frame construction; Shingle roof; Slab foundation; Building number 445
- Exterior features: Balcony; Sidewalk; Sliding doors; Paved road access
Interior
- Kitchen: Dishwasher; Range; Refrigerator; Electric water heater
- Bedrooms: 1 bedroom (located on floor 4)
- Bathrooms: 1 full bathroom
- Heating & cooling: Central heating (electric); Central air conditioning
- Interior features: Kitchen/family room combo; Thermostat; Walk-in closets; Balcony; Sliding doors
- Laundry & utility: Washer hookup; Dryer hookup; Electric dryer hookup; Inside laundry in a laundry closet
Neighborhood map
What this means for you Summary
Snapshot
- This is a 1-bed/1.0-bath condo listed at $140k.
Deal economics
- At list price, monthly cash flow is $-65 ($-782/yr) — negative.
- To cash-flow at today's rent, offer at most $128k (8.2% below list).
- Meets the 1% rule at list price ($2k rent vs $140k).
- Recommended offer: $128k (8.2% below list) — sets the bar for cash-flow.
- Cap rate 5.7% vs local median 3.0% in Orlando — top-decile yield for the area; either an underpriced asset or a hidden risk that comps aren't pricing in. Stress-test before assuming the spread holds.
Location & tenants
- Location reads 86/100 on livability (#12 in FL, #360 nationally) — a professional / high-income tenant draw. Strengths: amenities A+, commute A+, housing A+.
- Orange (suburban): math 46% / reading 51% proficiency, ranked #43 of 73 in FL (top 59%) — families likely to look elsewhere, expect single-tenant / working-renter base with shorter leases.
- Zoned schools: Princeton Elementary (math 76% / reading 75%, grade A, #211 of 2,144 statewide, top 10%, 479 students, 41% FRL); Howard Middle (math 71% / reading 77%, grade A, #42 of 571 statewide, top 7%, 1,047 students, 35% FRL); Edgewater High (math 14% / reading 46%, grade F, #441 of 667 statewide, top 67%, 2,059 students, 52% FRL).
- Market conditions: Rents soft (-0.4%/yr); 210 active listings in the ZIP; 40 comparable units currently listed for rent nearby; rentals leasing fast (median 10d on market — plan ~1-2 weeks tenant-placement turnaround); solid renter incomes; 8,053 units permitted in Orange County in 2024 (3,133 in 5+ unit buildings).
Forward outlook
- Local home prices are declining (-3.0%/yr); year-one equity from $968 of loan paydown is wiped out by about $4k of value loss. Plan a longer hold.
- Orange County population projected at +52% by 2050 — long-run rental-demand tailwind backs the buy-and-hold thesis.
Negotiation context
- It's been on market 37 days — a 3% lower offer ($136k) is reasonable based on typical stale-listing flexibility.
Questions for the listing agent
- What do current leases actually rent for vs. the listed asking? Can we see a recent rent roll and the last 12 months of T-12 income?
- It's been on market 37 days. Have you received any prior offers? Is the seller open to a 8% concession, seller financing, or rate buy-down credit?
- What does the HOA fee cover, when was the last increase, and are there any pending special assessments or reserve-fund shortfalls?
- Any open or pending special assessments — roof, HVAC, plumbing, elevator, façade? What's the per-unit balance and payoff schedule, and is the seller paying it off at close or rolling it to the buyer?
- Is there a deadline driving the sale (1031 exchange, divorce, estate, relocation)? That informs how much negotiation room exists.
- Schools are B-rated — typically a magnet for longer-tenancy family renters. What's the average tenant stay here, and is there a school-zone premium baked into asking?
- The area grade is low — what's the realistic commute time and amenity access for the typical tenant pool here? Any planned neighborhood developments (good or bad) we should know about?
- What's the average days-on-market for RENTAL listings here right now (not sales)? A rising rental-DOM trend means longer vacancies and softer asking-rent achievability than the comps imply.
- What's the recent tenant-quality profile in this submarket — average credit score on applications, eviction rate, late-payment / NSF rate, and stable-employment percentage? A property-management company in the area should have these aggregated.
- How much new apartment / multifamily construction is in the pipeline within 1–3 miles? Heavy new supply (>2% of stock underway) typically softens rents 12–24 months out; light construction supports rent growth.
Investment metrics
- 1% rule
- 1.14% ✓
- Cap rate
- 5.73%
- Cash-on-cash
- -2.00%
- DSCR
- 0.91
- GRM
- 7.3
CMA / ARV
No comps found within radius.
Projected returns pro-forma
-3.0% appreciation · 0.0% rent growth · sell at horizon
- IRR
- -24.2%
- Equity multiple
- 0.20×
- Total profit
- $-31,266
- Equity at exit
- $20,874
- IRR
- -39.4%
- Equity multiple
- -0.27×
- Total profit
- $-49,636
- Equity at exit
- $12,105
Cash invested: $39,200 (down + closing). Projections, not guarantees.
Landlord ↔ Tenant lean methodology
- Overall (STATE)
- 87 Strongly Landlord-Friendly
- State Florida
- 87 Strongly Landlord-Friendly · R+3
- County
- — inherits STATE
- City
- — inherits STATE
ZIP-level market 32801
- Rents YoY
- -0.4%
- Active inventory
- 210
- Price-to-rent
- 7.3×
Monthly cashflow live
- Estimated rent
- $1,594 high interval (Pro) →
- Mortgage (P&I)
- −$734
- Tax from tax record
- −$217 /mo · $2,603/yr
- Insurance
- −$58
- HOA
- −$315
- Vacancy / Maint / Mgmt
- −$335
- Net cashflow
- $-65
Break-even live
Sensitivity live
| Price | -10% $14 | -5% $-26 | +0% $-65 | +5% $-105 | +10% $-144 |
|---|---|---|---|---|---|
| Rent | -10% $-191 | -5% $-128 | +0% $-65 | +5% $-2 | +10% $61 |
| Rate | -1.0pp $5 | -0.5pp $-30 | base $-65 | +0.5pp $-101 | +1.0pp $-138 |
UW: 25.0% down · 7.5% · 30yr · 1.5% tax · 5.0% vac · 8.0% maint · 8.0% mgmt
Financing live
Cash to close
- Down payment
- $35,000
- Closing costs
- $4,200
- Reserves months
- —
- Total cash needed
- —
Loan-product check · same deal, 3 products live
Conventional
25% down · 7.5% · 30yr
- Down + closing
- —
- Monthly P&I
- —
- Monthly cashflow
- —
- DSCR
- —
- Eligible?
- —
Personal DTI + credit; lowest rate.
DSCR
20% down · 8.5% · 30yr
- Down + closing
- —
- Monthly P&I
- —
- Monthly cashflow
- —
- DSCR
- —
- Eligible?
- —
No personal income docs; deal must DSCR.
Hard money
10% down · 12.0% · 12mo
- Down + closing
- —
- Monthly P&I
- —
- Monthly cashflow
- —
- DSCR
- —
- Eligible?
- —
Short-term bridge; refi at stabilization.
Rent comps 40 comps
| Address | Beds | Baths | Sqft | Rent | $/sqft | DOM | Units | Dist |
|---|---|---|---|---|---|---|---|---|
| 911 N Orange Ave Orlando, FL | 1.0–2.0 | 1.0–2.0 | 884 | $1,495 | $1.69 | 9d | 3 | 0.05mi |
| 911 N Orange Ave Orlando, FL | 1.0–2.0 | 1.0–2.0 | 884 | $1,500 | $1.70 | 26d | 3 | 0.05mi |
| 899 N Orange Ave Orlando, FL | 1.0–2.0 | 1.0–2.0 | 1067 | $1,838 | $1.72 | 0d | 10 | 0.09mi |
| 860 N Orange Ave Orlando, FL | 1.0–2.0 | 1.0–2.0 | 857 | $1,400 | $1.63 | 16d | 3 | 0.12mi |
| 750 N Orange Ave Orlando, FL | 1.0–2.0 | 1.0–2.0 | 883 | $1,545 | $1.75 | 0d | 20 | 0.19mi |
| 777 N Orange Ave Orlando, FL | 1.0 | 1.0 | 797 | $1,804 | $2.26 | 0d | 3 | 0.22mi |
| 306 Lakeview St Orlando, FL | 1.0–2.0 | 1.0 | 825 | $1,450 | $1.76 | 26d | 1 | 0.25mi |
| 813 Irma Ave Unit 8133 Orlando, FL | 1.0 | 1.0 | 474 | $1,195 | $2.52 | 26d | 1 | 0.26mi |
| 668 N Orange Ave Orlando, FL | 1.0 | 1.0 | 732 | $1,859 | $2.54 | 0d | 7 | 0.34mi |
| 320 Lakeview St Orlando, FL | 1.0 | 1.0 | 642 | $1,375 | $2.14 | 4d | 2 | 0.34mi |
| 320 Lakeview St Orlando, FL | 1.0 | 1.0 | 644 | $1,388 | $2.15 | 13d | 2 | 0.34mi |
| 511 Hillcrest St Unit 2 Orlando, FL | 1.0 | 1.0 | 575 | $1,150 | $2.00 | 6d | 1 | 0.56mi |
| 434 N Orange Ave Orlando, FL | 1.0 | 1.0 | 518 | $2,520 | $4.86 | 26d | 1 | 0.58mi |
| 410 N Orange Ave Orlando, FL | 3.0 | 1.0–3.0 | 854 | $2,305 | $2.70 | 0d | 176 | 0.63mi |
| 429 Ruth Ln Unit 4 Orlando, FL | 1.0 | 1.0 | 700 | $1,450 | $2.07 | 19d | 1 | 0.64mi |
| 295 NE Ivanhoe Blvd Orlando, FL | 2.0 | 1.0–2.0 | 826 | $2,448 | $2.96 | 3d | 8 | 0.70mi |
| 335 N Magnolia Ave Orlando, FL | 1.0 | 1.0 | 663 | $2,225 | $3.36 | 0d | 30 | 0.70mi |
| 505 Chatham Ave Orlando, FL | 3.0 | 1.0–2.0 | 1022 | $2,105 | $2.06 | 5d | 27 | 0.71mi |
| 480 N Terry Ave Orlando, FL | 3.0 | 1.0–2.0 | 841 | $1,832 | $2.18 | 0d | 26 | 0.72mi |
| 1460 Alden Rd Orlando, FL | 1.0–3.0 | 1.0–3.0 | 1020 | $1,794 | $1.76 | 0d | 40 | 0.73mi |
| 412 Harwood St Unit 2 Orlando, FL | 1.0 | 1.0 | 350 | $1,800 | $5.14 | 26d | 1 | 0.73mi |
| 412 Harwood St Unit 4 Orlando, FL | — | 1.0 | 377 | $1,950 | $5.17 | 4d | 1 | 0.73mi |
| 412 Harwood St Unit 3 Orlando, FL | 1.0 | 1.0 | 565 | $2,100 | $3.72 | 26d | 1 | 0.73mi |
| 412 Harwood St Unit 1 Orlando, FL | 2.0 | 1.0 | 566 | $2,610 | $4.61 | 26d | 1 | 0.73mi |
| 659 W Amelia St Orlando, FL | 1.0–3.0 | 1.0–2.0 | 849 | $1,179 | $1.39 | 0d | 28 | 0.76mi |
| 639 E Amelia St Orlando, FL | 1.0 | 1.0 | 600 | $1,500 | $2.50 | 6d | 1 | 0.79mi |
| 151 E Robinson St Orlando, FL | 4.0 | 1.0–3.5 | 1815 | $3,850 | $2.12 | 16d | 2 | 0.79mi |
| 150 E Robinson St Orlando, FL | 2.0 | 1.0–2.0 | 829 | $2,725 | $3.29 | 16d | 6 | 0.81mi |
| 150 E Robinson St Orlando, FL | 2.0 | 1.0–2.0 | 829 | $2,700 | $3.25 | 0d | 8 | 0.81mi |
| 704 Cordova Dr Apt 6 Orlando, FL | 2.0 | 2.0 | 630 | $1,450 | $2.30 | 9d | 1 | 0.82mi |
| 704 Cordova Dr Apt 1 Orlando, FL | 1.0 | 1.0 | 500 | $1,099 | $2.20 | 9d | 1 | 0.82mi |
| 704 Cordova Dr Apt 7 Orlando, FL | 2.0 | 1.5 | 630 | $1,425 | $2.26 | 9d | 1 | 0.82mi |
| 225 E New Hampshire St Orlando, FL | 1.0–2.0 | 1.0 | 636 | $1,495 | $2.35 | 6d | 2 | 0.82mi |
| 735 N Westmoreland Dr Orlando, FL | 1.0 | 1.0 | 700 | $1,395 | $1.99 | 6d | 1 | 0.87mi |
| 503 Chatham Ave Orlando, FL | 1.0 | 1.0 | 708 | $1,570 | $2.22 | 26d | 1 | 0.89mi |
| 1016 Alba Dr Unit 1020 Orlando, FL | 1.0 | 1.0 | 490 | $1,500 | $3.06 | 26d | 1 | 0.92mi |
| 1020 Alba Dr Orlando, FL | 1.0 | 1.0 | 490 | $1,500 | $3.06 | 26d | 1 | 0.93mi |
| 1629 Dauphin Ln Orlando, FL | 2.0 | 1.0 | 725 | $2,200 | $3.03 | 26d | 1 | 0.97mi |
| 120 W Princeton St Unit 3-C Orlando, FL | 1.0 | 1.0 | 648 | $1,695 | $2.62 | 26d | 1 | 0.97mi |
| 812 W Livingston St Unit B Orlando, FL | 2.0 | 1.0 | 650 | $1,175 | $1.81 | 0d | 1 | 1.02mi |
HOA detail condo
- Monthly dues
- $315 · $3,780/yr
- Likely covers
- waterpoolgym
- Assessments
- None detected in remarks — confirm with the listing agent.
Listing history 17 events
-
2026-06-21days on market $140,000 Active 37 DOM
-
2026-06-18days on market $140,000 Active 34 DOM
-
2026-06-17days on market $140,000 Active 33 DOM
-
2026-06-16days on market $140,000 Active 32 DOM
-
2026-06-15days on market $140,000 Active 31 DOM
-
2026-06-13days on market $140,000 Active 29 DOM
-
2026-06-13days on market $140,000 Active 28 DOM
-
2026-06-09days on market $140,000 Active 26 DOM
-
2026-06-08days on market $140,000 Active 25 DOM
-
2026-06-07days on market $140,000 Active 24 DOM
-
2026-06-04days on market $140,000 Active 21 DOM
-
2026-06-03days on market $140,000 Active 20 DOM
-
2026-06-02days on market $140,000 Active 19 DOM
-
2026-06-01days on market $140,000 Active 18 DOM
-
2026-05-31days on market $140,000 Active 17 DOM
-
2026-05-14$140,000 Active
-
2005-08-10soldstatus $138,200
ⓘ Source: listings_history table (triggers on properties + properties_extension) + one-shot
backfill from property_details.listing_events for pre-trigger history.
Tax reassessment forecast FL · Resets to sale price
- Current annual tax
- $2,603 · $217/mo
- Projected year-2 tax
- $2,603 · $217/mo
- Expected delta
- $0/yr ($0/mo · 0.0%)
ⓘ Screening estimate from a state-policy table — verify with the county assessor before closing.
Nearby sold comps map
Loading sold comps map…
Walkable amenities ~0.75 mi
Loading nearby amenities…
Taxation est. · year 1
- Rental income
- $19,127
- − Mortgage interest
- −$7,842
- − Property taxes
- −$2,603
- − Insurance
- −$700
- − Repairs & maintenance
- −$1,530
- − Management
- −$1,530
- − HOA
- −$3,780
- − Depreciation
- −$4,073
- Taxable loss
- −$2,931
- Est. tax savings @ 24.0%
- +$703
- After-tax cash flow
- $-79/yr
For passive investors: Depreciation is non-cash, so a rental often shows a tax loss while cash-flowing — sheltering income. Rental losses are passive: they offset passive income freely, and up to $25,000/yr can offset ordinary (W-2) income if you actively participate and your MAGI is under $100k (phasing out to $0 by $150k); unused losses carry forward. On sale, claimed depreciation is recaptured at up to 25%, and gains may owe capital-gains tax (a 1031 exchange can defer both). Figures are a year-1 estimate at your 24.0% rate — not tax advice; consult a CPA.
Schools (NCES district)
- District
- Orange
- NCES district ID
- 1201440
- Math proficiency
- 46% ▼ -9.00%
- Reading proficiency
- 51% ▼ -2.00%
- Median HH income
- $49,350
- Composite
- 41.47/100
- National rank
- #3461
- State rank
- #43 of 73 in FL
Livability — Orlando
- Score
- 86/100
- State rank
- #12
- US rank
- #360
Category grades
Schools grade is shown separately in the Schools card above.
Census & demographics
- Census place
- Orlando, FL
- County
- Orange County · 1,471,359 people
- City population
- 964,969
- Metro
- Orlando-Kissimmee-Sanford, FL
- Population (ZIP)
- 17,046
- Household income
- $80,871
- Rent vs Own
- Severe rent burden
- 1989.0
Population outlook (Orange County) Hauer SSP2
- Today (2025)
- 1,618,226 people
- By 2030
- 1,787,404 · +10.5%
- By 2040
- 2,125,621 · +31.4%
- By 2050
- 2,454,016 · +51.6%
- By 2075
- 3,173,711 · +96.1%
- By 2100
- 3,607,781 · +122.9%
Race, ethnicity, and origin ACS 2023
- Neighborhood character
- Diverse neighborhood (Simpson 0.63)
- Race & ethnicity
- White 54% Hispanic / Latino 26% Two or more races 18% Black 8% Asian 6%
- Hispanic origin (detail)
- Mexican 2% Puerto Rican 12% Cuban 3% Dominican 2%
- Common ancestry
- Romanian 4% Lithuanian 3% Slovak 1%
- Foreign-born
- 14% · Canada, Mexico, Jamaica
- Languages at home
- 75% English-only · Spanish 19% Other Indo-European 2% Chinese 1%
Political lean MEDSL · Orange
- 2024 margin
- D (+13.6) · D 56.1% · R 42.5% · Other 1.3%
- 2008→2024 swing
- -5.0pp toward R · 2008: 18.6pp · 2024: 13.6pp
- All cycles
- 2024: D+13.6 2020: D+23.1 2016: D+24.6 2012: D+18.2 2008: D+18.6
Not yet ingested
- Civics
- —
Market trends
- HPI YoY
- ▼ -265.29%
- Current HPI
- 244.3501
- Rent YoY
- ▼ -0.38%
- Metro
- Orlando-Kissimmee-Sanford, FL
- State GDP YoY
- ▲ 3.28%
- F500 in state
- 36
Industry mix (Fortune 500 HQ in FL)
| Industry | F500 HQs | Revenue |
|---|---|---|
| Industrial Technology | 2 | $29B |
|
||
| Insurance | 2 | $17B |
|
||
| Retail | 1 | $60B |
|
||
| Technology Distribution | 1 | $58B |
|
||
| Homebuilding | 1 | $35B |
|
||
| Technology Manufacturing | 1 | $35B |
|
||
Price history
+1.3% since first listed2 events — show timeline
- 2026-05-14 Listed $140,000 Stellar MLS as Distributed by MLS Grid
- 2005-08-10 Sold (Public Records) $138,200 Public Records
Property tax history
+8.1%/yrLatest (2025): $2,603 · +9.1% YoY. Source: county tax records.
Cash-flow waterfall
monthlySold comps — $/sqft
last 12 mo · ≤1 miLoading sold comps…