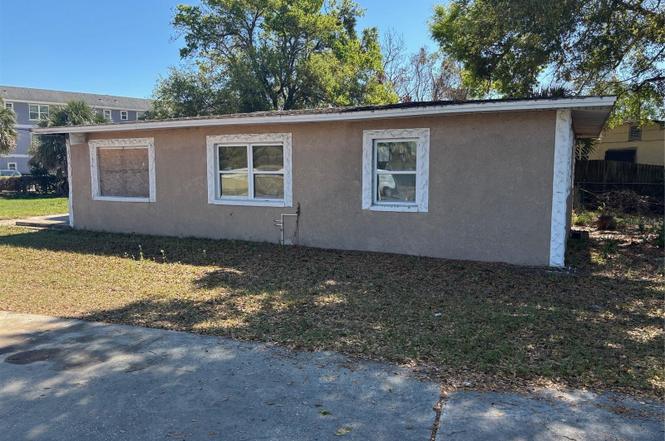
403 Mercado Ave · Orlando, FL
Flood risk 1/10 · Minimal
- FEMA flood zone
- X (unshaded)
- Chance of flooding over 30 yrs
- 0.0%
- Est. flood insurance / yr
- $507 – $1,088
Fire risk 1/10 · Minimal
- Est. fire insurance / yr
- $947 – $1,759
Heat risk 9/10 · Severe
- Hot days now (above 107°F)
- 7 days/yr
- Hot days in 30 yrs
- 22 days/yr
Wind risk 9/10 · Severe
- Chance of severe wind over 30 yrs
- 99.0%
Air-quality risk 2/10 · Minimal
- Unhealthy air days now
- 1 days/yr
- Unhealthy air days in 30 yrs
- 1 days/yr
Risk factors via First Street. Map © Google.
Why this score? — see what drove the C- grade
The composite is a weighted blend of 9 inputs, each scored 0–100. Each bar is that input's sub-score; the figure is the points it added to the 100-point composite (weight × sub-score).
- ARV discount +15.0/15.0
- Cash flow +13.4/30.0
- 1% rule +4.4/10.0
- Livability +4.3/5.0
- Schools +4.1/10.0
- DSCR +4.0/10.0
- Rent growth +3.2/5.0
- Condition / age +2.5/5.0
- Appreciation +0.0/10.0
$200,000
🖨 Deal sheet (PDF) 📄 Offer letter ✓ Due diligence
Listing remarks
FIRE DAMAGE PROPERTY!!! HOUSE NEEDS A COMPLETE REBUILD.
Key facts
- 0.3 acre lot
- Built 1954
- Listed 102 days
Property features AI
Finance
- Other: Zoning: R-1A/AN; Property ID available
- Financial info: No lease restrictions; Tax information available (not included per instructions)
- HOA & community: No HOA / association
Exterior
- Parking: Road surfaces: Asphalt and concrete
- Utilities: Public water; Public sewer; Other utilities
- Home design: Single family residence; Residential property; Fixer condition; One story; Faces east
- Construction: Block and stucco construction; Shingle roof; Slab foundation; Built on a 0.3-acre lot (approx. 1/4 to less than 1/2 acre)
- Exterior features: Sidewalk
Interior
- Kitchen: No appliances listed
- Bedrooms: 3 bedrooms (total)
- Flooring: Concrete flooring; Other flooring
- Bathrooms: 2 full bathrooms
- Heating & cooling: No heating listed; No cooling listed
- Interior features: No interior features listed
- Laundry & utility: No laundry features
Neighborhood map
What this means for you Summary
Snapshot
- This is a 3-bed/2.0-bath single-family listed at $200k.
Deal economics
- At list price, monthly cash flow is $4 ($44/yr) — positive.
- The deal already cash-flows at list — no discount required.
- To meet the 1% rule (rent ≥ 1% of price), the offer needs to be $188k (6.0% below list).
- Recommended offer: $182k (9.0% below list) — sets the bar for market timing.
- Cap rate 6.3% vs local median 3.0% in Orlando — top-decile yield for the area; either an underpriced asset or a hidden risk that comps aren't pricing in. Stress-test before assuming the spread holds.
Location & tenants
- Location reads 86/100 on livability (#12 in FL, #360 nationally) — a professional / high-income tenant draw. Strengths: amenities A+, commute A+, housing A+.
- Orange (suburban): math 46% / reading 51% proficiency, ranked #43 of 73 in FL (top 59%) — families likely to look elsewhere, expect single-tenant / working-renter base with shorter leases.
- Zoned schools: Azalea Park Elementary (math 52% / reading 47%, grade D, #1,088 of 2,144 statewide, top 53%, 467 students, 81% FRL); Roberto Clemente Middle (math 31% / reading 36%, grade F, #428 of 571 statewide, top 76%, 951 students, 63% FRL); William R Boone High (math 36% / reading 58%, grade D-, #207 of 667 statewide, top 32%, 2,780 students, 44% FRL).
- Market conditions: Rents rising (+2.6%/yr); 175 active listings in the ZIP; 40 comparable units currently listed for rent nearby; rentals at typical pace (median 22d on market — plan ~3-4 weeks tenant-placement turnaround); 8,053 units permitted in Orange County in 2024 (3,133 in 5+ unit buildings).
- This rent runs 38% of the median local income ($60k/yr) — at the standard rent-burdened threshold; future hikes will face affordability resistance.
Forward outlook
- Local home prices are declining (-3.0%/yr); year-one equity from $1k of loan paydown is wiped out by about $6k of value loss. Plan a longer hold.
- Orange County population projected at +52% by 2050 — long-run rental-demand tailwind backs the buy-and-hold thesis.
Negotiation context
- It's been on market 102 days — a 9% lower offer ($182k) is reasonable based on typical stale-listing flexibility.
- 6 sale attempts since 7y ago with the ask held roughly flat each time — persistent listings suggest the price (not the market) is what's stuck; bring a comps-based counter.
- Current owner paid $86k; list at $200k implies a 133% gain — meaningful room to come down on a strong offer.
Risks & watch-outs
- Watch-outs: built in 1954 — expect roof / HVAC / electrical / plumbing capex.
- Climate carrying-cost: severe wind risk, 99% chance of damaging wind over 30y; extreme-heat days projected 7→22/yr by 2055 (HVAC capex compounding) — expect insurance premiums to compound above CPI over the hold.
Questions for the listing agent
- It's been on market 102 days. Have you received any prior offers? Is the seller open to a 9% concession, seller financing, or rate buy-down credit?
- Built in 1954 — when were the roof, HVAC, electrical panel, plumbing, and water heater last replaced?
- Why hasn't it sold? Are there any deal-killer items the seller is aware of (foundation, flood, title, zoning, code violations)?
- Is there a deadline driving the sale (1031 exchange, divorce, estate, relocation)? That informs how much negotiation room exists.
- Schools are B-rated — typically a magnet for longer-tenancy family renters. What's the average tenant stay here, and is there a school-zone premium baked into asking?
- What's the average days-on-market for RENTAL listings here right now (not sales)? A rising rental-DOM trend means longer vacancies and softer asking-rent achievability than the comps imply.
- What's the recent tenant-quality profile in this submarket — average credit score on applications, eviction rate, late-payment / NSF rate, and stable-employment percentage? A property-management company in the area should have these aggregated.
- How much new for-sale + rental construction is in the pipeline within 1–3 miles? Heavy new supply typically softens prices + rents 12–24 months out; constrained supply supports both.
Investment metrics
- 1% rule
- 0.94% ✗
- Cap rate
- 6.32%
- Cash-on-cash
- 0.08%
- DSCR
- 1.00
- GRM
- 8.9
CMA / ARV
- ARV (on-the-fly)
- $286,340
- Comps found
- 5
Show comp detail 5 sales within ~0.75 mi
| Address | Dist | Beds/Ba | Sqft | Sold | Price | $/sf | Match |
|---|---|---|---|---|---|---|---|
| 5873 Camellia Dr | 0.52mi | 3/1.0 | 1,059 (+3%) | 0mo | $299,000 | $282 | 67 |
| 312 Verbena Dr | 0.10mi | 3/1.0 | 1,150 (+12%) | 13mo | $320,000 | $278 | 61 |
| 600 Dorado Ave | 0.21mi | 3/1.0 | 894 (-13%) | 13mo | $195,000 | $218 | 53 |
| 532 Yucatan Dr | 0.51mi | 3/1.5 | 989 (-4%) | 18mo | $297,500 | $301 | 53 |
| 606 EL Vedado Ave | 0.23mi | 3/1.0 | 880 (-15%) | 13mo | $206,000 | $234 | 50 |
Match score weights: distance 35% · size 25% · config 20% · recency 20%. Top-matched comps best support the ARV.
Projected returns pro-forma
-3.0% appreciation · 2.6% rent growth · sell at horizon
- IRR
- -16.6%
- Equity multiple
- 0.41×
- Total profit
- $-32,838
- Equity at exit
- $29,821
- IRR
- -9.1%
- Equity multiple
- 0.45×
- Total profit
- $-30,996
- Equity at exit
- $17,292
Cash invested: $56,000 (down + closing). Projections, not guarantees.
Landlord ↔ Tenant lean methodology
- Overall (STATE)
- 87 Strongly Landlord-Friendly
- State Florida
- 87 Strongly Landlord-Friendly · R+3
- County
- — inherits STATE
- City
- — inherits STATE
ZIP-level market 32807
- Home prices YoY
- -20.1%
- Rents YoY
- 2.6%
- Active inventory
- 175
- Price-to-rent
- 8.9×
Monthly cashflow live
- Estimated rent
- $1,880 high interval (Pro) →
- Mortgage (P&I)
- −$1,049
- Tax from tax record
- −$349 /mo · $4,189/yr
- Insurance
- −$83
- HOA
- −$0
- Vacancy / Maint / Mgmt
- −$395
- Net cashflow
- $4
Break-even live
Sensitivity live
| Price | -10% $117 | -5% $60 | +0% $4 | +5% $-53 | +10% $-110 |
|---|---|---|---|---|---|
| Rent | -10% $-145 | -5% $-71 | +0% $4 | +5% $78 | +10% $152 |
| Rate | -1.0pp $104 | -0.5pp $55 | base $4 | +0.5pp $-48 | +1.0pp $-101 |
UW: 25.0% down · 7.5% · 30yr · 1.5% tax · 5.0% vac · 8.0% maint · 8.0% mgmt
Financing live
Cash to close
- Down payment
- $50,000
- Closing costs
- $6,000
- Reserves months
- —
- Total cash needed
- —
Loan-product check · same deal, 3 products live
Conventional
25% down · 7.5% · 30yr
- Down + closing
- —
- Monthly P&I
- —
- Monthly cashflow
- —
- DSCR
- —
- Eligible?
- —
Personal DTI + credit; lowest rate.
DSCR
20% down · 8.5% · 30yr
- Down + closing
- —
- Monthly P&I
- —
- Monthly cashflow
- —
- DSCR
- —
- Eligible?
- —
No personal income docs; deal must DSCR.
Hard money
10% down · 12.0% · 12mo
- Down + closing
- —
- Monthly P&I
- —
- Monthly cashflow
- —
- DSCR
- —
- Eligible?
- —
Short-term bridge; refi at stabilization.
Rent comps 40 comps
| Address | Beds | Baths | Sqft | Rent | $/sqft | DOM | Units | Dist |
|---|---|---|---|---|---|---|---|---|
| 5520 Lake Underhill Rd Unit 105 Orlando, FL | 3.0 | 2.0 | 1050 | $1,795 | $1.71 | 25d | 1 | 0.05mi |
| 5520 Lake Underhill Rd Unit 203 Orlando, FL | 3.0 | 2.0 | 1050 | $1,695 | $1.61 | 23d | 1 | 0.05mi |
| 5719 Camellia Dr Orlando, FL | 4.0 | 3.5 | 1315 | $2,470 | $1.88 | 0d | 1 | 0.32mi |
| 572 Santiago Ave Orlando, FL | 4.0 | 2.0 | 1407 | $2,300 | $1.63 | 23d | 1 | 0.50mi |
| 5856 Dahlia Dr Azalea Park, FL | 1.0–2.0 | 1.0 | 815 | $1,525 | $1.87 | 0d | 4 | 0.57mi |
| 5801 Shenandoah Way Orlando, FL | 1.0–3.0 | 1.0–2.0 | 999 | $1,775 | $1.78 | 0d | 3 | 0.58mi |
| 5885 Dahlia Dr Unit 106/9 Orlando, FL | 2.0 | 1.0 | 830 | $1,350 | $1.63 | 25d | 1 | 0.61mi |
| 5885 Dahlia Dr Unit 216 Orlando, FL | 2.0 | 1.0 | 830 | $1,500 | $1.81 | 22d | 1 | 0.61mi |
| 5885 Dahlia Dr Orlando, FL | 2.0 | 1.0 | 830 | $1,348 | $1.62 | 6d | 2 | 0.63mi |
| 502 Engel Dr Orlando, FL | 2.0 | 1.0 | 850 | $2,250 | $2.65 | 25d | 1 | 0.70mi |
| 529 Hibiscus Way Orlando, FL | 3.0 | 2.0 | 1458 | $2,150 | $1.47 | 9d | 1 | 0.75mi |
| 511 Carr St Orlando, FL | 4.0 | 2.0 | 1209 | $2,500 | $2.07 | 6d | 1 | 0.76mi |
| 536 Hibiscus Way Unit 7B Orlando, FL | 3.0 | 2.0 | 1113 | $3,977 | $3.57 | 22d | 1 | 0.77mi |
| 5835 La Costa Dr #104 Orlando, FL | 2.0 | 2.0 | 1115 | $1,600 | $1.43 | 25d | 1 | 0.77mi |
| 550 Hibiscus Cove Dr Orlando, FL | 3.0 | 2.0 | 1481 | $1,300 | $0.88 | 0d | 1 | 0.84mi |
| 1198 Calanda Ave Orlando, FL | 3.0 | 2.0 | 1151 | $2,390 | $2.08 | 25d | 1 | 0.88mi |
| 160 Palmyra Dr Orlando, FL | 2.0 | 1.0 | 850 | $3,000 | $3.53 | 23d | 1 | 0.90mi |
| 1450 Terre Cia Ave Orlando, FL | 3.0 | 2.0 | 1166 | $2,095 | $1.80 | 6d | 1 | 0.90mi |
| 525 Conway Rd Orlando, FL | 2.0 | 1.5–2.0 | 920 | $1,450 | $1.58 | 15d | 3 | 1.02mi |
| 525 Conway Rd Orlando, FL | 1.0–2.0 | 1.0–1.5 | 748 | $1,550 | $2.07 | 0d | 4 | 1.02mi |
| 525 Conway Rd Orlando, FL | 2.0 | 1.0–1.5 | 942 | $1,538 | $1.63 | 25d | 3 | 1.02mi |
| 5317 Curry Ford Rd Orlando, FL | 1.0–2.0 | 1.0 | 661 | $1,300 | $1.97 | 3d | 3 | 1.03mi |
| 5730 Oleander Dr Orlando, FL | 3.0 | 2.0 | 1447 | $2,200 | $1.52 | 6d | 1 | 1.03mi |
| 619 Santa Fe Ln Orlando, FL | 3.0 | 1.5 | 1168 | $2,025 | $1.73 | 23d | 1 | 1.03mi |
| 1303 Candlewyck Dr Orlando, FL | 2.0 | 1.0 | 904 | $1,500 | $1.66 | 25d | 1 | 1.04mi |
| 712 Saint Lucie Ln Orlando, FL | 3.0 | 1.5 | 1212 | $2,000 | $1.65 | 25d | 1 | 1.08mi |
| 1625 Larkin Ave Orlando, FL | 3.0 | 2.0 | 1202 | $1,850 | $1.54 | 13d | 1 | 1.08mi |
| 1382 Hendren Dr Orlando, FL | 3.0 | 2.0 | 1175 | $2,150 | $1.83 | 25d | 1 | 1.10mi |
| 720 Conway Rd Orlando, FL | 2.0 | 1.0–2.0 | 995 | $2,117 | $2.13 | 0d | 15 | 1.12mi |
| 1448 Adriel Ln Orlando, FL | 1.0–2.0 | 1.0–2.0 | 712 | $1,550 | $2.18 | 23d | 1 | 1.13mi |
| 247 Cocos Dr Orlando, FL | 3.0 | 1.0 | 916 | $1,950 | $2.13 | 9d | 1 | 1.13mi |
| 6003 Oleander Dr Orlando, FL | 2.0 | 1.5 | 900 | $1,700 | $1.89 | 25d | 1 | 1.14mi |
| 5230 Curry Ford Rd Orlando, FL | 2.0 | 1.0 | 984 | $1,250 | $1.27 | 6d | 1 | 1.14mi |
| 5234 Curry Ford Rd #412 Orlando, FL | 2.0 | 1.0 | 984 | $1,200 | $1.22 | 25d | 1 | 1.14mi |
| 4380 Lake Underhill Rd Orlando, FL | 2.0 | 2.0 | 1250 | $2,000 | $1.60 | 12d | 1 | 1.16mi |
| 4380 Lake Underhill Rd Unit A Orlando, FL | 2.0 | 2.0 | 1250 | $2,000 | $1.60 | 16d | 1 | 1.16mi |
| 917 S Alder Ave Orlando, FL | 3.0 | 2.0 | 1014 | $2,050 | $2.02 | 25d | 1 | 1.22mi |
| 4401 Lenmore St #1 Orlando, FL | 4.0 | 2.0 | 1375 | $3,600 | $2.62 | 25d | 1 | 1.22mi |
| 1997 Dixie Belle Dr Unit D Orlando, FL | 3.0 | 2.0 | 993 | $1,750 | $1.76 | 19d | 1 | 1.22mi |
| 1600 Bending Brook Way Orlando, FL | 2.0 | 2.5 | 1227 | $1,695 | $1.38 | 15d | 1 | 1.25mi |
Listing history 29 events
-
2026-06-21days on market $200,000 Active 102 DOM
-
2026-06-18days on market $200,000 Active 99 DOM
-
2026-06-17days on market $200,000 Active 98 DOM
-
2026-06-16days on market $200,000 Active 97 DOM
-
2026-06-15days on market $200,000 Active 96 DOM
-
2026-06-13days on market $200,000 Active 94 DOM
-
2026-06-13days on market $200,000 Active 93 DOM
-
2026-06-09days on market $200,000 Active 90 DOM
-
2026-06-08days on market $200,000 Active 89 DOM
-
2026-06-07days on market $200,000 Active 88 DOM
-
2026-06-04days on market $200,000 Active 85 DOM
-
2026-06-03days on market $200,000 Active 84 DOM
-
2026-06-02days on market $200,000 Active 83 DOM
-
2026-06-02days on market $200,000 Active 82 DOM
-
2026-05-31days on market $200,000 Active 81 DOM
-
2026-04-02status Active
-
2026-04-02historical
-
2026-03-11$200,000 Active
-
2024-09-30historical
-
2024-09-02status Active
-
2024-09-01status Pending
-
2024-08-27$205,000 Active
-
2020-10-22historical
-
2020-08-20$239,900 Active
-
2019-07-09historical
-
2019-04-29$129,000 Active
-
2019-04-29soldstatus $86,000
-
1994-03-01soldstatus $60,000
-
1976-06-01soldstatus $18,500
ⓘ Source: listings_history table (triggers on properties + properties_extension) + one-shot
backfill from property_details.listing_events for pre-trigger history.
Tax reassessment forecast FL · Resets to sale price
- Current annual tax
- $4,189 · $349/mo
- Projected year-2 tax
- $4,189 · $349/mo
- Expected delta
- $0/yr ($0/mo · 0.0%)
ⓘ Screening estimate from a state-policy table — verify with the county assessor before closing.
Climate risk First Street
- Flood 1/10 Low FEMA zone X (unshaded) · 0% chance over 30 yrs
- Wildfire 1/10 Low
- Heat 9/10 Extreme 7 d/yr ≥107°F today · 22 d/yr by 30 yrs out
- Wind 9/10 Extreme 99% chance of damaging wind over 30 yrs
- Air quality 2/10 Low 1 unhealthy d/yr today · 1 by 30 yrs out
Nearby sold comps map
Loading sold comps map…
Walkable amenities ~0.75 mi
Loading nearby amenities…
Taxation est. · year 1
- Rental income
- $22,556
- − Mortgage interest
- −$11,203
- − Property taxes
- −$4,189
- − Insurance
- −$1,000
- − Repairs & maintenance
- −$1,805
- − Management
- −$1,805
- − Depreciation
- −$5,818
- Taxable loss
- −$3,263
- Est. tax savings @ 24.0%
- +$783
- After-tax cash flow
- $827/yr
For passive investors: Depreciation is non-cash, so a rental often shows a tax loss while cash-flowing — sheltering income. Rental losses are passive: they offset passive income freely, and up to $25,000/yr can offset ordinary (W-2) income if you actively participate and your MAGI is under $100k (phasing out to $0 by $150k); unused losses carry forward. On sale, claimed depreciation is recaptured at up to 25%, and gains may owe capital-gains tax (a 1031 exchange can defer both). Figures are a year-1 estimate at your 24.0% rate — not tax advice; consult a CPA.
Schools (NCES district)
- District
- Orange
- NCES district ID
- 1201440
- Math proficiency
- 46% ▼ -9.00%
- Reading proficiency
- 51% ▼ -2.00%
- Median HH income
- $49,350
- Composite
- 41.47/100
- National rank
- #3461
- State rank
- #43 of 73 in FL
Livability — Orlando
- Score
- 86/100
- State rank
- #12
- US rank
- #360
Category grades
Schools grade is shown separately in the Schools card above.
Census & demographics
- Census place
- Orlando, FL
- County
- Orange County · 1,471,359 people
- City population
- 964,969
- Metro
- Orlando-Kissimmee-Sanford, FL
- Population (ZIP)
- 34,456
- Household income
- $59,971
- Rent vs Own
- Severe rent burden
- 1566.0
Population outlook (Orange County) Hauer SSP2
- Today (2025)
- 1,618,226 people
- By 2030
- 1,787,404 · +10.5%
- By 2040
- 2,125,621 · +31.4%
- By 2050
- 2,454,016 · +51.6%
- By 2075
- 3,173,711 · +96.1%
- By 2100
- 3,607,781 · +122.9%
Race, ethnicity, and origin ACS 2023
- Neighborhood character
- Majority Hispanic (62%)
- Race & ethnicity
- Hispanic / Latino 62% White 25% Two or more races 24% Black 6% Asian 4%
- Hispanic origin (detail)
- Mexican 6% Puerto Rican 28% Cuban 7% Dominican 5%
- Common ancestry
- Romanian 1% Slovak 1% Lithuanian 1%
- Foreign-born
- 26% · Canada, Jamaica, Vietnam
- Languages at home
- 44% English-only · Spanish 52% Vietnamese 2% Other Indo-European 1%
Political lean MEDSL · Orange
- 2024 margin
- D (+13.6) · D 56.1% · R 42.5% · Other 1.3%
- 2008→2024 swing
- -5.0pp toward R · 2008: 18.6pp · 2024: 13.6pp
- All cycles
- 2024: D+13.6 2020: D+23.1 2016: D+24.6 2012: D+18.2 2008: D+18.6
Not yet ingested
- Civics
- —
Market trends
- HPI YoY
- ▼ -97.72%
- Current HPI
- 388.4089
- Rent YoY
- ▲ 2.60%
- Metro
- Orlando-Kissimmee-Sanford, FL
- State GDP YoY
- ▲ 3.28%
- F500 in state
- 36
Industry mix (Fortune 500 HQ in FL)
| Industry | F500 HQs | Revenue |
|---|---|---|
| Industrial Technology | 2 | $29B |
|
||
| Insurance | 2 | $17B |
|
||
| Retail | 1 | $60B |
|
||
| Technology Distribution | 1 | $58B |
|
||
| Homebuilding | 1 | $35B |
|
||
| Technology Manufacturing | 1 | $35B |
|
||
Price history
+981.1% since first listed14 events — show timeline
- 2026-04-02 Relisted — Stellar MLS as Distributed by MLS Grid
- 2026-04-02 Listing Removed — Stellar MLS as Distributed by MLS Grid
- 2026-03-11 Listed $200,000 Stellar MLS as Distributed by MLS Grid
- 2024-09-30 Listing Removed — Stellar MLS as Distributed by MLS Grid
- 2024-09-02 Relisted — Stellar MLS as Distributed by MLS Grid
- 2024-09-01 Pending — Stellar MLS as Distributed by MLS Grid
- 2024-08-27 Listed $205,000 Stellar MLS as Distributed by MLS Grid
- 2020-10-22 Listing Removed — Stellar MLS as Distributed by MLS Grid
- 2020-08-20 Listed $239,900 Stellar MLS as Distributed by MLS Grid
- 2019-07-09 Listing Removed — Stellar MLS as Distributed by MLS Grid
- 2019-04-29 Sold (Public Records) $86,000 Public Records
- 2019-04-29 Listed $129,000 Stellar MLS as Distributed by MLS Grid
- 1994-03-01 Sold (Public Records) $60,000 Public Records
- 1976-06-01 Sold (Public Records) $18,500 Public Records
Property tax history
+10.4%/yrLatest (2025): $4,189 · +3.7% YoY. Source: county tax records.
Cash-flow waterfall
monthlySold comps — $/sqft
last 12 mo · ≤1 miLoading sold comps…