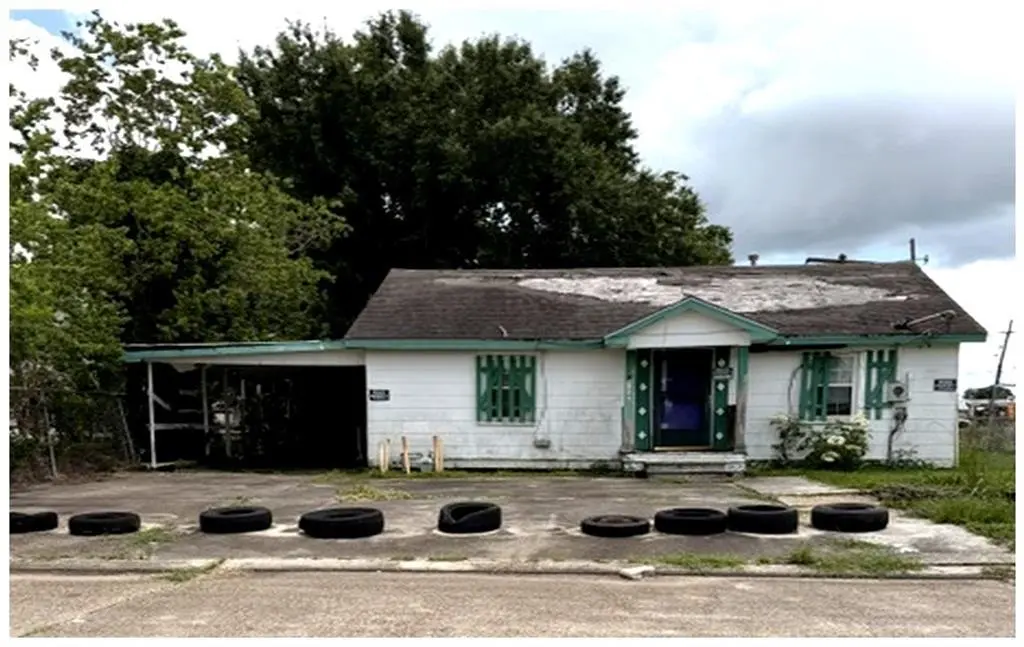
421 Louise St · Houma, LA
Flood risk No data
- FEMA flood zone
- —
- Chance of flooding over 30 yrs
- —
- Est. flood insurance / yr
- —
Fire risk No data
- Est. fire insurance / yr
- —
Heat risk No data
- Hot days now (above threshold)
- —
- Hot days in 30 yrs
- —
Wind risk No data
- Chance of severe wind over 30 yrs
- —
Air-quality risk No data
- Unhealthy air days now
- —
- Unhealthy air days in 30 yrs
- —
Risk factors via First Street. Map © Google.
Why this score? — see what drove the B- grade
The composite is a weighted blend of 9 inputs, each scored 0–100. Each bar is that input's sub-score; the figure is the points it added to the 100-point composite (weight × sub-score).
- Cash flow +30.0/30.0
- 1% rule +10.0/10.0
- DSCR +10.0/10.0
- ARV discount +7.5/15.0
- Schools +3.3/10.0
- Livability +3.2/5.0
- Rent growth +2.5/5.0
- Condition / age +1.0/5.0
- Appreciation +0.0/10.0
$63,000
🖨 Deal sheet (PDF) 📄 Offer letter ✓ Due diligence
Listing remarks MLS
Investor special! This property is in poor condition and will require significant repairs, including roof damage and flooring repairs, making it well-suited for experienced investors or renovation specialists. Great opportunity to restore, renovate, or add to your investment portfolio. Property sold as-is with seller making no repairs.
Key facts
- 7,204 sq ft lot
- Parking
- Built 1988
Property features AI
Exterior
- Parking: Driveway
- Utilities: Public water; Public sewer
- Home design: Single-story property; Raised foundation; Shingle roof
- Construction: Raised foundation; Shingle roof
- Exterior features: City lot; Rectangular lot; Lot dimensions approximately 60 x 120
Interior
- Bathrooms: 1 full bathroom; 1 half bathroom
- Heating & cooling: Central heating; Central air conditioning
- Interior features: Total of 8 rooms; Property listed in poor condition
Neighborhood map
What this means for you Summary
Snapshot
- This is a 3-bed/1.5-bath other listed at $63k. Condition is rated poor.
Deal economics
- At list price, monthly cash flow is $546 ($7k/yr) — positive.
- The deal already cash-flows at list — no discount required.
- Meets the 1% rule at list price ($1k rent vs $63k).
- Recommended offer: $62k (1.5% below list) — sets the bar for market timing.
- Cap rate 16.7% vs local median 4.0% in Houma — top-decile yield for the area; either an underpriced asset or a hidden risk that comps aren't pricing in. Stress-test before assuming the spread holds.
Location & tenants
- Location reads 64/100 on livability (#165 in LA) — a middle-class / working-renter tenant base. Strengths: cost of living A+, housing A; Watch: employment D, crime D-, amenities F.
- Terrebonne Parish (other): math 32% / reading 46% proficiency, ranked #23 of 98 in LA (top 24%) — families likely to look elsewhere, expect single-tenant / working-renter base with shorter leases; 62% free/reduced lunch — lower-income household profile, screen leases tightly.
- Zoned schools: Honduras Elementary School (math 27% / reading 42%, grade F, #284 of 646 statewide, top 46%, 281 students, 71% FRL); Oaklawn Middle School (math 18% / reading 37%, grade F, #127 of 218 statewide, top 60%, 587 students, 66% FRL); Ellender Memorial High School (math 27% / reading 28%, grade F, #133 of 265 statewide, top 51%, 868 students, 63% FRL) — zoned schools at 66% FRL track the district average.
- Market conditions: 206 active listings in the ZIP; 7 comparable units currently listed for rent nearby; rentals lingering (median 46d on market — plan ~5-8 weeks vacancy on turnover, expect pricing pressure); 100% of comp listings sitting > 30 days — soft ceiling on asking rent; 300 units permitted in Terrebonne Parish in 2024 (0 in 5+ unit buildings).
Forward outlook
- Local home prices are declining (-3.0%/yr); year-one equity from $436 of loan paydown is wiped out by about $2k of value loss. Plan a longer hold.
- At projected returns (-3.0% appreciation + 3.0% rent growth), your $18k cash investment doubles in ~4 years — after that, you're playing with house money.
Negotiation context
- It's been on market 21 days — a 2% lower offer ($62k) is reasonable based on typical stale-listing flexibility.
- 2 sale attempts with the ask held roughly flat each time — persistent listings suggest the price (not the market) is what's stuck; bring a comps-based counter.
Questions for the listing agent
- Have any recent inspections been done? Can we get a copy of the seller's disclosures and any deferred-maintenance estimates?
- Is there a deadline driving the sale (1031 exchange, divorce, estate, relocation)? That informs how much negotiation room exists.
- Schools are B-rated — typically a magnet for longer-tenancy family renters. What's the average tenant stay here, and is there a school-zone premium baked into asking?
- Crime grade is D in this area — have there been break-ins, vandalism, or insurance claims at this property in the last 3 years? What carrier currently insures it and at what premium?
- What's the average days-on-market for RENTAL listings here right now (not sales)? A rising rental-DOM trend means longer vacancies and softer asking-rent achievability than the comps imply.
- What's the recent tenant-quality profile in this submarket — average credit score on applications, eviction rate, late-payment / NSF rate, and stable-employment percentage? A property-management company in the area should have these aggregated.
- How much new for-sale + rental construction is in the pipeline within 1–3 miles? Heavy new supply typically softens prices + rents 12–24 months out; constrained supply supports both.
Investment metrics
- 1% rule
- 1.90% ✓
- Cap rate
- 16.69%
- Cash-on-cash
- 37.14%
- DSCR
- 2.65
- GRM
- 4.4
CMA / ARV
No comps found within radius.
Projected returns pro-forma
-3.0% appreciation · 3.0% rent growth · sell at horizon
- IRR
- 33.0%
- Equity multiple
- 2.39×
- Total profit
- $24,562
- Equity at exit
- $9,394
- IRR
- 40.0%
- Equity multiple
- 4.75×
- Total profit
- $66,151
- Equity at exit
- $5,447
Cash invested: $17,640 (down + closing). Projections, not guarantees.
Landlord ↔ Tenant lean methodology
- Overall (STATE)
- 90 Strongly Landlord-Friendly
- State Louisiana
- 90 Strongly Landlord-Friendly · R+12
- County
- — inherits STATE
- City
- — inherits STATE
ZIP-level market 70363
- Active inventory
- 206
- Price-to-rent
- 4.4×
Monthly cashflow live
- Estimated rent
- $1,198 high interval (Pro) →
- Mortgage (P&I)
- −$330
- Tax from tax record
- −$44 /mo · $526/yr
- Insurance
- −$26
- HOA
- −$0
- Vacancy / Maint / Mgmt
- −$252
- Net cashflow
- $546
Break-even live
Sensitivity live
| Price | -10% $582 | -5% $564 | +0% $546 | +5% $528 | +10% $510 |
|---|---|---|---|---|---|
| Rent | -10% $451 | -5% $499 | +0% $546 | +5% $593 | +10% $641 |
| Rate | -1.0pp $578 | -0.5pp $562 | base $546 | +0.5pp $530 | +1.0pp $513 |
UW: 25.0% down · 7.5% · 30yr · 1.5% tax · 5.0% vac · 8.0% maint · 8.0% mgmt
Financing live
Cash to close
- Down payment
- $15,750
- Closing costs
- $1,890
- Reserves months
- —
- Total cash needed
- —
Loan-product check · same deal, 3 products live
Conventional
25% down · 7.5% · 30yr
- Down + closing
- —
- Monthly P&I
- —
- Monthly cashflow
- —
- DSCR
- —
- Eligible?
- —
Personal DTI + credit; lowest rate.
DSCR
20% down · 8.5% · 30yr
- Down + closing
- —
- Monthly P&I
- —
- Monthly cashflow
- —
- DSCR
- —
- Eligible?
- —
No personal income docs; deal must DSCR.
Hard money
10% down · 12.0% · 12mo
- Down + closing
- —
- Monthly P&I
- —
- Monthly cashflow
- —
- DSCR
- —
- Eligible?
- —
Short-term bridge; refi at stabilization.
Rent comps 7 comps
| Address | Beds | Baths | Sqft | Rent | $/sqft | DOM | Units | Dist |
|---|---|---|---|---|---|---|---|---|
| 100 Chateau Ct Houma, LA | 2.0 | 2.5 | 988 | $1,262 | $1.28 | 45d | 5 | 0.57mi |
| 810 Saadi St Houma, LA | 2.0 | 1.0 | 754 | $1,300 | $1.72 | 45d | 3 | 0.57mi |
| 211 Saint Malo St Houma, LA | 3.0 | 1.0 | 951 | $1,050 | $1.10 | 45d | 1 | 0.59mi |
| 885 High St Houma, LA | 2.0 | 1.0 | 801 | $1,100 | $1.37 | 45d | 1 | 0.61mi |
| 179 Garnet St Unit B Houma, LA | 3.0 | 1.0 | 1100 | $1,200 | $1.09 | 45d | 1 | 0.73mi |
| 1300 Laban Ave Houma, LA | 1.0–3.0 | 1.0–1.5 | 896 | $1,347 | $1.50 | 45d | 41 | 0.82mi |
| 1140 Church St Unit B Houma, LA | 2.0 | 1.0 | 1000 | $1,150 | $1.15 | 45d | 1 | 1.18mi |
Listing history 17 events
-
2026-06-21days on market $63,000 Active 21 DOM
-
2026-06-19days on market $63,000 Active 19 DOM
-
2026-06-18days on market $63,000 Active 18 DOM
-
2026-06-17days on market $63,000 Active 17 DOM
-
2026-06-16days on market $63,000 Active 16 DOM
-
2026-06-15days on market $63,000 Active 15 DOM
-
2026-06-14days on market $63,000 Active 13 DOM
-
2026-06-13days on market $63,000 Active 12 DOM
-
2026-06-10days on market $63,000 Active 10 DOM
-
2026-06-09days on market $63,000 Active 9 DOM
-
2026-06-08days on market $63,000 Active 8 DOM
-
2026-06-07days on market $63,000 Active 7 DOM
-
2026-06-05days on market $63,000 Active 4 DOM
-
2026-06-03days on market $63,000 Active 3 DOM
-
2026-06-02days on market $63,000 Active 2 DOM
-
2026-06-01remarks 337-char remark
-
2026-06-01$63,000 Active 1 DOM
ⓘ Source: listings_history table (triggers on properties + properties_extension) + one-shot
backfill from property_details.listing_events for pre-trigger history.
Tax reassessment forecast LA · Resets to sale price
- Current annual tax
- $526 · $44/mo
- Projected year-2 tax
- $526 · $44/mo
- Expected delta
- $0/yr ($0/mo · 0.0%)
ⓘ Screening estimate from a state-policy table — verify with the county assessor before closing.
Nearby sold comps map
Loading sold comps map…
Walkable amenities ~0.75 mi
Loading nearby amenities…
Taxation est. · year 1
- Rental income
- $14,376
- − Mortgage interest
- −$3,529
- − Property taxes
- −$526
- − Insurance
- −$315
- − Repairs & maintenance
- −$1,150
- − Management
- −$1,150
- − Depreciation
- −$1,833
- Taxable income
- $5,873
- Est. tax owed @ 24.0%
- −$1,410
- After-tax cash flow
- $5,142/yr
For passive investors: Depreciation is non-cash, so a rental often shows a tax loss while cash-flowing — sheltering income. Rental losses are passive: they offset passive income freely, and up to $25,000/yr can offset ordinary (W-2) income if you actively participate and your MAGI is under $100k (phasing out to $0 by $150k); unused losses carry forward. On sale, claimed depreciation is recaptured at up to 25%, and gains may owe capital-gains tax (a 1031 exchange can defer both). Figures are a year-1 estimate at your 24.0% rate — not tax advice; consult a CPA.
Condition & rehab AI · 7 photos
This property requires extensive repairs and renovations, including a new roof, kitchen and bathroom updates, and exterior painting. Significant investment is needed to restore it to a livable condition.
Repairs flagged
- Major Kitchen ceiling — Exposed and damaged
- Major Kitchen cabinets — Missing
- Major Kitchen flooring — Damaged
- Major Bathroom ceiling — Exposed and damaged
- Major Bathroom fixtures — Missing
- Major Roof — Significant damage
- Major Exterior siding — Peeling paint
- Major Exterior paint — Peeling
Value-add opportunities
- Both New roof — Critical to safety and appearance
- Both New kitchen cabinets and flooring — Essential for functionality and aesthetics
- Both New bathroom fixtures and ceiling — Improves functionality and appearance
- Both Painting exterior and interior — Enhances curb appeal and interior aesthetics
Renovation cost estimate screening
| Repair item | Severity | Est. cost |
|---|---|---|
| Kitchen ceiling · Exposed and damaged | Major | $15,000–50,000 |
| Kitchen cabinets · Missing | Major | $15,000–50,000 |
| Kitchen flooring · Damaged | Major | $15,000–50,000 |
| Bathroom ceiling · Exposed and damaged | Major | $15,000–50,000 |
| Bathroom fixtures · Missing | Major | $15,000–50,000 |
| Roof · Significant damage | Major | $15,000–50,000 |
| Exterior siding · Peeling paint | Major | $15,000–50,000 |
| Exterior paint · Peeling | Major | $15,000–50,000 |
| Total estimated repair cost · 8 items | $120,000–400,000 |
Value-add ROI direction
- Both New roof — Critical to safety and appearance ↑
- Both New kitchen cabinets and flooring — Essential for functionality and aesthetics ↑
- Both New bathroom fixtures and ceiling — Improves functionality and appearance ↑
- Both Painting exterior and interior — Enhances curb appeal and interior aesthetics ↑
ⓘ Cost ranges are severity-bucket heuristics (US national rule-of-thumb). Get contractor quotes + a written scope before underwriting a rehab budget.
Schools (NCES district)
- District
- Terrebonne Parish
- NCES district ID
- 2201740
- Math proficiency
- 32% ▼ -36.00%
- Reading proficiency
- 46% ▼ -30.00%
- Median HH income
- $47,612
- Composite
- 33.38/100
- National rank
- #5480
- State rank
- #23 of 98 in LA
Livability — Houma
- Score
- 64/100
- State rank
- #165
- US rank
- #13966
Category grades
Schools grade is shown separately in the Schools card above.
Census & demographics
- Census place
- Houma, LA
- City population
- 57,290
- Population (ZIP)
- 24,668
Population outlook (Terrebonne County) Hauer SSP2
- Today (2025)
- 118,724 people
- By 2030
- 120,321 · +1.3%
- By 2040
- 121,894 · +2.7%
- By 2050
- 121,119 · +2.0%
- By 2075
- 117,270 · -1.2%
- By 2100
- 107,544 · -9.4%
Race, ethnicity, and origin ACS 2023
- Neighborhood character
- Diverse neighborhood (Simpson 0.62)
- Race & ethnicity
- White 57% Black 22% Hispanic / Latino 9% Two or more races 8% Native American 8%
- Hispanic origin (detail)
- Mexican 2%
- Common ancestry
- Lithuanian 16% Italian 1%
- Foreign-born
- 5% · Canada
- Languages at home
- 88% English-only · Spanish 7% French/Haitian/Cajun 4%
Political lean MEDSL · Terrebonne
- 2024 margin
- Solid R (+51.8) · D 23.5% · R 75.3% · Other 1.2%
- 2008→2024 swing
- -11.0pp toward R · 2008: -40.9pp · 2024: -51.8pp
- All cycles
- 2024: R+51.8 2020: R+50.0 2016: R+48.4 2012: R+41.2 2008: R+40.9
Not yet ingested
- Civics
- —
Market trends
- HPI YoY
- ▼ -99.27%
- Current HPI
- 91.3914
- Rent YoY
- —
- Metro
- —
- State GDP YoY
- ▲ 3.29%
- F500 in state
- 10
Industry mix (Fortune 500 HQ in LA)
| Industry | F500 HQs | Revenue |
|---|---|---|
| Telecommunications | 2 | $23B |
|
||
| Utilities | 1 | $12B |
|
||
| Wholesale / Distribution | 1 | $5B |
|
||
| Advertising | 1 | $2B |
|
||
Price history
+0.0% since first listed2 events — show timeline
- 2026-05-31 Listed $63,000 AcadianaMLS
- 2026-05-31 Listed $63,000 GSREIN
Property tax history
+2.1%/yrLatest (2025): $526 · -2.3% YoY. Source: county tax records.
Cash-flow waterfall
monthlySold comps — $/sqft
last 12 mo · ≤1 miLoading sold comps…