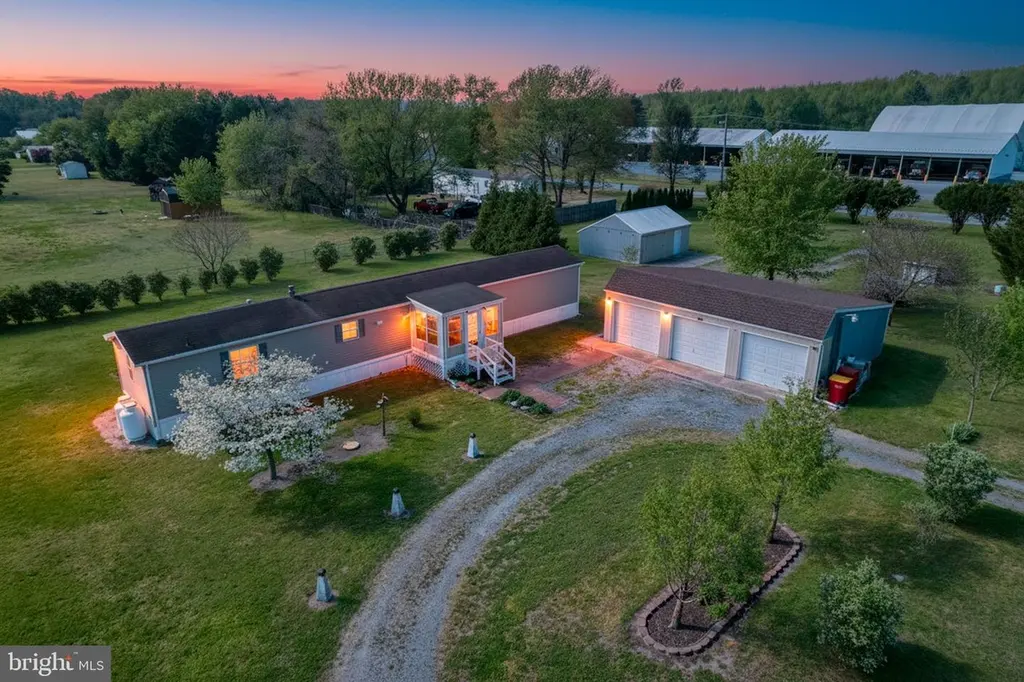
242 Jackson Ditch Rd · Harrington, DE
Flood risk 1/10 · Minimal
- FEMA flood zone
- X (unshaded)
- Chance of flooding over 30 yrs
- 0.0%
- Est. flood insurance / yr
- $507 – $1,088
Fire risk 1/10 · Minimal
- Est. fire insurance / yr
- $476 – $884
Heat risk 8/10 · Major
- Hot days now (above 102°F)
- 7 days/yr
- Hot days in 30 yrs
- 16 days/yr
Wind risk 6/10 · Moderate
- Chance of severe wind over 30 yrs
- 75.0%
Air-quality risk 2/10 · Minimal
- Unhealthy air days now
- 1 days/yr
- Unhealthy air days in 30 yrs
- 1 days/yr
Risk factors via First Street. Map © Google.
Why this score? — see what drove the D grade
The composite is a weighted blend of 9 inputs, each scored 0–100. Each bar is that input's sub-score; the figure is the points it added to the 100-point composite (weight × sub-score).
- Cash flow +12.0/30.0
- ARV discount +7.5/15.0
- Appreciation +4.0/10.0
- Livability +3.7/5.0
- DSCR +3.5/10.0
- Schools +3.0/10.0
- Rent growth +2.5/5.0
- Condition / age +2.5/5.0
- 1% rule +2.1/10.0
$225,000
🖨 Deal sheet (PDF) 📄 Offer letter ✓ Due diligence
Listing remarks
Do not miss this great opportunity! You're going to get a single wide featuring 3 beds, 2 baths, a front porch , central air, that is move in ready. A large garage that has 3 bays (35X27 equaling 945 sqft) , with electric and a side door entrance. Another smaller garage (20X24 equaling 480 sqft) that has 1 large bay plus electric and water (another set of washer/dryer hookups are out there as well). All of this sits on 1.03 acres of pristine country land and offers a large U shaped driveway which gives you two entrances. FINANCING IS AVAILABLE. Schedule for your private tour today!
Key facts
- Large garage
- Front porch
- Washer dryer hookups
Tags
Property features AI
Exterior
- Parking: Detached 4-car garage with front and side entry and garage door opener; Approximately 945 sq. ft. of garage space; Gravel circular driveway providing about 10 driveway spaces; Total of about 14 garage and parking spaces
- Utilities: Well water; Gravity septic field sewer; Electric service for cooling and hot water
- Home design: Manufactured single-wide home; Very good to good condition; Fee simple ownership
- Construction: Mixed construction materials; Shingle roof; Other-type foundation; Above-grade and below-grade outbuildings; Built year per assessor
- Exterior features: Gutter system; Outbuilding(s); Cleared, level lot
Interior
- Bedrooms: Three bedrooms on the main level
- Flooring: Carpet; Laminate plank
- Bathrooms: Two full bathrooms (both on the main level)
- Heating & cooling: 90% efficient forced air heating; Central air conditioning; Electric hot water
- Interior features: Traditional floor plan; Entry-level bedroom; Master bath; Tub with shower; Walk-in shower; Paneled walls
Neighborhood map
What this means for you Summary
Snapshot
- This is a 3-bed/2.0-bath manufactured listed at $225k.
Deal economics
- At list price, monthly cash flow is $-55 ($-656/yr) — negative.
- To cash-flow at today's rent, offer at most $215k (4.3% below list).
- To meet the 1% rule (rent ≥ 1% of price), the offer needs to be $160k (28.9% below list).
- Recommended offer: $160k (28.9% below list) — sets the bar for 1% rule.
- Cap rate 6.0% vs local median 3.5% in Harrington — top-decile yield for the area; either an underpriced asset or a hidden risk that comps aren't pricing in. Stress-test before assuming the spread holds.
Location & tenants
- Location reads 73/100 on livability (#9 in DE) — a middle-class / working-renter tenant base. Strengths: cost of living A+, housing A+, health & safety A+; Watch: crime D+, amenities F, commute F.
- Lake Forest School District (rural): math 26% / reading 44% proficiency, ranked #13 of 26 in DE (top 50%) — families likely to look elsewhere, expect single-tenant / working-renter base with shorter leases.
- Zoned schools: Lake Forest South Elementary School (math 17% / reading 27%, grade F, #70 of 105 statewide, top 70%, 379 students, 0% FRL); Chipman (W.T.) Middle School (math 24% / reading 45%, grade F, #12 of 36 statewide, top 34%, 965 students, 0% FRL); Lake Forest High School (math 27% / reading 47%, grade F, #16 of 40 statewide, top 38%, 870 students, 0% FRL) — zoned schools average 0% FRL vs 47% district-wide (47 pts lower); this property's tenant base skews higher-income than the district average.
- Market conditions: 76 active listings in the ZIP; 1 comparable units currently listed for rent nearby; 1,201 units permitted in Kent County in 2024 (116 in 5+ unit buildings).
Forward outlook
- Local home prices are declining (-2.1%/yr); year-one equity from $2k of loan paydown is wiped out by about $5k of value loss. Plan a longer hold.
- Kent County population projected at +22% by 2050 — long-run rental-demand tailwind backs the buy-and-hold thesis.
Negotiation context
- Only 11 days on market — expect competitive offers; lowballing is unlikely to land.
Risks & watch-outs
- Climate carrying-cost: major wind risk, 75% chance of damaging wind over 30y; extreme-heat days projected 7→16/yr by 2055 (HVAC capex compounding) — expect insurance premiums to compound above CPI over the hold.
Questions for the listing agent
- What do current leases actually rent for vs. the listed asking? Can we see a recent rent roll and the last 12 months of T-12 income?
- Is there a deadline driving the sale (1031 exchange, divorce, estate, relocation)? That informs how much negotiation room exists.
- Crime grade is D in this area — have there been break-ins, vandalism, or insurance claims at this property in the last 3 years? What carrier currently insures it and at what premium?
- The area grade is low — what's the realistic commute time and amenity access for the typical tenant pool here? Any planned neighborhood developments (good or bad) we should know about?
- What's the average days-on-market for RENTAL listings here right now (not sales)? A rising rental-DOM trend means longer vacancies and softer asking-rent achievability than the comps imply.
- What's the recent tenant-quality profile in this submarket — average credit score on applications, eviction rate, late-payment / NSF rate, and stable-employment percentage? A property-management company in the area should have these aggregated.
- How much new for-sale + rental construction is in the pipeline within 1–3 miles? Heavy new supply typically softens prices + rents 12–24 months out; constrained supply supports both.
Investment metrics
- 1% rule
- 0.71% ✗
- Cap rate
- 6.00%
- Cash-on-cash
- -1.04%
- DSCR
- 0.95
- GRM
- 11.7
CMA / ARV
No comps found within radius.
Projected returns pro-forma
-2.07% appreciation · 3.0% rent growth · sell at horizon
- IRR
- -12.6%
- Equity multiple
- 0.50×
- Total profit
- $-31,188
- Equity at exit
- $42,990
- IRR
- -5.0%
- Equity multiple
- 0.62×
- Total profit
- $-24,247
- Equity at exit
- $36,066
Cash invested: $63,000 (down + closing). Projections, not guarantees.
Landlord ↔ Tenant lean methodology
- Overall (STATE)
- 70 Landlord-Friendly
- State Delaware
- 70 Landlord-Friendly · D+7
- County
- — inherits STATE
- City
- — inherits STATE
ZIP-level market 19952
- Home prices YoY
- -0.8%
- Active inventory
- 76
- Price-to-rent
- 11.7×
Monthly cashflow live
- Estimated rent
- $1,600 medium interval (Pro) →
- Mortgage (P&I)
- −$1,180
- Tax from tax record
- −$45 /mo · $540/yr
- Insurance
- −$94
- HOA
- −$0
- Vacancy / Maint / Mgmt
- −$336
- Net cashflow
- $-55
Break-even live
Sensitivity live
| Price | -10% $73 | -5% $9 | +0% $-55 | +5% $-118 | +10% $-182 |
|---|---|---|---|---|---|
| Rent | -10% $-181 | -5% $-118 | +0% $-55 | +5% $9 | +10% $72 |
| Rate | -1.0pp $59 | -0.5pp $3 | base $-55 | +0.5pp $-113 | +1.0pp $-172 |
UW: 25.0% down · 7.5% · 30yr · 1.5% tax · 5.0% vac · 8.0% maint · 8.0% mgmt
Financing live
Cash to close
- Down payment
- $56,250
- Closing costs
- $6,750
- Reserves months
- —
- Total cash needed
- —
Loan-product check · same deal, 3 products live
Conventional
25% down · 7.5% · 30yr
- Down + closing
- —
- Monthly P&I
- —
- Monthly cashflow
- —
- DSCR
- —
- Eligible?
- —
Personal DTI + credit; lowest rate.
DSCR
20% down · 8.5% · 30yr
- Down + closing
- —
- Monthly P&I
- —
- Monthly cashflow
- —
- DSCR
- —
- Eligible?
- —
No personal income docs; deal must DSCR.
Hard money
10% down · 12.0% · 12mo
- Down + closing
- —
- Monthly P&I
- —
- Monthly cashflow
- —
- DSCR
- —
- Eligible?
- —
Short-term bridge; refi at stabilization.
Rent comps 1 comps
| Address | Beds | Baths | Sqft | Rent | $/sqft | DOM | Units | Dist |
|---|---|---|---|---|---|---|---|---|
| 2A E Milby St Harrington, DE | 2.0 | 1.0 | 1500 | $1,600 | $1.07 | 45d | 1 | 1.21mi |
Listing history 2 events
-
2026-04-28status Pending
-
2026-04-17$225,000 Active
ⓘ Source: listings_history table (triggers on properties + properties_extension) + one-shot
backfill from property_details.listing_events for pre-trigger history.
Tax reassessment forecast DE · Partial reset (capped growth)
- Current annual tax
- $540 · $45/mo
- Projected year-2 tax
- $923 · $77/mo
- Expected delta
- +$382/yr (+$32/mo · 70.8%)
ⓘ Screening estimate from a state-policy table — verify with the county assessor before closing.
Climate risk First Street
- Flood 1/10 Low FEMA zone X (unshaded) · 0% chance over 30 yrs
- Wildfire 1/10 Low
- Heat 8/10 Severe 7 d/yr ≥102°F today · 16 d/yr by 30 yrs out
- Wind 6/10 Major 75% chance of damaging wind over 30 yrs
- Air quality 2/10 Low 1 unhealthy d/yr today · 1 by 30 yrs out
Nearby sold comps map
Loading sold comps map…
Walkable amenities ~0.75 mi
Loading nearby amenities…
Taxation est. · year 1
- Rental income
- $19,200
- − Mortgage interest
- −$12,603
- − Property taxes
- −$540
- − Insurance
- −$1,125
- − Repairs & maintenance
- −$1,536
- − Management
- −$1,536
- − Depreciation
- −$6,545
- Taxable loss
- −$4,686
- Est. tax savings @ 24.0%
- +$1,125
- After-tax cash flow
- $469/yr
For passive investors: Depreciation is non-cash, so a rental often shows a tax loss while cash-flowing — sheltering income. Rental losses are passive: they offset passive income freely, and up to $25,000/yr can offset ordinary (W-2) income if you actively participate and your MAGI is under $100k (phasing out to $0 by $150k); unused losses carry forward. On sale, claimed depreciation is recaptured at up to 25%, and gains may owe capital-gains tax (a 1031 exchange can defer both). Figures are a year-1 estimate at your 24.0% rate — not tax advice; consult a CPA.
Schools (NCES district)
- District
- Lake Forest School District
- NCES district ID
- 1000790
- Math proficiency
- 26% ▼ -23.00%
- Reading proficiency
- 44% ▼ -14.00%
- Median HH income
- $52,034
- Composite
- 30.47/100
- National rank
- #6225
- State rank
- #13 of 26 in DE
Livability — Harrington
- Score
- 73/100
- State rank
- #9
- US rank
- #5270
Category grades
Schools grade is shown separately in the Schools card above.
Census & demographics
- Population (ZIP)
- 10,730
Population outlook (Kent County) Hauer SSP2
- Today (2025)
- 194,477 people
- By 2030
- 204,351 · +5.1%
- By 2040
- 222,135 · +14.2%
- By 2050
- 236,483 · +21.6%
- By 2075
- 266,327 · +36.9%
- By 2100
- 275,335 · +41.6%
Race, ethnicity, and origin ACS 2023
- Neighborhood character
- Predominantly White (84%)
- Race & ethnicity
- White 84% Black 8% Hispanic / Latino 5% Two or more races 4% Asian 1%
- Hispanic origin (detail)
- Mexican 2% Puerto Rican 3%
- Common ancestry
- Slovak 2% Romanian 1% Portuguese 1%
- Foreign-born
- 3% · Canada, Vietnam, South Korea
- Languages at home
- 93% English-only · Spanish 4% Vietnamese 1% German/W. Germanic 1%
Political lean MEDSL · Kent
- 2024 margin
- Toss-up / Even · D 50.2% · R 48.2% · Other 1.7%
- 2008→2024 swing
- -7.8pp toward R · 2008: 9.8pp · 2024: 2.0pp
- All cycles
- 2024: D+2.0 2020: D+4.1 2016: R+4.9 2012: D+4.9 2008: D+9.8
Not yet ingested
- Civics
- —
Market trends
- HPI YoY
- ▼ -2.07%
- Current HPI
- 268.56
- Rent YoY
- —
- Metro
- —
- State GDP YoY
- —
- F500 in state
- 0
Price history
2 events — show timeline
- 2026-04-28 Pending — BRIGHT MLS
- 2026-04-17 Listed $225,000 BRIGHT MLS
Property tax history
+5.0%/yrLatest (2025): $540 · +0.4% YoY. Source: county tax records.
Cash-flow waterfall
monthlySold comps — $/sqft
last 12 mo · ≤1 miLoading sold comps…