523 E 10th St · Chandler, OK
Flood risk 1/10 · Minimal
- FEMA flood zone
- X (unshaded)
- Chance of flooding over 30 yrs
- 0.0%
- Est. flood insurance / yr
- $507 – $1,088
Fire risk 6/10 · Moderate
- Est. fire insurance / yr
- $2,463 – $4,575
Heat risk 6/10 · Moderate
- Hot days now (above 110°F)
- 7 days/yr
- Hot days in 30 yrs
- 18 days/yr
Wind risk 3/10 · Minor
- Chance of severe wind over 30 yrs
- 6.0%
Air-quality risk 2/10 · Minimal
- Unhealthy air days now
- 1 days/yr
- Unhealthy air days in 30 yrs
- 1 days/yr
Risk factors via First Street. Map © Google.
Why this score? — see what drove the B+ grade
The composite is a weighted blend of 9 inputs, each scored 0–100. Each bar is that input's sub-score; the figure is the points it added to the 100-point composite (weight × sub-score).
- Cash flow +30.0/30.0
- 1% rule +10.0/10.0
- DSCR +10.0/10.0
- Appreciation +10.0/10.0
- ARV discount +7.5/15.0
- Livability +3.2/5.0
- Schools +3.0/10.0
- Rent growth +2.5/5.0
- Condition / age +2.5/5.0
$32,500
🖨 Deal sheet 📄 Offer letter ✓ Due diligence
Listing remarks
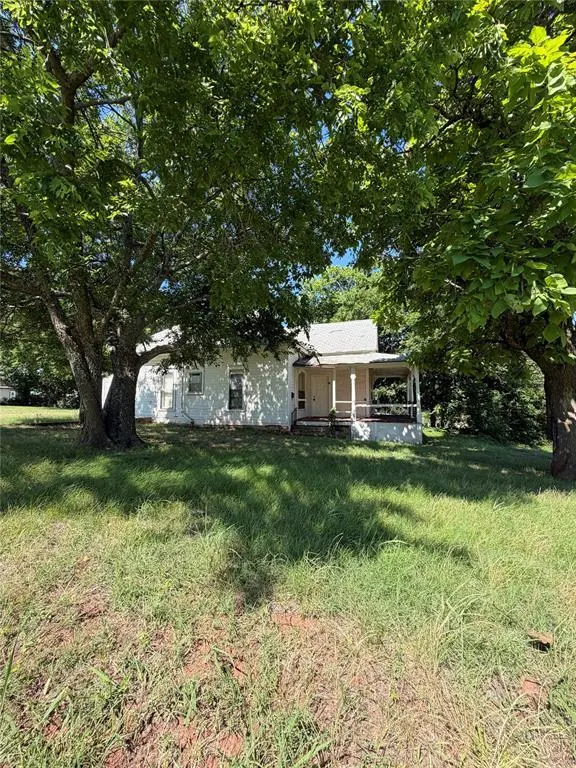
Opportunity awaits with this 2-bedroom home situated on a spacious corner lot in the heart of Chandler. The oversized lot offers endless possibilities—enjoy the extra outdoor space, expand your vision, or explore the potential for an additional homesite, making this an attractive investment opportunity. A charming elevated half wraparound porch provides classic curb appeal, while mature shade trees create a comfortable setting to relax and enjoy Oklahoma evenings. The home does require repairs and a new roof, but for the buyer willing to invest some work and creativity, it offers the chance to restore a property with character and potential. Conveniently located near local amenities,
Key facts
- Local amenities
- Mature shade trees
- Schools
Tags
Property features AI
Finance
- Other: Property is homestead exempt; Lot approximately 0.1492 acres; Located on the southwest corner of E 10th and Dewey in Chandler; Legal addition: Chandler-Hunter
- Financial info: Assumable: No; Loan qualification: Unknown
- HOA & community: No mandatory HOA dues
Exterior
- Parking: No parking details provided
- Security: No security details provided
- Utilities: No water, sewer, or power specifics provided
- Home design: Single family residence; One story; Faces east; Residential property
- Construction: Frame construction; Composition roof; Conventional foundation; Existing property
- Exterior features: Covered porch; Corner lot
Interior
- Kitchen: No kitchen appliance details provided
- Bedrooms: 2 bedrooms
- Flooring: No flooring details provided
- Bathrooms: 1 full bathroom
- Heating & cooling: Other heating; Window unit(s) for cooling
- Interior features: One dining area; One living area; No fireplace; No in-law/bonus plan indicated
- Laundry & utility: No laundry or utility details provided
Neighborhood map
What this means for you Summary
Snapshot
- This is a 3-bed/1.0-bath single-family listed at $32k.
Deal economics
- At list price, monthly cash flow is $546 ($7k/yr) — positive.
- The deal already cash-flows at list — no discount required.
- Meets the 1% rule at list price ($947 rent vs $32k).
- Cap rate 26.5% vs local median 2.8% in Chandler — top-decile yield for the area; either an underpriced asset or a hidden risk that comps aren't pricing in. Stress-test before assuming the spread holds.
Location & tenants
- Location reads 64/100 on livability (#171 in OK) — a middle-class / working-renter tenant base. Strengths: cost of living A+, housing A+; Watch: crime D, employment D, amenities F.
- Chandler (town): math 35% / reading 35% proficiency, ranked #36 of 270 in OK (top 13%) — families likely to look elsewhere, expect single-tenant / working-renter base with shorter leases.
- Zoned schools: Park Road Es (math 38% / reading 36%, grade F, #132 of 845 statewide, top 19%, 313 students, 0% FRL); Chandler Hs (math 47% / reading 52%, grade D, #9 of 447 statewide, top 2%, 335 students, 0% FRL) — zoned schools average 0% FRL vs 42% district-wide (42 pts lower); this property's tenant base skews higher-income than the district average.
- Market conditions: 121 active listings in the ZIP; 19 units permitted in Lincoln County in 2024 (0 in 5+ unit buildings).
Forward outlook
- In year one you build about $3k of equity ($225 loan paydown + $3k appreciation (10.0% local appreciation)).
- At projected returns (10.0% appreciation + 3.0% rent growth), your $9k cash investment doubles in ~1 year — after that, you're playing with house money.
- By year 8, paydown + projected appreciation supports a ~$30k cash-out refi (75% LTV) — recoverable capital for the next deal without selling this one.
Negotiation context
- Only 1 days on market — expect competitive offers; lowballing is unlikely to land.
- Current owner paid $11k; list at $32k implies a 195% gain — meaningful room to come down on a strong offer.
Risks & watch-outs
- Watch-outs: built in 1910 — expect roof / HVAC / electrical / plumbing capex.
- Climate carrying-cost: major wildfire risk; extreme-heat days projected 7→18/yr by 2055 (HVAC capex compounding) — expect insurance premiums to compound above CPI over the hold.
Questions for the listing agent
- Built in 1910 — when were the roof, HVAC, electrical panel, plumbing, and water heater last replaced?
- Is there a deadline driving the sale (1031 exchange, divorce, estate, relocation)? That informs how much negotiation room exists.
- Schools are F-rated, which usually means shorter tenancies and higher turnover. Who's the typical renter profile here, and what's been the actual vacancy rate?
- Crime grade is D in this area — have there been break-ins, vandalism, or insurance claims at this property in the last 3 years? What carrier currently insures it and at what premium?
- What's the average days-on-market for RENTAL listings here right now (not sales)? A rising rental-DOM trend means longer vacancies and softer asking-rent achievability than the comps imply.
- What's the recent tenant-quality profile in this submarket — average credit score on applications, eviction rate, late-payment / NSF rate, and stable-employment percentage? A property-management company in the area should have these aggregated.
- How much new for-sale + rental construction is in the pipeline within 1–3 miles? Heavy new supply typically softens prices + rents 12–24 months out; constrained supply supports both.
Investment metrics
- 1% rule
- 2.92% ✓
- Cap rate
- 26.46%
- Cash-on-cash
- 72.02%
- DSCR
- 4.20
- GRM
- 2.9
CMA / ARV
- ARV (on-the-fly)
- $93,288
- Comps found
- 9
Show comp detail 9 sales within ~0.75 mi
| Address | Dist | Beds/Ba | Sqft | Sold | Price | $/sf | Match |
|---|---|---|---|---|---|---|---|
| 208 E 10th St | 0.25mi | 2/1.0 (-1) | 924 (+3%) | 2mo | $135,000 | $146 | 77 |
| 1014 S Dewey Ave | 0.04mi | 2/1.0 (-1) | 1,010 (+13%) | 9mo | $34,500 | $34 | 65 |
| 912 S Bennett Blvd | 0.12mi | 2/1.5 (-1) | 840 (-6%) | 15mo | $47,500 | $57 | 64 |
| 810 E 9th St | 0.21mi | 3/2.0 | 800 (-11%) | 13mo | $117,000 | $146 | 58 |
| 303 E 4th St | 0.46mi | 2/1.0 (-1) | 864 (-4%) | 15mo | $62,000 | $72 | 54 |
| 820 S Bennett Blvd | 0.16mi | 2/1.0 (-1) | 802 (-11%) | 22mo | $83,500 | $104 | 51 |
| 602 E 6th St | 0.32mi | 2/1.0 (-1) | 1,026 (+14%) | 10mo | $99,000 | $96 | 48 |
| 602 E 9th St | 0.10mi | 2/1.0 (-1) | 768 (-14%) | 23mo | $100,000 | $130 | 47 |
| 306 W 4th St | 0.67mi | 2/1.0 (-1) | 792 (-12%) | 15mo | $115,000 | $145 | 31 |
Match score weights: distance 35% · size 25% · config 20% · recency 20%. Top-matched comps best support the ARV.
Projected returns pro-forma
10.0% appreciation · 3.0% rent growth · sell at horizon
- IRR
- 82.8%
- Equity multiple
- 6.77×
- Total profit
- $52,484
- Equity at exit
- $29,279
- IRR
- 77.1%
- Equity multiple
- 14.98×
- Total profit
- $127,205
- Equity at exit
- $63,140
Cash invested: $9,100 (down + closing). Projections, not guarantees.
Landlord ↔ Tenant lean methodology
- Overall (STATE)
- 83 Strongly Landlord-Friendly
- State Oklahoma
- 83 Strongly Landlord-Friendly · R+20
- County
- — inherits STATE
- City
- — inherits STATE
ZIP-level market 74834
- Home prices YoY
- 19.9%
- Active inventory
- 121
- Price-to-rent
- 2.9×
Monthly cashflow live
- Estimated rent
- $947 medium interval (Pro) →
- Mortgage (P&I)
- −$170
- Tax from tax record
- −$18 /mo · $221/yr
- Insurance
- −$14
- HOA
- −$0
- Vacancy / Maint / Mgmt
- −$199
- Net cashflow
- $546
Break-even live
UW: 25.0% down · 7.5% · 30yr · 1.5% tax · 5.0% vac · 8.0% maint · 8.0% mgmt
Financing live
Cash to close
- Down payment
- $8,125
- Closing costs
- $975
- Reserves months
- —
- Total cash needed
- —
Loan-product check · same deal, 3 products live
Conventional
25% down · 7.5% · 30yr
- Down + closing
- —
- Monthly P&I
- —
- Monthly cashflow
- —
- DSCR
- —
- Eligible?
- —
Personal DTI + credit; lowest rate.
DSCR
20% down · 8.5% · 30yr
- Down + closing
- —
- Monthly P&I
- —
- Monthly cashflow
- —
- DSCR
- —
- Eligible?
- —
No personal income docs; deal must DSCR.
Hard money
10% down · 12.0% · 12mo
- Down + closing
- —
- Monthly P&I
- —
- Monthly cashflow
- —
- DSCR
- —
- Eligible?
- —
Short-term bridge; refi at stabilization.
Listing history 2 events
-
2026-06-18remarks 693-char remark
-
2026-06-18$32,500 Active 1 DOM
ⓘ Source: listings_history table (triggers on properties + properties_extension) + one-shot
backfill from property_details.listing_events for pre-trigger history.
Tax reassessment forecast OK · Resets to sale price
- Current annual tax
- $221 · $18/mo
- Projected year-2 tax
- $292 · $24/mo
- Expected delta
- +$72/yr (+$6/mo · 32.4%)
ⓘ Screening estimate from a state-policy table — verify with the county assessor before closing.
Climate risk First Street
- Flood 1/10 Low FEMA zone X (unshaded) · 0% chance over 30 yrs
- Wildfire 6/10 Major
- Heat 6/10 Major 7 d/yr ≥110°F today · 18 d/yr by 30 yrs out
- Wind 3/10 Moderate 6% chance of damaging wind over 30 yrs
- Air quality 2/10 Low 1 unhealthy d/yr today · 1 by 30 yrs out
Nearby sold comps map
Loading sold comps map…
Walkable amenities ~0.75 mi
Loading nearby amenities…
Taxation est. · year 1
- Rental income
- $11,370
- − Mortgage interest
- −$1,821
- − Property taxes
- −$221
- − Insurance
- −$162
- − Repairs & maintenance
- −$910
- − Management
- −$910
- − Depreciation
- −$945
- Taxable income
- $6,401
- Est. tax owed @ 24.0%
- −$1,536
- After-tax cash flow
- $5,017/yr
For passive investors: Depreciation is non-cash, so a rental often shows a tax loss while cash-flowing — sheltering income. Rental losses are passive: they offset passive income freely, and up to $25,000/yr can offset ordinary (W-2) income if you actively participate and your MAGI is under $100k (phasing out to $0 by $150k); unused losses carry forward. On sale, claimed depreciation is recaptured at up to 25%, and gains may owe capital-gains tax (a 1031 exchange can defer both). Figures are a year-1 estimate at your 24.0% rate — not tax advice; consult a CPA.
Schools (NCES district)
- District
- Chandler
- NCES district ID
- 4007290
- Math proficiency
- 35% ▲ 1.00%
- Reading proficiency
- 35% ▬ 0.00%
- Median HH income
- $45,229
- Composite
- 29.9/100
- National rank
- #6392
- State rank
- #36 of 270 in OK
Livability — Chandler
- Score
- 64/100
- State rank
- #171
- US rank
- #13840
Category grades
Schools grade is shown separately in the Schools card above.
Census & demographics
- Census place
- Chandler, OK
- City population
- 7,551
- Population (ZIP)
- 7,551
Population outlook (Lincoln County) Hauer SSP2
- Today (2025)
- 36,104 people
- By 2030
- 36,435 · +0.9%
- By 2040
- 36,696 · +1.6%
- By 2050
- 36,216 · +0.3%
- By 2075
- 35,057 · -2.9%
- By 2100
- 31,333 · -13.2%
Race, ethnicity, and origin ACS 2023
- Neighborhood character
- Predominantly White (78%)
- Race & ethnicity
- White 78% Two or more races 12% Hispanic / Latino 3% Black 3% Native American 3%
- Common ancestry
- Lithuanian 4% Slovak 2% Scottish 1%
- Foreign-born
- 1%
- Languages at home
- 97% English-only · Spanish 2%
Political lean MEDSL · Lincoln
- 2024 margin
- Solid R (+63.3) · D 17.5% · R 80.8% · Other 1.7%
- 2008→2024 swing
- -13.4pp toward R · 2008: -49.8pp · 2024: -63.3pp
- All cycles
- 2024: R+63.3 2020: R+63.2 2016: R+60.1 2012: R+49.0 2008: R+49.8
Not yet ingested
- Civics
- —
Market trends
- HPI YoY
- ▲ 52.43%
- Current HPI
- 315.8775
- Rent YoY
- —
- Metro
- —
- State GDP YoY
- ▲ 1.55%
- F500 in state
- 6
Industry mix (Fortune 500 HQ in OK)
| Industry | F500 HQs | Revenue |
|---|---|---|
| Energy | 3 | $48B |
|
||
Price history
+30.0% since first listed3 events — show timeline
- 2026-06-17 Listed $32,500 MLSOK
- 2012-01-12 Sold (Public Records) $11,000 Public Records
- 1992-03-13 Sold (Public Records) $25,000 Public Records
Property tax history
+3.8%/yrLatest (2025): $221 · +6.2% YoY. Source: county tax records.
Cash-flow waterfall
monthlySold comps — $/sqft
last 12 mo · ≤1 miLoading sold comps…