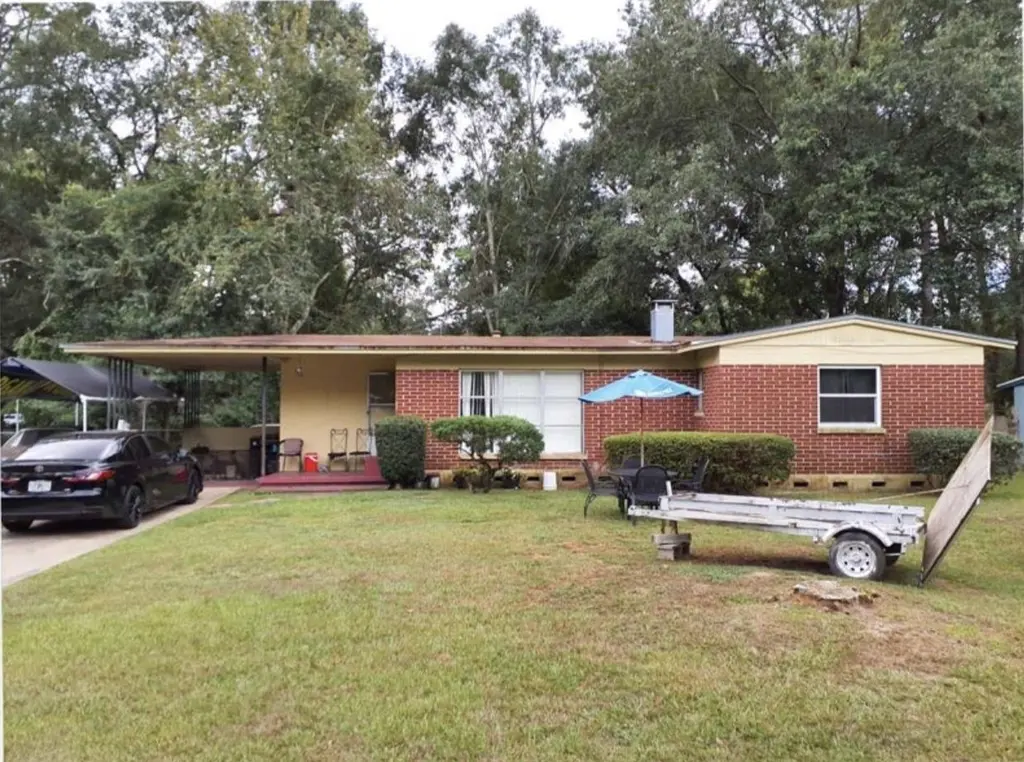
711 Apachee St · Tallahassee, FL
Flood risk 1/10 · Minimal
- FEMA flood zone
- AE
- Chance of flooding over 30 yrs
- 0.0%
- Est. flood insurance / yr
- $1,737 – $8,500
Fire risk 4/10 · Minor
- Est. fire insurance / yr
- $947 – $1,759
Heat risk 8/10 · Major
- Hot days now (above 108°F)
- 7 days/yr
- Hot days in 30 yrs
- 20 days/yr
Wind risk 9/10 · Severe
- Chance of severe wind over 30 yrs
- 99.0%
Air-quality risk 4/10 · Minor
- Unhealthy air days now
- 5 days/yr
- Unhealthy air days in 30 yrs
- 6 days/yr
Risk factors via First Street. Map © Google.
Why this score? — see what drove the C grade
The composite is a weighted blend of 9 inputs, each scored 0–100. Each bar is that input's sub-score; the figure is the points it added to the 100-point composite (weight × sub-score).
- Cash flow +22.9/30.0
- ARV discount +9.4/15.0
- DSCR +7.4/10.0
- 1% rule +5.7/10.0
- Schools +4.3/10.0
- Livability +4.3/5.0
- Rent growth +3.5/5.0
- Condition / age +2.5/5.0
- Appreciation +0.0/10.0
$139,000
🖨 Deal sheet 📄 Offer letter ✓ Due diligence
Listing remarks
INVESTOR SPECIAL!!! This 3/1 home in Apalachee Ridge rents for $1095/month. It is currently rented month to month. BRAND NEW HVAC! Water heater upgraded in 2023. Home inspection available upon request. Sold as-is. Cash or renovation loans only.
Key facts
- Brand new hvac
- 9,583 sq ft lot
- Parking
Tags
Property features AI
Finance
- Financial info: Offered for sale
Exterior
- Parking: Carport (1 space)
- Home design: Single-story; Block and concrete construction
- Construction: Block and concrete construction
- Exterior features: Fully fenced yard; Paved road access
Interior
- Kitchen: Oven; Range
- Bedrooms: Bedroom 2 — 10x10; Bedroom 3 — 10x10; Additional room — 11x11
- Bathrooms: 1 full bathroom; 1 half bathroom
- Interior features: Living room; Family room; Dining room
Neighborhood map
What this means for you Summary
Snapshot
- This is a 3-bed/1.5-bath single-family listed at $139k.
Deal economics
- At list price, monthly cash flow is $-182 ($-2k/yr) — negative.
- To cash-flow at today's rent, offer at most $107k (23.1% below list).
- Meets the 1% rule at list price ($1k rent vs $139k).
- Recommended offer: $107k (23.1% below list) — sets the bar for cash-flow.
- Cap rate 8.4% vs local median 4.2% in Tallahassee — top-decile yield for the area; either an underpriced asset or a hidden risk that comps aren't pricing in. Stress-test before assuming the spread holds.
Location & tenants
- Location reads 86/100 on livability (#19 in FL, #429 nationally) — a professional / high-income tenant draw. Strengths: amenities A+, commute A+, health & safety A+; Watch: employment D.
- Leon (urban): math 48% / reading 53% proficiency, ranked #33 of 73 in FL (top 45%) — acceptable for families but not a draw, mixed tenant base, ~2y average lease.
- Market conditions: Rents rising fast (+4.2%/yr); 121 active listings in the ZIP; 15 comparable units currently listed for rent nearby; rentals at typical pace (median 21d on market — plan ~3-4 weeks tenant-placement turnaround); 1,765 units permitted in Leon County in 2024 (975 in 5+ unit buildings).
- This rent runs 35% of the median local income ($51k/yr) — at the standard rent-burdened threshold; future hikes will face affordability resistance.
Forward outlook
- Local home prices are declining (-3.0%/yr); year-one equity from $961 of loan paydown is wiped out by about $4k of value loss. Plan a longer hold.
- Leon County population projected at +23% by 2050 — long-run rental-demand tailwind backs the buy-and-hold thesis.
Negotiation context
- It's been on market 86 days — a 6% lower offer ($131k) is reasonable based on typical stale-listing flexibility.
- 2 sale attempts with the ask held roughly flat each time — persistent listings suggest the price (not the market) is what's stuck; bring a comps-based counter.
- Current owner paid $35k; list at $139k implies a 297% gain — meaningful room to come down on a strong offer.
Risks & watch-outs
- Watch-outs: flood insurance adds $427/mo; built in 1959 — expect roof / HVAC / electrical / plumbing capex.
- Climate carrying-cost: in FEMA flood zone AE (mandatory federal flood insurance); severe wind risk, 99% chance of damaging wind over 30y; extreme-heat days projected 7→20/yr by 2055 (HVAC capex compounding) — expect insurance premiums to compound above CPI over the hold.
Questions for the listing agent
- What do current leases actually rent for vs. the listed asking? Can we see a recent rent roll and the last 12 months of T-12 income?
- It's been on market 86 days. Have you received any prior offers? Is the seller open to a 23% concession, seller financing, or rate buy-down credit?
- Built in 1959 — when were the roof, HVAC, electrical panel, plumbing, and water heater last replaced?
- What's the actual annual flood-insurance premium (NFIP or private), and is the property in a SFHA with mandatory coverage?
- Why hasn't it sold? Are there any deal-killer items the seller is aware of (foundation, flood, title, zoning, code violations)?
- Is there a deadline driving the sale (1031 exchange, divorce, estate, relocation)? That informs how much negotiation room exists.
- Schools are B-rated — typically a magnet for longer-tenancy family renters. What's the average tenant stay here, and is there a school-zone premium baked into asking?
- What's the average days-on-market for RENTAL listings here right now (not sales)? A rising rental-DOM trend means longer vacancies and softer asking-rent achievability than the comps imply.
- What's the recent tenant-quality profile in this submarket — average credit score on applications, eviction rate, late-payment / NSF rate, and stable-employment percentage? A property-management company in the area should have these aggregated.
- How much new for-sale + rental construction is in the pipeline within 1–3 miles? Heavy new supply typically softens prices + rents 12–24 months out; constrained supply supports both.
Investment metrics
- 1% rule
- 1.07% ✓
- Cap rate
- 8.40%
- Cash-on-cash
- 7.54%
- DSCR
- 1.34
- GRM
- 7.8
CMA / ARV
- ARV (on-the-fly)
- $145,070
- Comps found
- 11
Show comp detail 11 sales within ~0.75 mi
| Address | Dist | Beds/Ba | Sqft | Sold | Price | $/sf | Match |
|---|---|---|---|---|---|---|---|
| 2925 Fairview Dr | 0.34mi | 3/1.0 | 930 (+4%) | 4mo | $156,000 | $168 | 71 |
| 2311 Pontiac Dr | 0.45mi | 3/1.0 | 890 (0%) | 10mo | $140,000 | $157 | 68 |
| 906 Cochran Dr | 0.20mi | 3/1.0 | 924 (+4%) | 18mo | $160,000 | $173 | 67 |
| 2314 Pontiac Dr | 0.43mi | 3/1.0 | 851 (-4%) | 5mo | $139,000 | $163 | 66 |
| 727 Coble | 0.07mi | 3/1.0 | 968 (+9%) | 18mo | $163,000 | $168 | 65 |
| 3009 Fairview Dr | 0.36mi | 3/1.0 | 848 (-5%) | 16mo | $140,000 | $165 | 60 |
| 3005 Fairview Dr | 0.36mi | 3/1.0 | 936 (+5%) | 17mo | $161,000 | $172 | 59 |
| 2312 Dozier Dr | 0.47mi | 3/1.0 | 874 (-2%) | 20mo | $130,000 | $149 | 57 |
| 2419 Dozier Dr | 0.42mi | 3/1.0 | 851 (-4%) | 19mo | $107,500 | $126 | 56 |
| 2403 Country Club Dr | 0.51mi | 2/1.0 (-1) | 872 (-2%) | 14mo | $20,000 | $23 | 55 |
| 3396 Laura St | 0.67mi | 2/1.0 (-1) | 926 (+4%) | 2mo | $145,000 | $157 | 54 |
Match score weights: distance 35% · size 25% · config 20% · recency 20%. Top-matched comps best support the ARV.
Projected returns pro-forma
-3.0% appreciation · 4.16% rent growth · sell at horizon
- IRR
- -23.7%
- Equity multiple
- 0.18×
- Total profit
- $-32,092
- Equity at exit
- $20,725
- IRR
- -14.2%
- Equity multiple
- 0.12×
- Total profit
- $-34,407
- Equity at exit
- $12,018
Cash invested: $38,920 (down + closing). Projections, not guarantees.
Landlord ↔ Tenant lean methodology
- Overall (STATE)
- 87 Strongly Landlord-Friendly
- State Florida
- 87 Strongly Landlord-Friendly · R+3
- County
- — inherits STATE
- City
- — inherits STATE
ZIP-level market 32301
- Rents YoY
- 4.2%
- Active inventory
- 121
- Price-to-rent
- 7.8×
Monthly cashflow live
- Estimated rent
- $1,488 high interval (Pro) →
- Mortgage (P&I)
- −$729
- Tax from tax record
- −$144 /mo · $1,729/yr
- Insurance
- −$58
- Flood insurance flood zone
- −$427 /mo · $5,118/yr
- HOA
- −$0
- Vacancy / Maint / Mgmt
- −$312
- Net cashflow
- $-182
Break-even live
UW: 25.0% down · 7.5% · 30yr · 1.5% tax · 5.0% vac · 8.0% maint · 8.0% mgmt
Financing live
Cash to close
- Down payment
- $34,750
- Closing costs
- $4,170
- Reserves months
- —
- Total cash needed
- —
Loan-product check · same deal, 3 products live
Conventional
25% down · 7.5% · 30yr
- Down + closing
- —
- Monthly P&I
- —
- Monthly cashflow
- —
- DSCR
- —
- Eligible?
- —
Personal DTI + credit; lowest rate.
DSCR
20% down · 8.5% · 30yr
- Down + closing
- —
- Monthly P&I
- —
- Monthly cashflow
- —
- DSCR
- —
- Eligible?
- —
No personal income docs; deal must DSCR.
Hard money
10% down · 12.0% · 12mo
- Down + closing
- —
- Monthly P&I
- —
- Monthly cashflow
- —
- DSCR
- —
- Eligible?
- —
Short-term bridge; refi at stabilization.
Rent comps 15 comps
| Address | Beds | Baths | Sqft | Rent | $/sqft | DOM | Units | Dist |
|---|---|---|---|---|---|---|---|---|
| 3005 S Meridian St Tallahassee, FL | 3.0 | 1.0 | 998 | $2,300 | $2.30 | 21d | 1 | 0.42mi |
| 2873 Jim Lee Rd Tallahassee, FL | 2.0 | 2.0 | 1000 | $925 | $0.93 | 21d | 1 | 0.45mi |
| 401 Putnam Dr Tallahassee, FL | 1.0–2.0 | 1.0–2.0 | 766 | $1,250 | $1.63 | 21d | 1 | 0.51mi |
| 2218 Magnolia Cir Tallahassee, FL | 1.0–2.0 | 1.0–2.0 | 700 | $1,200 | $1.71 | 21d | 7 | 0.75mi |
| 2205 Magnolia Cir Tallahassee, FL | 1.0–2.0 | 1.0–2.0 | 750 | $1,225 | $1.63 | 13d | 9 | 0.75mi |
| 2205 Magnolia Cir Tallahassee, FL | 1.0–2.0 | 1.0–2.0 | 750 | $1,225 | $1.63 | 21d | 1 | 0.75mi |
| 3000 S Adams St Tallahassee, FL | 1.0–3.0 | 1.0–3.0 | 884 | $1,850 | $2.09 | 21d | 8 | 0.81mi |
| 301 Gaile Ave Tallahassee, FL | 3.0 | 1.0 | 1009 | $1,400 | $1.39 | 13d | 1 | 0.95mi |
| 509 Famcee Ave Tallahassee, FL | 3.0 | 2.0 | 1079 | $1,700 | $1.58 | 21d | 1 | 1.19mi |
| 1737 S M L King Jr Blvd Tallahassee, FL | 3.0 | 1.0 | 701 | $1,450 | $2.07 | 21d | 1 | 1.22mi |
| 1412 Ramble Brk Unit C Tallahassee, FL | 2.0 | 1.0 | 950 | $1,050 | $1.11 | 21d | 1 | 1.28mi |
| 1411 Lazy Brk Unit D Tallahassee, FL | 2.0 | 1.0 | 950 | $1,150 | $1.21 | 21d | 1 | 1.29mi |
| 1504 S Adams St #1 Tallahassee, FL | 2.0 | 2.0 | 1088 | $1,300 | $1.19 | 13d | 1 | 1.37mi |
| 1533 S Bronough St Tallahassee, FL | 2.0 | 1.0 | 750 | $1,150 | $1.53 | 13d | 1 | 1.38mi |
| 635 Palm Beach St Apt 125 Tallahassee, FL | 2.0 | 2.0 | 900 | $900 | $1.00 | 21d | 1 | 1.47mi |
Listing history 21 events
-
2026-06-18days on market $139,000 Active 86 DOM
-
2026-06-17days on market $139,000 Active 85 DOM
-
2026-06-16days on market $139,000 Active 84 DOM
-
2026-06-15days on market $139,000 Active 83 DOM
-
2026-06-14days on market $139,000 Active 81 DOM
-
2026-06-10days on market $139,000 Active 78 DOM
-
2026-06-09days on market $139,000 Active 77 DOM
-
2026-06-08days on market $139,000 Active 76 DOM
-
2026-06-07days on market $139,000 Active 75 DOM
-
2026-06-05days on market $139,000 Active 72 DOM
-
2026-06-03days on market $139,000 Active 71 DOM
-
2026-06-02days on market $139,000 Active 70 DOM
-
2026-06-01days on market $139,000 Active 69 DOM
-
2026-05-31days on market $139,000 Active 68 DOM
-
2026-05-30days on market $139,000 Active 67 DOM
-
2026-03-24$139,000 Active
-
2025-12-04historical Active Under Contract
-
2025-11-25historical
-
2025-10-20$135,000 Active
-
1996-11-08soldstatus $35,000
-
1994-12-01soldstatus $35,000
ⓘ Source: listings_history table (triggers on properties + properties_extension) + one-shot
backfill from property_details.listing_events for pre-trigger history.
Tax reassessment forecast FL · Resets to sale price
- Current annual tax
- $1,729 · $144/mo
- Projected year-2 tax
- $1,729 · $144/mo
- Expected delta
- $0/yr ($0/mo · 0.0%)
ⓘ Screening estimate from a state-policy table — verify with the county assessor before closing.
Climate risk First Street
- Flood 1/10 Low FEMA zone AE · 0% chance over 30 yrs
- Wildfire 4/10 Moderate
- Heat 8/10 Severe 7 d/yr ≥108°F today · 20 d/yr by 30 yrs out
- Wind 9/10 Extreme 99% chance of damaging wind over 30 yrs
- Air quality 4/10 Moderate 5 unhealthy d/yr today · 6 by 30 yrs out
Nearby sold comps map
Loading sold comps map…
Walkable amenities ~0.75 mi
Loading nearby amenities…
Taxation est. · year 1
- Rental income
- $17,856
- − Mortgage interest
- −$7,786
- − Property taxes
- −$1,729
- − Insurance
- −$5,814
- − Repairs & maintenance
- −$1,428
- − Management
- −$1,428
- − Depreciation
- −$4,044
- Taxable loss
- −$4,374
- Est. tax savings @ 24.0%
- +$1,050
- After-tax cash flow
- $-1,134/yr
For passive investors: Depreciation is non-cash, so a rental often shows a tax loss while cash-flowing — sheltering income. Rental losses are passive: they offset passive income freely, and up to $25,000/yr can offset ordinary (W-2) income if you actively participate and your MAGI is under $100k (phasing out to $0 by $150k); unused losses carry forward. On sale, claimed depreciation is recaptured at up to 25%, and gains may owe capital-gains tax (a 1031 exchange can defer both). Figures are a year-1 estimate at your 24.0% rate — not tax advice; consult a CPA.
Schools (NCES district)
- District
- Leon
- NCES district ID
- 1201110
- Math proficiency
- 48% ▼ -13.00%
- Reading proficiency
- 53% ▼ -5.00%
- Median HH income
- $46,339
- Composite
- 42.84/100
- National rank
- #3131
- State rank
- #33 of 73 in FL
Livability — Tallahassee
- Score
- 86/100
- State rank
- #19
- US rank
- #429
Category grades
Schools grade is shown separately in the Schools card above.
Census & demographics
- Census place
- Tallahassee, FL
- County
- Leon County · 294,472 people
- City population
- 294,472
- Metro
- Tallahassee, FL
- Population (ZIP)
- 32,017
- Household income
- $50,942
- Rent vs Own
- Severe rent burden
- 2625.0
Population outlook (Leon County) Hauer SSP2
- Today (2025)
- 315,507 people
- By 2030
- 330,677 · +4.8%
- By 2040
- 358,465 · +13.6%
- By 2050
- 386,804 · +22.6%
- By 2075
- 465,480 · +47.5%
- By 2100
- 519,959 · +64.8%
Race, ethnicity, and origin ACS 2023
- Neighborhood character
- Diverse neighborhood (Simpson 0.61)
- Race & ethnicity
- Black 49% White 38% Hispanic / Latino 6% Two or more races 6% Asian 3%
- Hispanic origin (detail)
- Puerto Rican 1% Cuban 1%
- Common ancestry
- Slovak 2% Romanian 1% Lithuanian 1%
- Foreign-born
- 7% · Canada, China, Vietnam
- Languages at home
- 91% English-only · Spanish 4% Other Indo-European 1% French/Haitian/Cajun 1%
Political lean MEDSL · Leon
- 2024 margin
- Strong D (+21.8) · D 60.3% · R 38.5% · Other 1.2%
- 2008→2024 swing
- -2.5pp toward R · 2008: 24.3pp · 2024: 21.8pp
- All cycles
- 2024: D+21.8 2020: D+28.3 2016: D+25.1 2012: D+23.6 2008: D+24.3
Not yet ingested
- Civics
- —
Market trends
- HPI YoY
- ▼ -231.50%
- Current HPI
- 231.103
- Rent YoY
- ▲ 4.16%
- Metro
- Tallahassee, FL
- State GDP YoY
- ▲ 3.28%
- F500 in state
- 36
Industry mix (Fortune 500 HQ in FL)
| Industry | F500 HQs | Revenue |
|---|---|---|
| Industrial Technology | 2 | $29B |
|
||
| Insurance | 2 | $17B |
|
||
| Retail | 1 | $60B |
|
||
| Technology Distribution | 1 | $58B |
|
||
| Homebuilding | 1 | $35B |
|
||
| Technology Manufacturing | 1 | $35B |
|
||
Price history
+297.1% since first listed6 events — show timeline
- 2026-03-24 Listed $139,000 CATRS
- 2025-12-04 Contingent — CATRS
- 2025-11-25 Listing Removed — CATRS
- 2025-10-20 Listed $135,000 CATRS
- 1996-11-08 Sold (Public Records) $35,000 Public Records
- 1994-12-01 Sold (Public Records) $35,000 Public Records
Property tax history
+8.8%/yrLatest (2025): $1,729 · +11.2% YoY. Source: county tax records.
Cash-flow waterfall
monthlySold comps — $/sqft
last 12 mo · ≤1 miLoading sold comps…