2571 Palo Duro Blvd · North Fort Myers, FL
Flood risk 1/10 · Minimal
- FEMA flood zone
- X (unshaded)
- Chance of flooding over 30 yrs
- 0.0%
- Est. flood insurance / yr
- $507 – $1,088
Fire risk 8/10 · Major
- Est. fire insurance / yr
- $947 – $1,759
Heat risk 10/10 · Severe
- Hot days now (above 107°F)
- 7 days/yr
- Hot days in 30 yrs
- 29 days/yr
Wind risk 10/10 · Severe
- Chance of severe wind over 30 yrs
- 99.0%
Air-quality risk 2/10 · Minimal
- Unhealthy air days now
- 1 days/yr
- Unhealthy air days in 30 yrs
- 1 days/yr
Risk factors via First Street. Map © Google.
Why this score? — see what drove the D+ grade
The composite is a weighted blend of 9 inputs, each scored 0–100. Each bar is that input's sub-score; the figure is the points it added to the 100-point composite (weight × sub-score).
- ARV discount +13.9/15.0
- Cash flow +10.8/30.0
- 1% rule +4.4/10.0
- Schools +4.1/10.0
- Livability +3.7/5.0
- Rent growth +3.2/5.0
- DSCR +3.1/10.0
- Condition / age +2.5/5.0
- Appreciation +0.0/10.0
$375,000
🖨 Deal sheet 📄 Offer letter ✓ Due diligence
Listing remarks
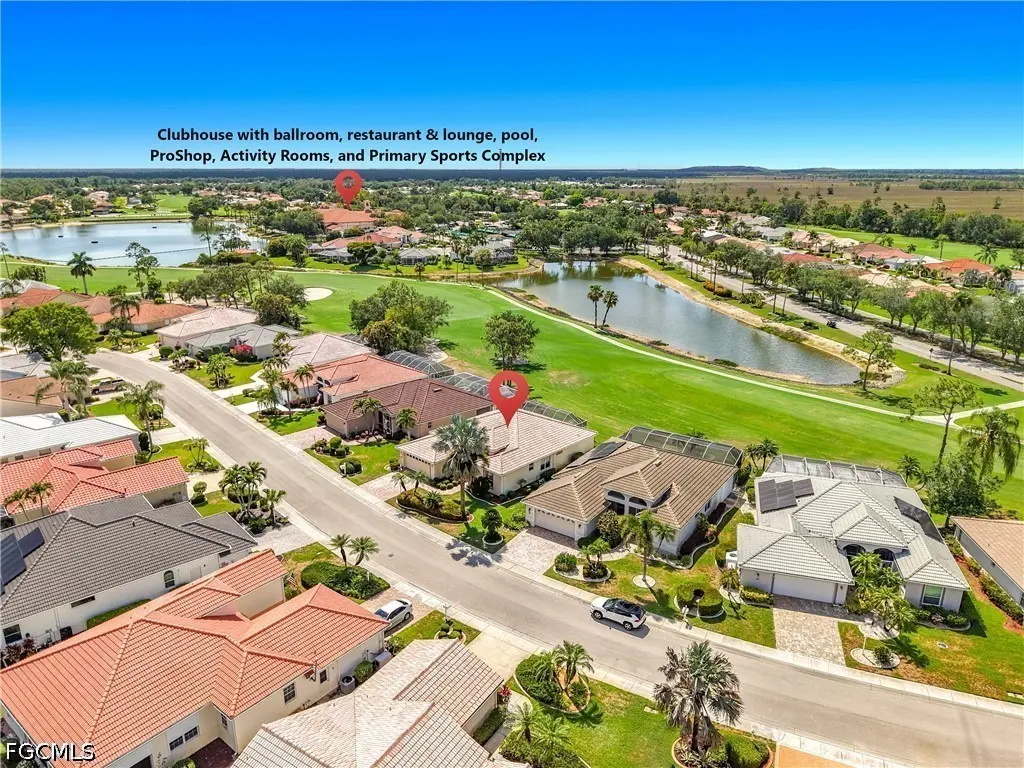
The Osprey is one of the most sought-after floor plans in HERONS GLEN COUNTRY CLUB, and this one offers something you don't often see: three bedrooms plus an office/den, set against a backdrop of GOLF COUSE, LAKE, AND CLUBHOUSE VIEWS that make the location as special as the home itself. From the pavered driveway and walkway to the double etched glass front doors, the entrance sets a refined tone. A single tile runs throughout the entire home, including an enclosed FLORIDA ROOM. The great room's quadruple sliding door pockets behind the wall and opens to the Florida Room, whose sliding doors then open fully to the caged lanai, creating a connected flow that brings the outdoors in. A covered
Key facts
- Lake views
- Pavered driveway
- Clubhouse views
Tags
Property features AI
Finance
- Financial info: Pets allowed conditionally (call for details); maximum 3 pets
- HOA & community: Homeowners association with quarterly fee; HOA covers association management, cable TV, internet, irrigation water, legal/accounting, grounds maintenance, recreation facilities, reserve fund, road maintenance, street lights, and security; Community amenities include clubhouse, fitness center, golf course, pool, spa/hot tub, tennis courts, pickleball, bocce, shuffleboard, putting greens, restaurant, billiards/hobby room, library, barbecue/picnic areas, sidewalks, trails and on-site management
Exterior
- Parking: Attached 2-car garage with garage door opener; Paved driveway; Covered parking for 2 vehicles
- Security: Gated community with security gate and guard; Smoke detectors
- Utilities: Public water (assessment paid); Public sewer (assessment paid); Cable available; High-speed internet available; Underground utilities
- Home design: Single-story property; Entry level: 1; Resale property; Has a view; Zoned RPD
- Construction: Block, concrete and stucco construction; Tile roof; Built on a foundation (standard for block/concrete)
- Exterior features: Lanai and screened porch; Porch; Sprinkler/irrigation system (automatic); Gas grill; Community pool; Private paved road frontage; Rectangular lot; Northwest exposure; Southeast-facing entry
Interior
- Kitchen: Refrigerator; Range; Self-cleaning oven; Microwave; Dishwasher; Garbage disposal; Icemaker; Pantry
- Bedrooms: Primary bedroom on the main level; Additional bedroom(s) on the main level
- Flooring: Tile floors
- Bathrooms: 2 full bathrooms; Separate shower; Bathtub
- Heating & cooling: Central heating (electric); Central air conditioning (electric); Ceiling fans
- Interior features: Attic with pull-down stairs; Built-in features; Main-level primary bedroom; Bedroom on main level; Family/dining room; Living/dining room; High ceilings; Pantry; Separate shower and bathtub; Walk-in closets; Window treatments; Cable TV; High-speed internet; Furnished
- Laundry & utility: Washer and dryer included; Laundry tub; Laundry inside the home
Neighborhood map
What this means for you Summary
Snapshot
- This is a 3-bed/2.0-bath single-family listed at $375k.
Deal economics
- At list price, monthly cash flow is $-174 ($-2k/yr) — negative.
- To cash-flow at today's rent, offer at most $344k (8.2% below list).
- To meet the 1% rule (rent ≥ 1% of price), the offer needs to be $354k (5.6% below list).
- Recommended offer: $344k (8.2% below list) — sets the bar for cash-flow.
- Cap rate 5.7% vs local median 3.6% in North Fort Myers — top-decile yield for the area; either an underpriced asset or a hidden risk that comps aren't pricing in. Stress-test before assuming the spread holds.
Location & tenants
- Location reads 74/100 on livability (#269 in FL, #4,409 nationally) — a middle-class / working-renter tenant base. Strengths: cost of living A+, housing A+, health & safety A+; Watch: employment C-, amenities F, commute F.
- Lee (suburban): math 47% / reading 50% proficiency, ranked #42 of 73 in FL (top 58%) — families likely to look elsewhere, expect single-tenant / working-renter base with shorter leases.
- Market conditions: Rents rising (+2.6%/yr); 841 active listings in the ZIP; 18 comparable units currently listed for rent nearby; rentals at typical pace (median 24d on market — plan ~3-4 weeks tenant-placement turnaround); 15,411 units permitted in Lee County in 2024 (4,686 in 5+ unit buildings).
- At $3,540/mo this rent would consume 77% of the median local household income ($55k/yr) (locally 775% of renters already pay >50% of income on rent) — very limited rent-growth headroom before tenants either downsize or default.
Forward outlook
- Local home prices are declining (-3.0%/yr); year-one equity from $3k of loan paydown is wiped out by about $11k of value loss. Plan a longer hold.
- Lee County population projected at +44% by 2050 — long-run rental-demand tailwind backs the buy-and-hold thesis.
Negotiation context
- Only 3 days on market — expect competitive offers; lowballing is unlikely to land.
- Current owner paid $200k; list at $375k implies a 88% gain — meaningful room to come down on a strong offer.
Risks & watch-outs
- Climate carrying-cost: severe wind risk, 99% chance of damaging wind over 30y; severe wildfire risk; extreme-heat days projected 7→29/yr by 2055 (HVAC capex compounding) — expect insurance premiums to compound above CPI over the hold.
Questions for the listing agent
- What do current leases actually rent for vs. the listed asking? Can we see a recent rent roll and the last 12 months of T-12 income?
- What does the HOA fee cover, when was the last increase, and are there any pending special assessments or reserve-fund shortfalls?
- Is there a deadline driving the sale (1031 exchange, divorce, estate, relocation)? That informs how much negotiation room exists.
- The area grade is low — what's the realistic commute time and amenity access for the typical tenant pool here? Any planned neighborhood developments (good or bad) we should know about?
- What's the average days-on-market for RENTAL listings here right now (not sales)? A rising rental-DOM trend means longer vacancies and softer asking-rent achievability than the comps imply.
- What's the recent tenant-quality profile in this submarket — average credit score on applications, eviction rate, late-payment / NSF rate, and stable-employment percentage? A property-management company in the area should have these aggregated.
- How much new for-sale + rental construction is in the pipeline within 1–3 miles? Heavy new supply typically softens prices + rents 12–24 months out; constrained supply supports both.
Investment metrics
- 1% rule
- 0.94% ✗
- Cap rate
- 5.74%
- Cash-on-cash
- -1.99%
- DSCR
- 0.91
- GRM
- 8.8
CMA / ARV
- ARV (on-the-fly)
- $436,975
- Comps found
- 12
Show comp detail 12 sales within ~0.75 mi
| Address | Dist | Beds/Ba | Sqft | Sold | Price | $/sf | Match |
|---|---|---|---|---|---|---|---|
| 2640 Palo Duro Blvd | 0.07mi | 3/2.0 | 1,917 (-0%) | 6mo | $440,000 | $230 | 91 |
| 2411 Palo Duro Blvd | 0.19mi | 2/2.0 (-1) | 1,814 (-6%) | 0mo | $488,000 | $269 | 76 |
| 20736 Mystic Way | 0.34mi | 3/2.0 | 1,700 (-12%) | 3mo | $350,000 | $206 | 62 |
| 20596 Long Pond Rd | 0.49mi | 3/2.0 | 1,983 (+3%) | 13mo | $423,000 | $213 | 62 |
| 20605 Long Pond Rd | 0.47mi | 2/2.0 (-1) | 1,805 (-6%) | 6mo | $410,000 | $227 | 58 |
| 2521 Palo Duro Blvd | 0.06mi | 3/2.0 | 1,644 (-15%) | 20mo | $500,000 | $304 | 56 |
| 2401 Palo Duro Blvd | 0.20mi | 3/2.0 | 1,729 (-10%) | 22mo | $460,000 | $266 | 55 |
| 20716 Tisbury Ln | 0.46mi | 3/2.5 | 2,133 (+11%) | 4mo | $455,000 | $213 | 55 |
| 3200 Magnolia Landing Ln | 0.72mi | 3/2.0 | 1,997 (+4%) | 6mo | $550,000 | $275 | 55 |
| 2121 Palo Duro Blvd | 0.47mi | 3/2.0 | 2,179 (+13%) | 15mo | $425,000 | $195 | 44 |
| 3519 Barnstable Ct | 0.74mi | 3/2.5 | 2,144 (+11%) | 4mo | $455,000 | $212 | 41 |
| 20056 Sweetbay Dr | 0.73mi | 3/2.0 | 1,672 (-13%) | 4mo | $278,500 | $167 | 41 |
Match score weights: distance 35% · size 25% · config 20% · recency 20%. Top-matched comps best support the ARV.
Projected returns pro-forma
-3.0% appreciation · 2.63% rent growth · sell at horizon
- IRR
- -20.0%
- Equity multiple
- 0.31×
- Total profit
- $-72,862
- Equity at exit
- $55,914
- IRR
- -13.6%
- Equity multiple
- 0.22×
- Total profit
- $-81,886
- Equity at exit
- $32,423
Cash invested: $105,000 (down + closing). Projections, not guarantees.
Landlord ↔ Tenant lean methodology
- Overall (STATE)
- 87 Strongly Landlord-Friendly
- State Florida
- 87 Strongly Landlord-Friendly · R+3
- County
- — inherits STATE
- City
- — inherits STATE
ZIP-level market 33917
- Home prices YoY
- -30.2%
- Rents YoY
- 2.6%
- Active inventory
- 841
- Price-to-rent
- 8.8×
Monthly cashflow live
- Estimated rent
- $3,540 high interval (Pro) →
- Mortgage (P&I)
- −$1,967
- Tax from tax record
- −$605 /mo · $7,263/yr
- Insurance
- −$156
- HOA
- −$242
- Vacancy / Maint / Mgmt
- −$743
- Net cashflow
- $-174
Break-even live
UW: 25.0% down · 7.5% · 30yr · 1.5% tax · 5.0% vac · 8.0% maint · 8.0% mgmt
Financing live
Cash to close
- Down payment
- $93,750
- Closing costs
- $11,250
- Reserves months
- —
- Total cash needed
- —
Loan-product check · same deal, 3 products live
Conventional
25% down · 7.5% · 30yr
- Down + closing
- —
- Monthly P&I
- —
- Monthly cashflow
- —
- DSCR
- —
- Eligible?
- —
Personal DTI + credit; lowest rate.
DSCR
20% down · 8.5% · 30yr
- Down + closing
- —
- Monthly P&I
- —
- Monthly cashflow
- —
- DSCR
- —
- Eligible?
- —
No personal income docs; deal must DSCR.
Hard money
10% down · 12.0% · 12mo
- Down + closing
- —
- Monthly P&I
- —
- Monthly cashflow
- —
- DSCR
- —
- Eligible?
- —
Short-term bridge; refi at stabilization.
Rent comps 18 comps
| Address | Beds | Baths | Sqft | Rent | $/sqft | DOM | Units | Dist |
|---|---|---|---|---|---|---|---|---|
| 2481 Palo Duro Blvd North Fort Myers, FL | 3.0 | 2.0 | 1450 | $4,000 | $2.76 | 21d | 1 | 0.10mi |
| 2481 Palo Duro Blvd North Fort Myers, FL | 3.0 | 2.0 | 1450 | $4,000 | $2.76 | 16d | 1 | 0.10mi |
| 2431 Palo Duro Blvd North Fort Myers, FL | 2.0 | 2.0 | 2456 | $2,900 | $1.18 | 24d | 1 | 0.15mi |
| 2300 Valparaiso Blvd North Fort Myers, FL | 2.0 | 2.0 | 1237 | $4,000 | $3.23 | 24d | 1 | 0.41mi |
| 2300 Valparaiso Blvd North Fort Myers, FL | 2.0 | 2.0 | 1237 | $3,000 | $2.43 | 16d | 1 | 0.41mi |
| 2130 Rio Nuevo Dr Unit 1546442P North Fort Myers, FL | 2.0 | 2.0 | 1248 | $4,682 | $3.75 | 14d | 1 | 0.46mi |
| 20728 Tisbury Ln North Fort Myers, FL | 3.0 | 2.5 | 2133 | $5,000 | $2.34 | 14d | 1 | 0.46mi |
| 20559 Long Pond Rd North Fort Myers, FL | 3.0 | 2.0 | 1805 | $2,295 | $1.27 | 24d | 1 | 0.56mi |
| 20056 Sweetbay Dr North Fort Myers, FL | 3.0 | 2.0 | 1672 | $4,000 | $2.39 | 24d | 1 | 0.70mi |
| 1900 Corona del Sire Dr North Fort Myers, FL | 2.0 | 2.0 | 1449 | $2,400 | $1.66 | 24d | 1 | 0.73mi |
| 20038 Fiddlewood Ave North Fort Myers, FL | 3.0 | 2.0 | 1519 | $1,999 | $1.32 | 19d | 1 | 0.83mi |
| 20919 Villareal Way North Fort Myers, FL | 2.0 | 2.0 | 1428 | $4,000 | $2.80 | 24d | 1 | 0.83mi |
| 20333 Camino Torcido Loop North Fort Myers, FL | 4.0 | 2.0 | 1828 | $3,800 | $2.08 | 24d | 1 | 0.88mi |
| 1670 Palo Duro Blvd North Fort Myers, FL | 2.0 | 2.0 | 1604 | $2,700 | $1.68 | 3d | 1 | 0.90mi |
| 20461 Camino Torcido Loop North Fort Myers, FL | 4.0 | 2.0 | 1828 | $2,250 | $1.23 | 24d | 1 | 1.02mi |
| 20719 Kaidon Ln North Fort Myers, FL | 2.0 | 2.0 | 1538 | $4,000 | $2.60 | 24d | 1 | 1.08mi |
| 20961 Skyler Dr North Fort Myers, FL | 3.0 | 3.0 | 2133 | $6,000 | $2.81 | 24d | 1 | 1.08mi |
| 10401 Circle Pine Rd North Fort Myers, FL | 2.0 | 2.0 | 1294 | $3,000 | $2.32 | 24d | 1 | 1.46mi |
HOA detail
- Monthly dues
- $242 · $2,904/yr
Listing history 3 events
-
2026-06-02status $375,000 Pending 3 DOM
-
2026-06-01days on market $375,000 Active 3 DOM
-
2026-05-31days on market $375,000 Active 2 DOM
ⓘ Source: listings_history table (triggers on properties + properties_extension) + one-shot
backfill from property_details.listing_events for pre-trigger history.
Tax reassessment forecast FL · Resets to sale price
- Current annual tax
- $7,263 · $605/mo
- Projected year-2 tax
- $7,263 · $605/mo
- Expected delta
- $0/yr ($0/mo · 0.0%)
ⓘ Screening estimate from a state-policy table — verify with the county assessor before closing.
Climate risk First Street
- Flood 1/10 Low FEMA zone X (unshaded) · 0% chance over 30 yrs
- Wildfire 8/10 Severe
- Heat 10/10 Extreme 7 d/yr ≥107°F today · 29 d/yr by 30 yrs out
- Wind 10/10 Extreme 99% chance of damaging wind over 30 yrs
- Air quality 2/10 Low 1 unhealthy d/yr today · 1 by 30 yrs out
Nearby sold comps map
Loading sold comps map…
Walkable amenities ~0.75 mi
Loading nearby amenities…
Taxation est. · year 1
- Rental income
- $42,474
- − Mortgage interest
- −$21,006
- − Property taxes
- −$7,263
- − Insurance
- −$1,875
- − Repairs & maintenance
- −$3,398
- − Management
- −$3,398
- − HOA
- −$2,904
- − Depreciation
- −$10,909
- Taxable loss
- −$8,278
- Est. tax savings @ 24.0%
- +$1,987
- After-tax cash flow
- $-99/yr
For passive investors: Depreciation is non-cash, so a rental often shows a tax loss while cash-flowing — sheltering income. Rental losses are passive: they offset passive income freely, and up to $25,000/yr can offset ordinary (W-2) income if you actively participate and your MAGI is under $100k (phasing out to $0 by $150k); unused losses carry forward. On sale, claimed depreciation is recaptured at up to 25%, and gains may owe capital-gains tax (a 1031 exchange can defer both). Figures are a year-1 estimate at your 24.0% rate — not tax advice; consult a CPA.
Schools (NCES district)
- District
- Lee
- NCES district ID
- 1201080
- Math proficiency
- 47% ▼ -11.00%
- Reading proficiency
- 50% ▼ -4.00%
- Median HH income
- $49,518
- Composite
- 41.49/100
- National rank
- #3458
- State rank
- #42 of 73 in FL
Livability — North Fort Myers
- Score
- 74/100
- State rank
- #269
- US rank
- #4409
Category grades
Schools grade is shown separately in the Schools card above.
Census & demographics
- Census place
- North Fort Myers, FL
- County
- Lee County · 788,662 people
- City population
- 57,035
- Metro
- Cape Coral-Fort Myers, FL
- Population (ZIP)
- 33,380
- Household income
- $55,000
- Rent vs Own
- Severe rent burden
- 775.0
Population outlook (Lee County) Hauer SSP2
- Today (2025)
- 871,946 people
- By 2030
- 955,468 · +9.6%
- By 2040
- 1,113,587 · +27.7%
- By 2050
- 1,256,891 · +44.1%
- By 2075
- 1,560,270 · +78.9%
- By 2100
- 1,726,848 · +98.0%
Race, ethnicity, and origin ACS 2023
- Neighborhood character
- Predominantly White (85%)
- Race & ethnicity
- White 85% Hispanic / Latino 10% Two or more races 7% Asian 1% Black 1%
- Hispanic origin (detail)
- Mexican 2% Puerto Rican 1% Cuban 3%
- Common ancestry
- Lithuanian 3% Romanian 3% Slovak 2%
- Foreign-born
- 10% · Canada
- Languages at home
- 88% English-only · Spanish 9% Other Indo-European 1% Russian/Polish/Slavic 1%
Political lean MEDSL · Lee
- 2024 margin
- Strong R (+28.4) · D 35.5% · R 63.9%
- 2008→2024 swing
- -18.0pp toward R · 2008: -10.4pp · 2024: -28.4pp
- All cycles
- 2024: R+28.4 2020: R+19.2 2016: R+20.4 2012: R+16.6 2008: R+10.4
Not yet ingested
- Civics
- —
Market trends
- HPI YoY
- ▼ -122.28%
- Current HPI
- 282.2895
- Rent YoY
- ▲ 2.63%
- Metro
- Cape Coral-Fort Myers, FL
- State GDP YoY
- ▲ 3.28%
- F500 in state
- 36
Industry mix (Fortune 500 HQ in FL)
| Industry | F500 HQs | Revenue |
|---|---|---|
| Industrial Technology | 2 | $29B |
|
||
| Insurance | 2 | $17B |
|
||
| Retail | 1 | $60B |
|
||
| Technology Distribution | 1 | $58B |
|
||
| Homebuilding | 1 | $35B |
|
||
| Technology Manufacturing | 1 | $35B |
|
||
Price history
+87.5% since first listed2 events — show timeline
- 2026-05-29 Listed $375,000 FORTMLS
- 2000-08-30 Sold (Public Records) $200,000 Public Records
Property tax history
+6.6%/yrLatest (2025): $7,263 · -1.1% YoY. Source: county tax records.
Cash-flow waterfall
monthlySold comps — $/sqft
last 12 mo · ≤1 miLoading sold comps…