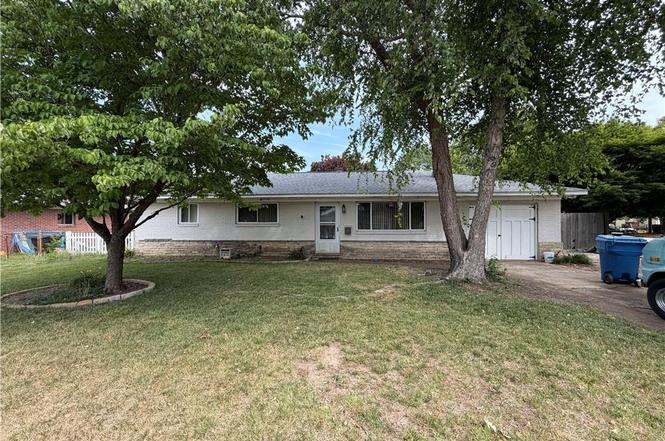
4716 Nuttfield Lane Ln · Virginia Beach, VA
Flood risk 1/10 · Minimal
- FEMA flood zone
- X (unshaded)
- Chance of flooding over 30 yrs
- 0.0%
- Est. flood insurance / yr
- $507 – $1,088
Fire risk 1/10 · Minimal
- Est. fire insurance / yr
- $666 – $1,236
Heat risk 9/10 · Severe
- Hot days now (above 104°F)
- 7 days/yr
- Hot days in 30 yrs
- 17 days/yr
Wind risk 8/10 · Major
- Chance of severe wind over 30 yrs
- 94.0%
Air-quality risk 2/10 · Minimal
- Unhealthy air days now
- 1 days/yr
- Unhealthy air days in 30 yrs
- 2 days/yr
Risk factors via First Street. Map © Google.
Why this score? — see what drove the C grade
The composite is a weighted blend of 9 inputs, each scored 0–100. Each bar is that input's sub-score; the figure is the points it added to the 100-point composite (weight × sub-score).
- Cash flow +16.9/30.0
- ARV discount +15.0/15.0
- Schools +6.4/10.0
- DSCR +5.3/10.0
- 1% rule +4.2/10.0
- Livability +4.2/5.0
- Rent growth +4.0/5.0
- Condition / age +2.5/5.0
- Appreciation +0.0/10.0
$230,000
🖨 Deal sheet (PDF) 📄 Offer letter ✓ Due diligence
Listing remarks
As is where is.
Key facts
- 0.23 acre lot
- Parking
- Built 1959
Property features AI
Finance
- HOA & community: No HOA fees
Exterior
- Parking: 1 parking space
- Utilities: City/County water; City/County sewer; Electric water heater; Electric power
- Home design: Detached ranch; Single-story (1 living level); Slab foundation
- Construction: Asphalt shingle roof
- Exterior features: Full fence (enclosed); Brick siding
Interior
- Kitchen: Dishwasher; Disposal
- Bedrooms: Master bedroom; Additional bedroom; Bedroom and full bathroom on the first floor
- Flooring: Bamboo flooring; Carpet
- Bathrooms: 2 full bathrooms
- Heating & cooling: Forced hot air heating; Central air conditioning
- Interior features: Gas fireplace; One fireplace total; Fixer upper
- Laundry & utility: Washer hookup; Dryer hookup; Utility room; Workshop
Neighborhood map
What this means for you Summary
Snapshot
- This is a 3-bed/1.0-bath single-family listed at $230k.
Deal economics
- At list price, monthly cash flow is $153 ($2k/yr) — positive.
- The deal already cash-flows at list — no discount required.
- To meet the 1% rule (rent ≥ 1% of price), the offer needs to be $211k (8.4% below list).
- Recommended offer: $211k (8.4% below list) — sets the bar for 1% rule.
- Cap rate 7.1% vs local median 3.5% in Virginia Beach — top-decile yield for the area; either an underpriced asset or a hidden risk that comps aren't pricing in. Stress-test before assuming the spread holds.
Location & tenants
- Location reads 83/100 on livability (#38 in VA, #880 nationally) — a professional / high-income tenant draw. Strengths: amenities A+, employment A+, housing A+; Watch: cost of living C-, commute F.
- Va Beach City Public School District (urban): math 69% / reading 78% proficiency, ranked #10 of 131 in VA (top 8%) — strong family-tenant draw, lease renewals of 3-5y typical.
- Zoned schools: Luxford Elementary (math 52% / reading 57%, grade C, #650 of 1,108 statewide, top 62%, 508 students, 68% FRL); Bayside Middle (math 53% / reading 54%, grade C+, #209 of 342 statewide, top 62%, 700 students, 92% FRL); Bayside High (math 63% / reading 75%, grade B, #170 of 319 statewide, top 55%, 1,983 students, 65% FRL) — zoned schools average 75% FRL vs 28% district-wide (47 pts higher); higher-poverty schools than district average — tighter screening recommended.
- Zoned-school proficiency averages 59% at this address vs 74% district-wide (-14 pts) — the specific schools serving this property underperform the Va Beach City Public School District average; the district grade overstates school quality for this exact location.
- Market conditions: Rents rising fast (+5.9%/yr); 208 active listings in the ZIP; 23 comparable units currently listed for rent nearby; rentals at typical pace (median 20d on market — plan ~3-4 weeks tenant-placement turnaround); solid renter incomes; 666 units permitted in Virginia Beach city in 2024 (347 in 5+ unit buildings).
Forward outlook
- Local home prices are declining (-3.0%/yr); year-one equity from $2k of loan paydown is wiped out by about $7k of value loss. Plan a longer hold.
- Virginia Beach County population projected at +6% by 2050 — modest demand growth; plan on rents tracking national, not racing it.
Negotiation context
- Only 1 days on market — expect competitive offers; lowballing is unlikely to land.
- Current owner paid $55k; list at $230k implies a 321% gain — meaningful room to come down on a strong offer.
Risks & watch-outs
- Watch-outs: built in 1959 — expect roof / HVAC / electrical / plumbing capex.
- Climate carrying-cost: severe wind risk, 94% chance of damaging wind over 30y; extreme-heat days projected 7→17/yr by 2055 (HVAC capex compounding) — expect insurance premiums to compound above CPI over the hold.
Questions for the listing agent
- Built in 1959 — when were the roof, HVAC, electrical panel, plumbing, and water heater last replaced?
- Is there a deadline driving the sale (1031 exchange, divorce, estate, relocation)? That informs how much negotiation room exists.
- Schools are A-rated — typically a magnet for longer-tenancy family renters. What's the average tenant stay here, and is there a school-zone premium baked into asking?
- What's the average days-on-market for RENTAL listings here right now (not sales)? A rising rental-DOM trend means longer vacancies and softer asking-rent achievability than the comps imply.
- What's the recent tenant-quality profile in this submarket — average credit score on applications, eviction rate, late-payment / NSF rate, and stable-employment percentage? A property-management company in the area should have these aggregated.
- How much new for-sale + rental construction is in the pipeline within 1–3 miles? Heavy new supply typically softens prices + rents 12–24 months out; constrained supply supports both.
Investment metrics
- 1% rule
- 0.92% ✗
- Cap rate
- 7.09%
- Cash-on-cash
- 2.84%
- DSCR
- 1.13
- GRM
- 9.1
CMA / ARV
- ARV (on-the-fly)
- $342,144
- Comps found
- 12
Show comp detail 12 sales within ~0.75 mi
| Address | Dist | Beds/Ba | Sqft | Sold | Price | $/sf | Match |
|---|---|---|---|---|---|---|---|
| 4816 Lonewillow Ln | 0.23mi | 3/1.0 | 1,188 (0%) | 6mo | $350,000 | $295 | 84 |
| 4724 Lonewillow Ln | 0.10mi | 3/2.0 | 1,243 (+5%) | 2mo | $385,000 | $310 | 82 |
| 4701 Deerfield Ln | 0.27mi | 3/2.0 | 1,200 (+1%) | 3mo | $349,900 | $292 | 80 |
| 4840 Frostburg Ln | 0.32mi | 4/2.0 (+1) | 1,200 (+1%) | 4mo | $349,000 | $291 | 71 |
| 1005 Ferry Plantation Rd | 0.09mi | 3/2.0 | 1,300 (+9%) | 7mo | $375,000 | $288 | 71 |
| 4712 Sullivan Blvd | 0.34mi | 3/1.5 | 1,280 (+8%) | 2mo | $350,000 | $273 | 67 |
| 4808 N Witchduck Rd | 0.59mi | 3/1.0 | 1,118 (-6%) | 2mo | $320,000 | $286 | 61 |
| 1049 Ferry Plantation Rd | 0.24mi | 4/2.0 (+1) | 1,306 (+10%) | 3mo | $350,000 | $268 | 61 |
| 772 Meade Ln | 0.52mi | 3/2.0 | 1,250 (+5%) | 7mo | $364,000 | $291 | 57 |
| 793 Crepe Myrtle Ln | 0.56mi | 3/1.0 | 1,272 (+7%) | 7mo | $345,000 | $271 | 56 |
| 921 Aragona Blvd | 0.50mi | 3/1.0 | 1,050 (-12%) | 7mo | $300,000 | $286 | 51 |
| 5009 Whitman Ln | 0.69mi | 3/1.0 | 1,300 (+9%) | 1mo | $345,000 | $265 | 51 |
Match score weights: distance 35% · size 25% · config 20% · recency 20%. Top-matched comps best support the ARV.
Projected returns pro-forma
-3.0% appreciation · 5.93% rent growth · sell at horizon
- IRR
- -8.7%
- Equity multiple
- 0.67×
- Total profit
- $-21,178
- Equity at exit
- $34,294
- IRR
- 4.1%
- Equity multiple
- 1.34×
- Total profit
- $21,856
- Equity at exit
- $19,886
Cash invested: $64,400 (down + closing). Projections, not guarantees.
Landlord ↔ Tenant lean methodology
- Overall (STATE)
- 55 Moderately Landlord-Leaning
- State Virginia
- 55 Moderately Landlord-Leaning · D+2
- County
- — inherits STATE
- City
- — inherits STATE
ZIP-level market 23455
- Rents YoY
- 5.9%
- Active inventory
- 208
- Price-to-rent
- 9.1×
Monthly cashflow live
- Estimated rent
- $2,106 high interval (Pro) →
- Mortgage (P&I)
- −$1,206
- Tax from tax record
- −$209 /mo · $2,511/yr
- Insurance
- −$96
- HOA
- −$0
- Lot rent
- −$0
- Vacancy / Maint / Mgmt
- −$442
- Net cashflow
- $153
Break-even live
Sensitivity live
| Price | -10% $283 | -5% $218 | +0% $153 | +5% $87 | +10% $22 |
|---|---|---|---|---|---|
| Rent | -10% $-14 | -5% $69 | +0% $153 | +5% $236 | +10% $319 |
| Rate | -1.0pp $268 | -0.5pp $211 | base $153 | +0.5pp $93 | +1.0pp $32 |
UW: 25.0% down · 7.5% · 30yr · 1.5% tax · 5.0% vac · 8.0% maint · 8.0% mgmt
Financing live
Cash to close
- Down payment
- $57,500
- Closing costs
- $6,900
- Reserves months
- —
- Total cash needed
- —
Loan-product check · same deal, 3 products live
Conventional
25% down · 7.5% · 30yr
- Down + closing
- —
- Monthly P&I
- —
- Monthly cashflow
- —
- DSCR
- —
- Eligible?
- —
Personal DTI + credit; lowest rate.
DSCR
20% down · 8.5% · 30yr
- Down + closing
- —
- Monthly P&I
- —
- Monthly cashflow
- —
- DSCR
- —
- Eligible?
- —
No personal income docs; deal must DSCR.
Hard money
10% down · 12.0% · 12mo
- Down + closing
- —
- Monthly P&I
- —
- Monthly cashflow
- —
- DSCR
- —
- Eligible?
- —
Short-term bridge; refi at stabilization.
Rent comps 23 comps
| Address | Beds | Baths | Sqft | Rent | $/sqft | DOM | Units | Dist |
|---|---|---|---|---|---|---|---|---|
| 4608 Albert Ct Unit 201 Virginia Beach, VA | 2.0 | 1.0 | 875 | $1,250 | $1.43 | 26d | 1 | 0.14mi |
| 832 Blackfriars Ct Virginia Beach, VA | 2.0 | 1.0 | 945 | $1,275 | $1.35 | 26d | 1 | 0.21mi |
| 825 Crossing Ct Virginia Beach, VA | 1.0–3.0 | 1.0–2.0 | 937 | $2,499 | $2.67 | 26d | 1 | 0.33mi |
| 814 Gable Way Virginia Beach, VA | 3.0 | 2.5 | 1452 | $2,200 | $1.52 | 26d | 1 | 0.36mi |
| 4857 Westgrove Rd Virginia Beach, VA | 4.0 | 2.0 | 1378 | $2,450 | $1.78 | 5d | 1 | 0.42mi |
| 4524 Notre Dame Ct Virginia Beach, VA | 3.0 | 1.5 | 1470 | $2,300 | $1.56 | 0d | 1 | 0.44mi |
| 700 Moraine Ct Virginia Beach, VA | 2.0 | 1.0–2.0 | 763 | $1,775 | $2.33 | 0d | 8 | 0.51mi |
| 913 Ewell Rd Virginia Beach, VA | 3.0 | 2.5 | 1458 | $2,000 | $1.37 | 6d | 1 | 0.53mi |
| 4606 Merrimac Ln Virginia Beach, VA | 2.0 | 2.5 | 1240 | $2,150 | $1.73 | 26d | 1 | 0.59mi |
| 4932 Westgrove Rd Virginia Beach, VA | 4.0 | 2.5 | 1400 | $2,450 | $1.75 | 26d | 1 | 0.61mi |
| 4409 Articles Ln Virginia Beach, VA | 3.0 | 1.5 | 1332 | $2,650 | $1.99 | 4d | 1 | 1.02mi |
| 924 Southmoor Dr #204 Virginia Beach, VA | 2.0 | 2.0 | 1367 | $1,950 | $1.43 | 23d | 1 | 1.08mi |
| 5212 Nuthall Dr #103 Virginia Beach, VA | 2.0 | 2.0 | 1367 | $1,895 | $1.39 | 17d | 1 | 1.08mi |
| 920 Southmoor Dr #305 Virginia Beach, VA | 2.0 | 2.0 | 1367 | $1,900 | $1.39 | 19d | 1 | 1.09mi |
| 912 Southmoor Dr #204 Virginia Beach, VA | 2.0 | 2.0 | 1367 | $1,810 | $1.32 | 14d | 1 | 1.10mi |
| 5300 Warminster Dr #205 Virginia Beach, VA | 2.0 | 2.0 | 1366 | $1,750 | $1.28 | 4d | 1 | 1.12mi |
| 5300 Warminster Dr #205 Virginia Beach, VA | 2.0 | 2.0 | 1366 | $1,795 | $1.31 | 15d | 1 | 1.12mi |
| 4733 Adler Ave Virginia Beach, VA | 3.0 | 1.0 | 1150 | $1,995 | $1.73 | 23d | 1 | 1.18mi |
| 5317 Warminster Dr #303 Virginia Beach, VA | 2.0 | 2.0 | 1350 | $1,997 | $1.48 | 23d | 1 | 1.18mi |
| 5414 Catina Arch Virginia Beach, VA | 1.0–4.0 | 1.0–1.5 | 866 | $1,997 | $2.31 | 0d | 16 | 1.41mi |
| 5301 Justin Ct Virginia Beach, VA | 1.0–2.0 | 1.0 | 695 | $1,599 | $2.30 | 26d | 12 | 1.43mi |
| 5312 Justin Ct Unit 800-21-102E Virginia Beach, VA | 2.0 | 1.0 | 800 | $1,599 | $2.00 | 26d | 1 | 1.47mi |
| 4781 Cullen Rd Virginia Beach, VA | 3.0 | 2.5 | 1395 | $2,700 | $1.94 | 10d | 1 | 1.50mi |
Listing history 2 events
-
2026-06-13remarks 15-char remark
-
2026-06-13$230,000 Under Contract 1 DOM
ⓘ Source: listings_history table (triggers on properties + properties_extension) + one-shot
backfill from property_details.listing_events for pre-trigger history.
Tax reassessment forecast VA · Resets to sale price
- Current annual tax
- $2,511 · $209/mo
- Projected year-2 tax
- $2,511 · $209/mo
- Expected delta
- $0/yr ($0/mo · 0.0%)
ⓘ Screening estimate from a state-policy table — verify with the county assessor before closing.
Climate risk First Street
- Flood 1/10 Low FEMA zone X (unshaded) · 0% chance over 30 yrs
- Wildfire 1/10 Low
- Heat 9/10 Extreme 7 d/yr ≥104°F today · 17 d/yr by 30 yrs out
- Wind 8/10 Severe 94% chance of damaging wind over 30 yrs
- Air quality 2/10 Low 1 unhealthy d/yr today · 2 by 30 yrs out
Nearby sold comps map
Loading sold comps map…
Walkable amenities ~0.75 mi
Loading nearby amenities…
Taxation est. · year 1
- Rental income
- $25,273
- − Mortgage interest
- −$12,884
- − Property taxes
- −$2,511
- − Insurance
- −$1,150
- − Repairs & maintenance
- −$2,022
- − Management
- −$2,022
- − Depreciation
- −$6,691
- Taxable loss
- −$2,006
- Est. tax savings @ 24.0%
- +$481
- After-tax cash flow
- $2,312/yr
For passive investors: Depreciation is non-cash, so a rental often shows a tax loss while cash-flowing — sheltering income. Rental losses are passive: they offset passive income freely, and up to $25,000/yr can offset ordinary (W-2) income if you actively participate and your MAGI is under $100k (phasing out to $0 by $150k); unused losses carry forward. On sale, claimed depreciation is recaptured at up to 25%, and gains may owe capital-gains tax (a 1031 exchange can defer both). Figures are a year-1 estimate at your 24.0% rate — not tax advice; consult a CPA.
Schools (NCES district)
- District
- Va Beach City Public School District
- NCES district ID
- 5103840
- Math proficiency
- 69% ▼ -19.00%
- Reading proficiency
- 78% ▼ -7.00%
- Median HH income
- $66,452
- Composite
- 63.81/100
- National rank
- #594
- State rank
- #10 of 131 in VA
Livability — Virginia Beach
- Score
- 83/100
- State rank
- #38
- US rank
- #880
Category grades
Schools grade is shown separately in the Schools card above.
Census & demographics
- Census place
- Virginia Beach, VA
- County
- Virginia Beach City · 448,227 people
- City population
- 448,227
- Metro
- Virginia Beach-Norfolk-Newport News, VA-NC
- Population (ZIP)
- 49,977
- Household income
- $94,069
- Rent vs Own
- Severe rent burden
- 1820.0
Population outlook (Virginia Beach County) Hauer SSP2
- Today (2025)
- 480,401 people
- By 2030
- 491,221 · +2.3%
- By 2040
- 504,882 · +5.1%
- By 2050
- 508,847 · +5.9%
- By 2075
- 504,831 · +5.1%
- By 2100
- 465,867 · -3.0%
Race, ethnicity, and origin ACS 2023
- Neighborhood character
- Predominantly White (69%)
- Race & ethnicity
- White 69% Black 14% Two or more races 7% Hispanic / Latino 7% Asian 5%
- Hispanic origin (detail)
- Mexican 2% Puerto Rican 1%
- Common ancestry
- Romanian 3% Slovak 3% Lithuanian 2%
- Foreign-born
- 8% · Canada, China, Vietnam
- Languages at home
- 90% English-only · Spanish 3% Tagalog/Filipino 2% Other Indo-European 1%
Political lean MEDSL · Virginia Beach
- 2024 margin
- Toss-up / Even · D 50.7% · R 48.0% · Other 1.3%
- 2008→2024 swing
- +3.4pp toward D · 2008: -0.7pp · 2024: 2.6pp
- All cycles
- 2024: D+2.6 2020: D+5.4 2016: R+4.5 2012: R+2.5 2008: R+0.7
Not yet ingested
- Civics
- —
Market trends
- HPI YoY
- ▼ -347.34%
- Current HPI
- 296.3753
- Rent YoY
- ▲ 5.93%
- Metro
- Virginia Beach-Norfolk-Newport News, VA-NC
- State GDP YoY
- ▲ 2.40%
- F500 in state
- 50
Industry mix (Fortune 500 HQ in VA)
| Industry | F500 HQs | Revenue |
|---|---|---|
| Aerospace / Defense | 4 | $236B |
|
||
| Technology / Defense | 3 | $32B |
|
||
| Financial Services | 2 | $176B |
|
||
| Utilities | 2 | $27B |
|
||
| Insurance | 2 | $25B |
|
||
| Technology | 2 | $15B |
|
||
Price history
+320.8% since first listed3 events — show timeline
- 2026-06-11 Pending — REINMLS
- 2026-06-11 Listed $230,000 REINMLS
- 1991-01-07 Sold (Public Records) $54,657 Public Records
Property tax history
+3.7%/yrLatest (2025): $2,511 · +1.9% YoY. Source: county tax records.
Cash-flow waterfall
monthlySold comps — $/sqft
last 12 mo · ≤1 miLoading sold comps…