1289 Hillridge Dr · Macon-Bibb County, GA
Flood risk 1/10 · Minimal
- FEMA flood zone
- X (unshaded)
- Chance of flooding over 30 yrs
- 0.0%
- Est. flood insurance / yr
- $507 – $1,088
Fire risk 2/10 · Minimal
- Est. fire insurance / yr
- $963 – $1,789
Heat risk 7/10 · Major
- Hot days now (above 109°F)
- 7 days/yr
- Hot days in 30 yrs
- 18 days/yr
Wind risk 6/10 · Moderate
- Chance of severe wind over 30 yrs
- 66.0%
Air-quality risk 3/10 · Minor
- Unhealthy air days now
- 3 days/yr
- Unhealthy air days in 30 yrs
- 4 days/yr
Risk factors via First Street. Map © Google.
Why this score? — see what drove the C grade
The composite is a weighted blend of 9 inputs, each scored 0–100. Each bar is that input's sub-score; the figure is the points it added to the 100-point composite (weight × sub-score).
- Cash flow +25.7/30.0
- DSCR +8.5/10.0
- ARV discount +7.5/15.0
- 1% rule +5.5/10.0
- Rent growth +3.8/5.0
- Livability +2.5/5.0
- Condition / age +2.5/5.0
- Schools +1.2/10.0
- Appreciation +0.0/10.0
$96,500
🖨 Deal sheet (PDF) 📄 Offer letter ✓ Due diligence
Listing remarks
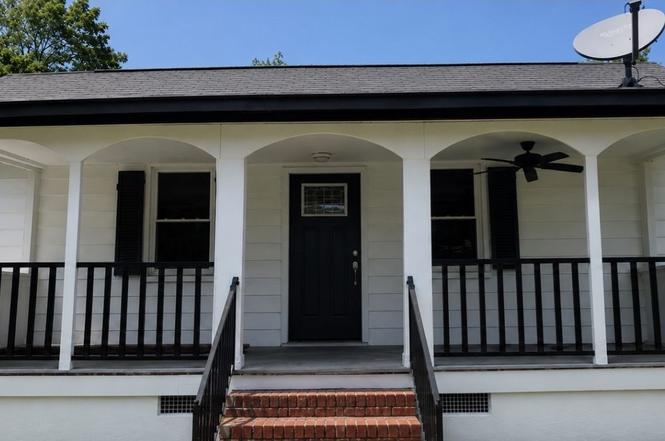
Welcome home to this beautifully updated 2-bedroom, 2-bath ranch situated on a spacious 0.37-acre lot in Macon. This move-in-ready home offers 1,032 square feet of comfortable living space featuring updated finishes, a functional floor plan, and abundant natural light throughout. Enjoy a separate dining area, dedicated laundry room, and generous outdoor space perfect for entertaining, gardening, or future expansion. A detached storage building provides additional flexibility for tools, hobbies, or extra storage. Conveniently located near shopping, dining, schools, and major roadways. The home is vacant and ready for its new owner. Some photos have been virtually staged to help showcase the
Key facts
- Updated finishes
- Separate dining area
- 0.37 acre lot
Tags
Property features AI
Finance
- Other: Lot approximately 0.37 acre; Address: 1289 Hillridge Drive, Macon, GA 31206; Subdivision: BEDINGFIELD
- HOA & community: No homeowners association
Exterior
- Parking: Garage parking (1 space)
- Utilities: Public water; Public sewer; 220 volt electric service; Sewer, electricity and water available
- Home design: Single family residence (house); Built in 1948; Updated/remodeled condition; Level lot
- Construction: Composition roof; Other construction materials; Foundation information not provided
- Exterior features: Patio; Back yard fencing; Shed(s) and outbuilding
Interior
- Kitchen: Kitchen island; Refrigerator included
- Bedrooms: 2 bedrooms on the main level
- Flooring: Laminate flooring
- Bathrooms: 2 full bathrooms on the main level
- Heating & cooling: Has heating (other); Ceiling fan(s) for cooling
- Interior features: Updated/remodeled interior; One-level home; Kitchen island; No common walls; Other interior features
- Laundry & utility: Laundry closet; Dryer included
Neighborhood map
What this means for you Summary
Snapshot
- This is a 2-bed/2.0-bath single-family listed at $96k.
Deal economics
- At list price, monthly cash flow is $230 ($3k/yr) — positive.
- The deal already cash-flows at list — no discount required.
- Meets the 1% rule at list price ($1k rent vs $96k).
- Cap rate 9.1% vs local median 5.4% in Macon-Bibb County — top-decile yield for the area; either an underpriced asset or a hidden risk that comps aren't pricing in. Stress-test before assuming the spread holds.
Location & tenants
- Location reads: area grade C — affects rentability + tenant quality, not the cash-flow math above.
- Bibb County (urban): math 11% / reading 18% proficiency, ranked #161 of 174 in GA (top 92%) — low school quality limits family demand, transient renter base, plan for 1-2y turnover; 75% free/reduced lunch — lower-income household profile, screen leases tightly.
- Zoned schools: Bruce Elementary School (math 2% / reading 2%, grade F, #1,204 of 1,228 statewide, top 100%, 434 students, 100% FRL); Rutland Middle School (math 12% / reading 28%, grade F, #349 of 470 statewide, top 75%, 812 students, 100% FRL); Rutland High School (math 2% / reading 8%, grade F, #394 of 424 statewide, top 97%, 907 students, 100% FRL) — zoned schools average 100% FRL vs 75% district-wide (25 pts higher); higher-poverty schools than district average — tighter screening recommended.
- Market conditions: Rents rising fast (+5.0%/yr); 209 active listings in the ZIP; 31 comparable units currently listed for rent nearby; rentals lingering (median 45d on market — plan ~5-8 weeks vacancy on turnover, expect pricing pressure); 65% of comp listings sitting > 30 days — soft ceiling on asking rent; lower-income renter base — watch delinquency; 154 units permitted in Bibb County in 2024 (0 in 5+ unit buildings).
- This rent runs 40% of the median local income ($30k/yr) — at the standard rent-burdened threshold; future hikes will face affordability resistance.
Forward outlook
- Local home prices are declining (-3.0%/yr); year-one equity from $667 of loan paydown is wiped out by about $3k of value loss. Plan a longer hold.
- Bibb County population projected at -12% by 2050 — secular population decline; favor cash flow + early exit over multi-decade hold.
- At projected returns (-3.0% appreciation + 5.0% rent growth), your $27k cash investment doubles in ~9 years — after that, you're playing with house money.
Negotiation context
- Only 5 days on market — expect competitive offers; lowballing is unlikely to land.
- Current owner paid $76k; 28% above their basis — modest negotiation headroom, anchor on the comps not their cost.
Risks & watch-outs
- Watch-outs: built in 1948 — expect roof / HVAC / electrical / plumbing capex.
- Climate carrying-cost: major wind risk, 66% chance of damaging wind over 30y; extreme-heat days projected 7→18/yr by 2055 (HVAC capex compounding) — expect insurance premiums to compound above CPI over the hold.
Questions for the listing agent
- Built in 1948 — when were the roof, HVAC, electrical panel, plumbing, and water heater last replaced?
- Is there a deadline driving the sale (1031 exchange, divorce, estate, relocation)? That informs how much negotiation room exists.
- What's the average days-on-market for RENTAL listings here right now (not sales)? A rising rental-DOM trend means longer vacancies and softer asking-rent achievability than the comps imply.
- What's the recent tenant-quality profile in this submarket — average credit score on applications, eviction rate, late-payment / NSF rate, and stable-employment percentage? A property-management company in the area should have these aggregated.
- How much new for-sale + rental construction is in the pipeline within 1–3 miles? Heavy new supply typically softens prices + rents 12–24 months out; constrained supply supports both.
Investment metrics
- 1% rule
- 1.05% ✓
- Cap rate
- 9.15%
- Cash-on-cash
- 10.20%
- DSCR
- 1.45
- GRM
- 7.9
CMA / ARV
- ARV (on-the-fly)
- $54,696
- Comps found
- 12
Show comp detail 12 sales within ~0.75 mi
| Address | Dist | Beds/Ba | Sqft | Sold | Price | $/sf | Match |
|---|---|---|---|---|---|---|---|
| 1322 Triple Hill Dr | 0.14mi | 2/1.0 | 1,117 (+8%) | 6mo | $27,500 | $25 | 70 |
| 1347 Schley St | 0.47mi | 3/1.0 (+1) | 1,063 (+3%) | 1mo | $45,500 | $43 | 63 |
| 1388 Lakeview Cir | 0.31mi | 2/1.0 | 1,140 (+10%) | 6mo | $35,000 | $31 | 59 |
| 1341 Glendale Ave | 0.32mi | 3/1.0 (+1) | 912 (-12%) | 2mo | $34,500 | $38 | 56 |
| 1071 Sylvian Dr | 0.55mi | 3/1.0 (+1) | 1,001 (-3%) | 9mo | $53,000 | $53 | 53 |
| 1317 Peavy Dr | 0.57mi | 2/1.0 | 936 (-9%) | 2mo | $52,000 | $56 | 52 |
| 4370 Mikado Ave | 0.64mi | 2/1.5 | 1,098 (+6%) | 7mo | $50,000 | $46 | 52 |
| 4283 Worsham Ave | 0.71mi | 3/2.0 (+1) | 1,000 (-3%) | 8mo | $29,000 | $29 | 50 |
| 3979 Spencer Cir | 0.52mi | 3/1.0 (+1) | 1,100 (+7%) | 10mo | $95,000 | $86 | 47 |
| 3366 Pio Nono Cir | 0.60mi | 3/1.0 (+1) | 962 (-7%) | 8mo | $106,000 | $110 | 46 |
| 3366 Pio Nono Cir | 0.60mi | 3/1.0 (+1) | 962 (-7%) | 8mo | $106,000 | $110 | 46 |
| 1151 N Beddingfield Dr | 0.70mi | 3/1.0 (+1) | 1,080 (+5%) | 9mo | $125,000 | $116 | 43 |
Match score weights: distance 35% · size 25% · config 20% · recency 20%. Top-matched comps best support the ARV.
Projected returns pro-forma
-3.0% appreciation · 5.03% rent growth · sell at horizon
- IRR
- 1.0%
- Equity multiple
- 1.04×
- Total profit
- $1,061
- Equity at exit
- $14,388
- IRR
- 12.4%
- Equity multiple
- 2.06×
- Total profit
- $28,608
- Equity at exit
- $8,344
Cash invested: $27,020 (down + closing). Projections, not guarantees.
Landlord ↔ Tenant lean methodology
- Overall (STATE)
- 90 Strongly Landlord-Friendly
- State Georgia
- 90 Strongly Landlord-Friendly · R+3
- County
- — inherits STATE
- City
- — inherits STATE
ZIP-level market 31206
- Rents YoY
- 5.0%
- Active inventory
- 209
- Price-to-rent
- 7.9×
Monthly cashflow live
- Estimated rent
- $1,012 high interval (Pro) →
- Mortgage (P&I)
- −$506
- Tax from tax record
- −$24 /mo · $283/yr
- Insurance
- −$40
- HOA
- −$0
- Vacancy / Maint / Mgmt
- −$213
- Net cashflow
- $230
Break-even live
Sensitivity live
| Price | -10% $284 | -5% $257 | +0% $230 | +5% $202 | +10% $175 |
|---|---|---|---|---|---|
| Rent | -10% $150 | -5% $190 | +0% $230 | +5% $270 | +10% $310 |
| Rate | -1.0pp $278 | -0.5pp $254 | base $230 | +0.5pp $205 | +1.0pp $179 |
UW: 25.0% down · 7.5% · 30yr · 1.5% tax · 5.0% vac · 8.0% maint · 8.0% mgmt
Financing live
Cash to close
- Down payment
- $24,125
- Closing costs
- $2,895
- Reserves months
- —
- Total cash needed
- —
Loan-product check · same deal, 3 products live
Conventional
25% down · 7.5% · 30yr
- Down + closing
- —
- Monthly P&I
- —
- Monthly cashflow
- —
- DSCR
- —
- Eligible?
- —
Personal DTI + credit; lowest rate.
DSCR
20% down · 8.5% · 30yr
- Down + closing
- —
- Monthly P&I
- —
- Monthly cashflow
- —
- DSCR
- —
- Eligible?
- —
No personal income docs; deal must DSCR.
Hard money
10% down · 12.0% · 12mo
- Down + closing
- —
- Monthly P&I
- —
- Monthly cashflow
- —
- DSCR
- —
- Eligible?
- —
Short-term bridge; refi at stabilization.
Rent comps 31 comps
| Address | Beds | Baths | Sqft | Rent | $/sqft | DOM | Units | Dist |
|---|---|---|---|---|---|---|---|---|
| 1289 Rocky Creek Rd Macon, GA | 2.0 | 1.0 | 1404 | $750 | $0.53 | 45d | 1 | 0.12mi |
| 1332 Hillridge Dr Macon, GA | 3.0 | 2.0 | 1050 | $1,050 | $1.00 | 15d | 1 | 0.12mi |
| 1156 Triple Hill Dr Macon, GA | 2.0 | 1.0 | 980 | $875 | $0.89 | 15d | 1 | 0.32mi |
| 4028 Saint Charles Pl Macon, GA | 3.0 | 1.0 | 900 | $800 | $0.89 | 22d | 1 | 0.45mi |
| 1260 Auburn Dr Macon, GA | 3.0 | 1.0 | 864 | $1,295 | $1.50 | 22d | 1 | 0.54mi |
| 1260 Auburn Dr Macon, GA | 3.0 | 1.0 | 864 | $1,075 | $1.24 | 45d | 1 | 0.54mi |
| 4196 Mikado Ave Unit A Macon, GA | 1.0 | 1.0 | 897 | $950 | $1.06 | 45d | 1 | 0.54mi |
| 4196 Mikado Ave Unit B Macon, GA | 1.0 | 1.0 | 890 | $900 | $1.01 | 45d | 1 | 0.54mi |
| 3823 Saint Charles Pl Macon, GA | 3.0 | 1.0 | 1020 | $1,150 | $1.13 | 45d | 1 | 0.59mi |
| 1148 N Beddingfield Dr Macon, GA | 3.0 | 1.0 | 1076 | $825 | $0.77 | 45d | 1 | 0.59mi |
| 4322 Mikado Ave Macon, GA | 3.0 | 2.0 | 1344 | $1,230 | $0.92 | 22d | 1 | 0.60mi |
| 906 Thomas St Macon, GA | 2.0 | 1.0 | 800 | $650 | $0.81 | 45d | 1 | 0.66mi |
| 955 Putnam St Unit 1 Macon, GA | 3.0 | 1.0 | 950 | $1,199 | $1.26 | 45d | 1 | 0.67mi |
| 3685 Rice Mill Rd Macon, GA | 3.0 | 1.0 | 1152 | $1,450 | $1.26 | 45d | 1 | 0.68mi |
| 3778 Spencer Cir Macon, GA | 3.0 | 1.0 | 864 | $1,300 | $1.50 | 22d | 1 | 0.69mi |
| 832 Richmond St Macon, GA | 3.0 | 1.0 | 1364 | $925 | $0.68 | 22d | 1 | 0.71mi |
| 846 Bedingfield Ave Macon, GA | 3.0 | 1.5 | 1187 | $975 | $0.82 | 45d | 1 | 0.73mi |
| 3837 Spencer Cir Macon, GA | 3.0 | 1.0 | 1080 | $1,300 | $1.20 | 45d | 1 | 0.77mi |
| 1164 Newberg Ave Macon, GA | 3.0 | 1.0 | 1100 | $1,195 | $1.09 | 45d | 1 | 0.89mi |
| 3238 Somerset Dr Macon, GA | 3.0 | 1.0 | 1100 | $975 | $0.89 | 15d | 1 | 0.97mi |
| 3709 Flamingo Dr Macon, GA | 3.0 | 1.0 | 1360 | $1,300 | $0.96 | 45d | 1 | 1.04mi |
| 3149 Somerset Dr Macon, GA | 2.0 | 1.0 | 897 | $745 | $0.83 | 45d | 1 | 1.10mi |
| 837 Newberg Ave Macon, GA | 3.0 | 1.0 | 966 | $750 | $0.78 | 45d | 1 | 1.10mi |
| 4011 Marion Ave Macon, GA | 2.0 | 1.0 | 1200 | $1,200 | $1.00 | 22d | 1 | 1.14mi |
| 524 Carmen Pl Macon, GA | 3.0 | 1.0 | 1175 | $1,050 | $0.89 | 45d | 1 | 1.16mi |
| 534 Lynmore Ave Macon, GA | 2.0 | 1.0 | 864 | $925 | $1.07 | 45d | 1 | 1.19mi |
| 3423 Flamingo Dr Macon, GA | 3.0 | 1.0 | 1048 | $895 | $0.85 | 45d | 1 | 1.19mi |
| 3080 Rice Mill Rd Unit M-5 Macon, GA | 1.0 | 1.0 | 875 | $750 | $0.86 | 45d | 1 | 1.21mi |
| 3080 Rice Mill Rd Macon, GA | 3.0 | 1.0 | 1100 | $950 | $0.86 | 45d | 1 | 1.21mi |
| 3080 Rice Mill Rd Unit C-1 Macon, GA | 3.0 | 1.5 | 1100 | $925 | $0.84 | 22d | 1 | 1.21mi |
| 1089 Brisbane St Macon, GA | 3.0 | 1.0 | 816 | $1,075 | $1.32 | 15d | 1 | 1.31mi |
Listing history 6 events
-
2026-06-21days on market $96,500 Active 5 DOM
-
2026-06-19days on market $96,500 Active 3 DOM
-
2026-06-18days on market $96,500 Active 2 DOM
-
2026-06-16status $96,500 Active 1 DOM
-
2026-06-16remarks 699-char remark
-
2026-06-16$96,500 New 1 DOM
ⓘ Source: listings_history table (triggers on properties + properties_extension) + one-shot
backfill from property_details.listing_events for pre-trigger history.
Tax reassessment forecast GA · Resets to sale price
- Current annual tax
- $283 · $24/mo
- Projected year-2 tax
- $888 · $74/mo
- Expected delta
- +$604/yr (+$50/mo · 213.3%)
ⓘ Screening estimate from a state-policy table — verify with the county assessor before closing.
Climate risk First Street
- Flood 1/10 Low FEMA zone X (unshaded) · 0% chance over 30 yrs
- Wildfire 2/10 Low
- Heat 7/10 Severe 7 d/yr ≥109°F today · 18 d/yr by 30 yrs out
- Wind 6/10 Major 66% chance of damaging wind over 30 yrs
- Air quality 3/10 Moderate 3 unhealthy d/yr today · 4 by 30 yrs out
Nearby sold comps map
Loading sold comps map…
Walkable amenities ~0.75 mi
Loading nearby amenities…
Taxation est. · year 1
- Rental income
- $12,146
- − Mortgage interest
- −$5,406
- − Property taxes
- −$283
- − Insurance
- −$482
- − Repairs & maintenance
- −$972
- − Management
- −$972
- − Depreciation
- −$2,807
- Taxable income
- $1,224
- Est. tax owed @ 24.0%
- −$294
- After-tax cash flow
- $2,463/yr
For passive investors: Depreciation is non-cash, so a rental often shows a tax loss while cash-flowing — sheltering income. Rental losses are passive: they offset passive income freely, and up to $25,000/yr can offset ordinary (W-2) income if you actively participate and your MAGI is under $100k (phasing out to $0 by $150k); unused losses carry forward. On sale, claimed depreciation is recaptured at up to 25%, and gains may owe capital-gains tax (a 1031 exchange can defer both). Figures are a year-1 estimate at your 24.0% rate — not tax advice; consult a CPA.
Schools (NCES district)
- District
- Bibb County
- NCES district ID
- 1300420
- Math proficiency
- 11% ▼ -14.00%
- Reading proficiency
- 18% ▼ -11.00%
- Median HH income
- $37,426
- Composite
- 12.13/100
- National rank
- #9654
- State rank
- #161 of 174 in GA
Livability — Macon-Bibb County
No livability data for this city. (Only ~50 U.S. cities are tracked.)
Census & demographics
- Census place
- Macon-Bibb County, GA
- County
- Bibb County · 164,332 people
- City population
- 143,186
- Metro
- Macon-Bibb County, GA
- Population (ZIP)
- 24,310
- Household income
- $30,042
- Rent vs Own
- Severe rent burden
- 1335.0
Population outlook (Bibb County) Hauer SSP2
- Today (2025)
- 148,772 people
- By 2030
- 145,904 · -1.9%
- By 2040
- 139,404 · -6.3%
- By 2050
- 131,603 · -11.5%
- By 2075
- 111,050 · -25.4%
- By 2100
- 83,346 · -44.0%
Race, ethnicity, and origin ACS 2023
- Neighborhood character
- Predominantly Black (76%)
- Race & ethnicity
- Black 76% White 12% Hispanic / Latino 8% Two or more races 4%
- Hispanic origin (detail)
- Mexican 5% Puerto Rican 1%
- Common ancestry
- Lithuanian 1% Italian 1%
- Foreign-born
- 4% · Canada
- Languages at home
- 91% English-only · Spanish 8%
Political lean MEDSL · Bibb
- 2024 margin
- Strong D (+22.4) · D 61.0% · R 38.5%
- 2008→2024 swing
- +4.4pp toward D · 2008: 18.0pp · 2024: 22.4pp
- All cycles
- 2024: D+22.4 2020: D+23.8 2016: D+20.2 2012: D+20.0 2008: D+18.0
Not yet ingested
- Civics
- —
Market trends
- HPI YoY
- ▼ -80.17%
- Current HPI
- 148.6765
- Rent YoY
- ▲ 5.03%
- Metro
- Macon-Bibb County, GA
- State GDP YoY
- ▲ 2.66%
- F500 in state
- 28
Industry mix (Fortune 500 HQ in GA)
| Industry | F500 HQs | Revenue |
|---|---|---|
| Paper / Packaging | 2 | $29B |
|
||
| Retail | 1 | $160B |
|
||
| Transportation / Logistics | 1 | $91B |
|
||
| Airlines | 1 | $62B |
|
||
| Consumer Goods | 1 | $47B |
|
||
| Utilities | 1 | $25B |
|
||
Price history
+160.8% since first listed7 events — show timeline
- 2026-06-15 Listed $96,500 GAMLS
- 2009-12-16 Sold (Public Records) $75,542 Public Records
- 2007-05-09 Sold (Public Records) $63,000 Public Records
- 2005-12-27 Sold (Public Records) $25,000 Public Records
- 2005-10-04 Sold (Public Records) $35,000 Public Records
- 2003-05-21 Sold (Public Records) $60,000 Public Records
- 2000-07-13 Sold (Public Records) $37,000 Public Records
Property tax history
+16.3%/yrLatest (2025): $283 · +5.1% YoY. Source: county tax records.
Cash-flow waterfall
monthlySold comps — $/sqft
last 12 mo · ≤1 miLoading sold comps…