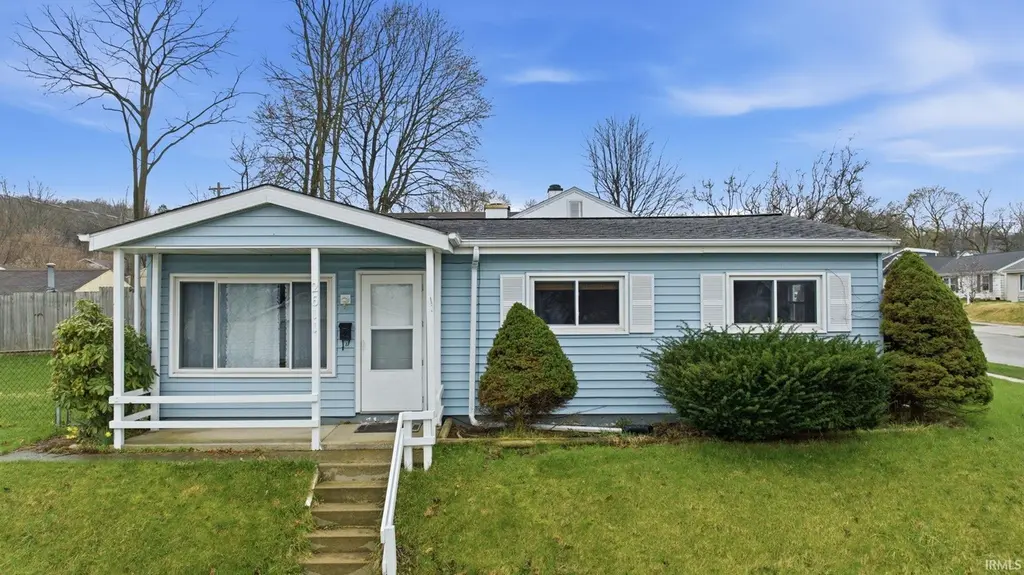
2611 Delaware St · Mishawaka, IN
Flood risk 1/10 · Minimal
- FEMA flood zone
- X (unshaded)
- Chance of flooding over 30 yrs
- 0.0%
- Est. flood insurance / yr
- $507 – $1,088
Fire risk 1/10 · Minimal
- Est. fire insurance / yr
- $717 – $1,331
Heat risk 3/10 · Minor
- Hot days now (above 99°F)
- 7 days/yr
- Hot days in 30 yrs
- 16 days/yr
Wind risk 2/10 · Minimal
- Chance of severe wind over 30 yrs
- —
Air-quality risk 3/10 · Minor
- Unhealthy air days now
- 2 days/yr
- Unhealthy air days in 30 yrs
- 3 days/yr
Risk factors via First Street. Map © Google.
Why this score? — see what drove the F grade
The composite is a weighted blend of 9 inputs, each scored 0–100. Each bar is that input's sub-score; the figure is the points it added to the 100-point composite (weight × sub-score).
- Cash flow +13.3/30.0
- Rent growth +4.8/5.0
- DSCR +4.0/10.0
- Livability +3.8/5.0
- 1% rule +2.9/10.0
- Condition / age +2.5/5.0
- Schools +2.2/10.0
- ARV discount +0.7/15.0
- Appreciation +0.0/10.0
$164,900
🖨 Deal sheet 📄 Offer letter ✓ Due diligence
Listing remarks MLS
Move in ready 3 Bedroom 1 bath home. New Vinyl plank flooring throughout the home in 2020. All appliances are included and the dishwasher was new in July 2021. Washer and Dryer are conviently located near the kitchen area. Home had a New Water Heater installed in March of 2023 and Central Air in May of 2021. Virtually maintenance free and move in ready. Over-sized garage with plenty of room for storage and a fenced in yard. Close to shopping and schools. Quick closing.
Key facts
- Corner urban lot
- Fresh interior paint
- New door
Tags
Property features AI
Finance
- Other: Property type: Residential - Single Family Residence
- Financial info: Financial details not provided
- HOA & community: Community sidewalks
Exterior
- Parking: Detached garage with 2 spaces; Garage door opener; Off-street parking
- Security: Smoke detector(s)
- Utilities: Public water; Public sewer
- Home design: Single-family residence, site-built; One-level (single story); Located on a corner at Delaware and Middleboro Ave; Subdivision: Lafayette Place
- Construction: Vinyl siding exterior; Shingle roof; Slab foundation; Built area above grade: 936
- Exterior features: Corner lot, landscaped; Chain link fencing; Paved public road access; Sidewalks in the community
Interior
- Kitchen: Refrigerator; Gas oven
- Bedrooms: Bedrooms not specified
- Flooring: Flooring not specified
- Bathrooms: 1 full bathroom (main level)
- Heating & cooling: Natural gas forced-air heating; Central air conditioning
- Interior features: Laminate counters; Window treatments; 6 total rooms
- Laundry & utility: Washer and dryer included; Laundry located on the main level; Gas water heater
Neighborhood map
What this means for you Summary
Snapshot
- This is a 3-bed/1.0-bath single-family listed at $165k.
Deal economics
- At list price, monthly cash flow is $-1 ($-16/yr) — negative.
- To cash-flow at today's rent, offer at most $165k (0.1% below list).
- To meet the 1% rule (rent ≥ 1% of price), the offer needs to be $130k (21.3% below list).
- Recommended offer: $130k (21.3% below list) — sets the bar for 1% rule.
Location & tenants
- Location reads 76/100 on livability (#53 in IN, #3,586 nationally) — a middle-class / working-renter tenant base. Strengths: cost of living A+, housing A+, health & safety B; Watch: amenities F, employment F.
- School City Of Mishawaka (urban): math 23% / reading 30% proficiency, ranked #260 of 301 in IN (top 86%) — low school quality limits family demand, transient renter base, plan for 1-2y turnover.
- Zoned schools: Lasalle Elementary School (math 17% / reading 12%, grade F, #862 of 994 statewide, top 88%, 543 students, 84% FRL); John J Young Middle School (math 17% / reading 30%, grade F, #257 of 330 statewide, top 79%, 735 students, 74% FRL); Mishawaka High School (math 24% / reading 60%, grade F, #197 of 369 statewide, top 57%, 1,488 students, 65% FRL) — zoned schools average 74% FRL vs 54% district-wide (20 pts higher); higher-poverty schools than district average — tighter screening recommended.
- Market conditions: Rents rising fast (+9.1%/yr); 140 active listings in the ZIP; 18 comparable units currently listed for rent nearby; rentals leasing fast (median 14d on market — plan ~1-2 weeks tenant-placement turnaround); 754 units permitted in St. Joseph County in 2024 (460 in 5+ unit buildings).
Forward outlook
- Local home prices are declining (-3.0%/yr); year-one equity from $1k of loan paydown is wiped out by about $5k of value loss. Plan a longer hold.
Negotiation context
- It's been on market 36 days — a 3% lower offer ($160k) is reasonable based on typical stale-listing flexibility.
- 7 sale attempts since 11y ago with the ask held roughly flat each time — persistent listings suggest the price (not the market) is what's stuck; bring a comps-based counter.
- Current owner paid $140k; 18% above their basis — modest negotiation headroom, anchor on the comps not their cost.
Questions for the listing agent
- What do current leases actually rent for vs. the listed asking? Can we see a recent rent roll and the last 12 months of T-12 income?
- It's been on market 36 days. Have you received any prior offers? Is the seller open to a 21% concession, seller financing, or rate buy-down credit?
- Built in 1960 — when were the roof, HVAC, electrical panel, plumbing, and water heater last replaced?
- Is there a deadline driving the sale (1031 exchange, divorce, estate, relocation)? That informs how much negotiation room exists.
- The area grade is low — what's the realistic commute time and amenity access for the typical tenant pool here? Any planned neighborhood developments (good or bad) we should know about?
- What's the average days-on-market for RENTAL listings here right now (not sales)? A rising rental-DOM trend means longer vacancies and softer asking-rent achievability than the comps imply.
- What's the recent tenant-quality profile in this submarket — average credit score on applications, eviction rate, late-payment / NSF rate, and stable-employment percentage? A property-management company in the area should have these aggregated.
- How much new for-sale + rental construction is in the pipeline within 1–3 miles? Heavy new supply typically softens prices + rents 12–24 months out; constrained supply supports both.
Investment metrics
- 1% rule
- 0.79% ✗
- Cap rate
- 6.28%
- Cash-on-cash
- -0.04%
- DSCR
- 1.00
- GRM
- 10.6
CMA / ARV
- ARV (on-the-fly)
- $143,208
- Comps found
- 12
Show comp detail 12 sales within ~0.75 mi
| Address | Dist | Beds/Ba | Sqft | Sold | Price | $/sf | Match |
|---|---|---|---|---|---|---|---|
| 2611 Delaware St | 0.00mi | 3/1.0 | 936 (0%) | 1mo | $164,000 | $175 | 99 |
| 2523 Milburn Blvd | 0.14mi | 3/1.0 | 925 (-1%) | 4mo | $155,000 | $168 | 88 |
| 2536 Milburn Blvd | 0.16mi | 2/1.0 (-1) | 900 (-4%) | 0mo | $130,000 | $144 | 80 |
| 1917 Panama St | 0.50mi | 3/1.0 | 936 (0%) | 2mo | $175,000 | $187 | 75 |
| 2423 Woodmont Dr | 0.39mi | 3/1.0 | 912 (-3%) | 7mo | $172,000 | $189 | 72 |
| 1325 S 29th St | 0.62mi | 3/1.0 | 936 (0%) | 3mo | $80,000 | $85 | 68 |
| 1934 E Bowman St | 0.19mi | 2/1.0 (-1) | 816 (-13%) | 3mo | $125,000 | $153 | 62 |
| 2416 Milburn Blvd | 0.22mi | 2/1.0 (-1) | 823 (-12%) | 6mo | $156,500 | $190 | 60 |
| 1331 29th St | 0.61mi | 2/1.0 (-1) | 948 (+1%) | 6mo | $97,900 | $103 | 59 |
| 2405 Woodmont Dr | 0.37mi | 2/1.0 (-1) | 1,056 (+13%) | 5mo | $122,500 | $116 | 52 |
| 1714 S Twyckenham Dr | 0.68mi | 2/1.0 (-1) | 870 (-7%) | 1mo | $91,000 | $105 | 51 |
| 1610 E Donald St | 0.54mi | 2/1.0 (-1) | 1,028 (+10%) | 3mo | $120,000 | $117 | 50 |
Match score weights: distance 35% · size 25% · config 20% · recency 20%. Top-matched comps best support the ARV.
Projected returns pro-forma
-3.0% appreciation · 8.0% rent growth · sell at horizon
- IRR
- -11.5%
- Equity multiple
- 0.57×
- Total profit
- $-20,003
- Equity at exit
- $24,587
- IRR
- 3.4%
- Equity multiple
- 1.29×
- Total profit
- $13,468
- Equity at exit
- $14,258
Cash invested: $46,172 (down + closing). Projections, not guarantees.
Landlord ↔ Tenant lean methodology
- Overall (STATE)
- 90 Strongly Landlord-Friendly
- State Indiana
- 90 Strongly Landlord-Friendly · R+11
- County
- — inherits STATE
- City
- — inherits STATE
ZIP-level market 46544
- Rents YoY
- 9.1%
- Active inventory
- 140
- Price-to-rent
- 10.6×
Monthly cashflow live
- Estimated rent
- $1,297 high interval (Pro) →
- Mortgage (P&I)
- −$865
- Tax from tax record
- −$93 /mo · $1,113/yr
- Insurance
- −$69
- HOA
- −$0
- Vacancy / Maint / Mgmt
- −$272
- Net cashflow
- $-1
Break-even live
UW: 25.0% down · 7.5% · 30yr · 1.5% tax · 5.0% vac · 8.0% maint · 8.0% mgmt
Financing live
Cash to close
- Down payment
- $41,225
- Closing costs
- $4,947
- Reserves months
- —
- Total cash needed
- —
Loan-product check · same deal, 3 products live
Conventional
25% down · 7.5% · 30yr
- Down + closing
- —
- Monthly P&I
- —
- Monthly cashflow
- —
- DSCR
- —
- Eligible?
- —
Personal DTI + credit; lowest rate.
DSCR
20% down · 8.5% · 30yr
- Down + closing
- —
- Monthly P&I
- —
- Monthly cashflow
- —
- DSCR
- —
- Eligible?
- —
No personal income docs; deal must DSCR.
Hard money
10% down · 12.0% · 12mo
- Down + closing
- —
- Monthly P&I
- —
- Monthly cashflow
- —
- DSCR
- —
- Eligible?
- —
Short-term bridge; refi at stabilization.
Rent comps 18 comps
| Address | Beds | Baths | Sqft | Rent | $/sqft | DOM | Units | Dist |
|---|---|---|---|---|---|---|---|---|
| 2804 Delaware St Mishawaka, IN | 2.0 | 1.0 | 720 | $1,200 | $1.67 | 13d | 1 | 0.10mi |
| 1729 E Calvert St South Bend, IN | 3.0 | 1.0 | 900 | $1,300 | $1.44 | 43d | 1 | 0.44mi |
| 1701 E Donald St South Bend, IN | 2.0 | 1.0 | 720 | $1,075 | $1.49 | 43d | 1 | 0.47mi |
| 1218 S 26th St South Bend, IN | 3.0 | 1.0 | 856 | $1,400 | $1.64 | 13d | 1 | 0.63mi |
| 607 Hendricks St Mishawaka, IN | 2.0 | 1.0 | 528 | $1,200 | $2.27 | 21d | 1 | 0.70mi |
| 1106 S 20th St South Bend, IN | 1.0–3.0 | 1.0–2.0 | 885 | $1,200 | $1.36 | 13d | 1 | 0.74mi |
| 1213 E Donald St South Bend, IN | 2.0 | 1.0 | 648 | $1,050 | $1.62 | 21d | 1 | 0.95mi |
| 1202 W 7th St Unit B Mishawaka, IN | 2.0 | 1.0 | 600 | $1,100 | $1.83 | 13d | 1 | 0.96mi |
| 3530 Northside Blvd South Bend, IN | 1.0–2.0 | 1.0 | 850 | $1,200 | $1.41 | 13d | 1 | 0.96mi |
| 754 S 23rd St South Bend, IN | 3.0 | 1.0 | 884 | $1,300 | $1.47 | 43d | 1 | 1.02mi |
| 1006 S 35th St South Bend, IN | 3.0 | 2.0 | 816 | $1,000 | $1.23 | 13d | 1 | 1.05mi |
| 737 S 30th St South Bend, IN | 3.0 | 2.0 | 1000 | $1,600 | $1.60 | 43d | 1 | 1.11mi |
| 526 S 28th St South Bend, IN | 2.0 | 1.0 | 1000 | $1,350 | $1.35 | 13d | 1 | 1.25mi |
| 4245 Irish Hills Dr South Bend, IN | 1.0–2.0 | 1.0–1.5 | 739 | $1,436 | $1.94 | 13d | 77 | 1.27mi |
| 2032 Southern Vw Unit 1a South Bend, IN | 2.0 | 1.0 | 1000 | $1,200 | $1.20 | 13d | 1 | 1.27mi |
| 427 S 27th St South Bend, IN | 2.0 | 1.0 | 840 | $950 | $1.13 | 43d | 1 | 1.32mi |
| 2114 High St South Bend, IN | 3.0 | 1.0 | 949 | $1,300 | $1.37 | 43d | 1 | 1.35mi |
| 516 W 3rd St #6 Mishawaka, IN | 2.0 | 1.0 | 700 | $800 | $1.14 | 13d | 1 | 1.45mi |
Listing history 14 events
-
2026-05-20status Pending
-
2026-05-18status Active
-
2026-05-06status Pending
-
2026-05-05historical Active Under Contract
-
2026-05-01status Active
-
2026-04-08historical Active Under Contract
-
2026-04-02$164,900 Active
-
2024-11-08soldstatus $140,000 Closed 476-char remark
Show marketing remark (476 chars)
Move in ready 3 Bedroom 1 bath home. New Vinyl plank flooring throughout the home in 2020. All appliances are included and the dishwasher was new in July 2021. Washer and Dryer are conviently located near the kitchen area. Home had a New Water Heater installed in March of 2023 and Central Air in May of 2021. Virtually maintenance free and move in ready. Over-sized garage with plenty of room for storage and a fenced in yard. Close to shopping and schools. Quick closing.
-
2024-10-09status Pending 476-char remark
Show marketing remark (476 chars)
Move in ready 3 Bedroom 1 bath home. New Vinyl plank flooring throughout the home in 2020. All appliances are included and the dishwasher was new in July 2021. Washer and Dryer are conviently located near the kitchen area. Home had a New Water Heater installed in March of 2023 and Central Air in May of 2021. Virtually maintenance free and move in ready. Over-sized garage with plenty of room for storage and a fenced in yard. Close to shopping and schools. Quick closing.
-
2024-09-15$149,000 Active 476-char remark
Show marketing remark (476 chars)
Move in ready 3 Bedroom 1 bath home. New Vinyl plank flooring throughout the home in 2020. All appliances are included and the dishwasher was new in July 2021. Washer and Dryer are conviently located near the kitchen area. Home had a New Water Heater installed in March of 2023 and Central Air in May of 2021. Virtually maintenance free and move in ready. Over-sized garage with plenty of room for storage and a fenced in yard. Close to shopping and schools. Quick closing.
-
2016-10-28soldstatus $45,000
-
2016-08-06$57,900
-
2016-04-13$56,500
-
2015-06-11$56,900
ⓘ Source: listings_history table (triggers on properties + properties_extension) + one-shot
backfill from property_details.listing_events for pre-trigger history.
Tax reassessment forecast IN · Partial reset (capped growth)
- Current annual tax
- $1,113 · $93/mo
- Projected year-2 tax
- $1,257 · $105/mo
- Expected delta
- +$144/yr (+$12/mo · 13.0%)
ⓘ Screening estimate from a state-policy table — verify with the county assessor before closing.
Climate risk First Street
- Flood 1/10 Low FEMA zone X (unshaded) · 0% chance over 30 yrs
- Wildfire 1/10 Low
- Heat 3/10 Moderate 7 d/yr ≥99°F today · 16 d/yr by 30 yrs out
- Wind 2/10 Low
- Air quality 3/10 Moderate 2 unhealthy d/yr today · 3 by 30 yrs out
Nearby sold comps map
Loading sold comps map…
Walkable amenities ~0.75 mi
Loading nearby amenities…
Taxation est. · year 1
- Rental income
- $15,567
- − Mortgage interest
- −$9,237
- − Property taxes
- −$1,113
- − Insurance
- −$824
- − Repairs & maintenance
- −$1,245
- − Management
- −$1,245
- − Depreciation
- −$4,797
- Taxable loss
- −$2,895
- Est. tax savings @ 24.0%
- +$695
- After-tax cash flow
- $678/yr
For passive investors: Depreciation is non-cash, so a rental often shows a tax loss while cash-flowing — sheltering income. Rental losses are passive: they offset passive income freely, and up to $25,000/yr can offset ordinary (W-2) income if you actively participate and your MAGI is under $100k (phasing out to $0 by $150k); unused losses carry forward. On sale, claimed depreciation is recaptured at up to 25%, and gains may owe capital-gains tax (a 1031 exchange can defer both). Figures are a year-1 estimate at your 24.0% rate — not tax advice; consult a CPA.
Schools (NCES district)
- District
- School City Of Mishawaka
- NCES district ID
- 1806840
- Math proficiency
- 23% ▼ -9.00%
- Reading proficiency
- 30% ▼ -7.00%
- Median HH income
- $39,290
- Composite
- 22.26/100
- National rank
- #8143
- State rank
- #260 of 301 in IN
Livability — Mishawaka
- Score
- 76/100
- State rank
- #53
- US rank
- #3586
Category grades
Schools grade is shown separately in the Schools card above.
Census & demographics
- Census place
- Mishawaka, IN
- County
- Saint Joseph County · 189,048 people
- City population
- 57,683
- Metro
- South Bend-Mishawaka, IN-MI
- Population (ZIP)
- 31,077
- Household income
- $58,829
- Rent vs Own
- Severe rent burden
- 685.0
Population outlook (St. Joseph County) Hauer SSP2
- Today (2025)
- 273,186 people
- By 2030
- 273,594 · +0.1%
- By 2040
- 271,641 · -0.6%
- By 2050
- 269,187 · -1.5%
- By 2075
- 263,136 · -3.7%
- By 2100
- 245,659 · -10.1%
Race, ethnicity, and origin ACS 2023
- Neighborhood character
- Predominantly White (79%)
- Race & ethnicity
- White 79% Black 9% Two or more races 7% Hispanic / Latino 6% Asian 1%
- Hispanic origin (detail)
- Mexican 5%
- Common ancestry
- Romanian 7% English 3% Lithuanian 2%
- Foreign-born
- 4% · Canada, Vietnam
- Languages at home
- 94% English-only · Spanish 3%
Political lean MEDSL · St. Joseph
- 2024 margin
- Toss-up / Even · D 50.0% · R 48.5% · Other 1.5%
- 2008→2024 swing
- -15.6pp toward R · 2008: 17.1pp · 2024: 1.5pp
- All cycles
- 2024: D+1.5 2020: D+5.8 2016: D+0.2 2012: D+3.5 2008: D+17.1
Not yet ingested
- Civics
- —
Market trends
- HPI YoY
- ▼ -116.74%
- Current HPI
- 188.9996
- Rent YoY
- ▲ 9.10%
- Metro
- South Bend-Mishawaka, IN-MI
- State GDP YoY
- ▲ 2.90%
- F500 in state
- 18
Industry mix (Fortune 500 HQ in IN)
| Industry | F500 HQs | Revenue |
|---|---|---|
| Industrial Machinery | 2 | $37B |
|
||
| Healthcare | 1 | $177B |
|
||
| Pharmaceuticals | 1 | $45B |
|
||
| Metals / Steel | 1 | $18B |
|
||
| Agriculture | 1 | $17B |
|
||
| Packaging | 1 | $12B |
|
||
Price history
+189.8% since first listed14 events — show timeline
- 2026-05-20 Pending — IRMLS
- 2026-05-18 Relisted — IRMLS
- 2026-05-06 Pending — IRMLS
- 2026-05-05 Contingent — IRMLS
- 2026-05-01 Relisted — IRMLS
- 2026-04-08 Contingent — IRMLS
- 2026-04-02 Listed $164,900 IRMLS
- 2024-11-08 Sold (MLS) $140,000 IRMLS
- 2024-10-09 Pending — IRMLS
- 2024-09-15 Listed $149,000 IRMLS
- 2016-10-28 Sold (MLS) $45,000 IRMLS
- 2016-08-06 Listed $57,900 IRMLS
- 2016-04-13 Listed $56,500 IRMLS
- 2015-06-11 Listed $56,900 IRMLS
Property tax history
-5.5%/yrLatest (2023): $1,113 · +0.1% YoY. Source: county tax records.
Cash-flow waterfall
monthlySold comps — $/sqft
last 12 mo · ≤1 miLoading sold comps…