 10-Plex
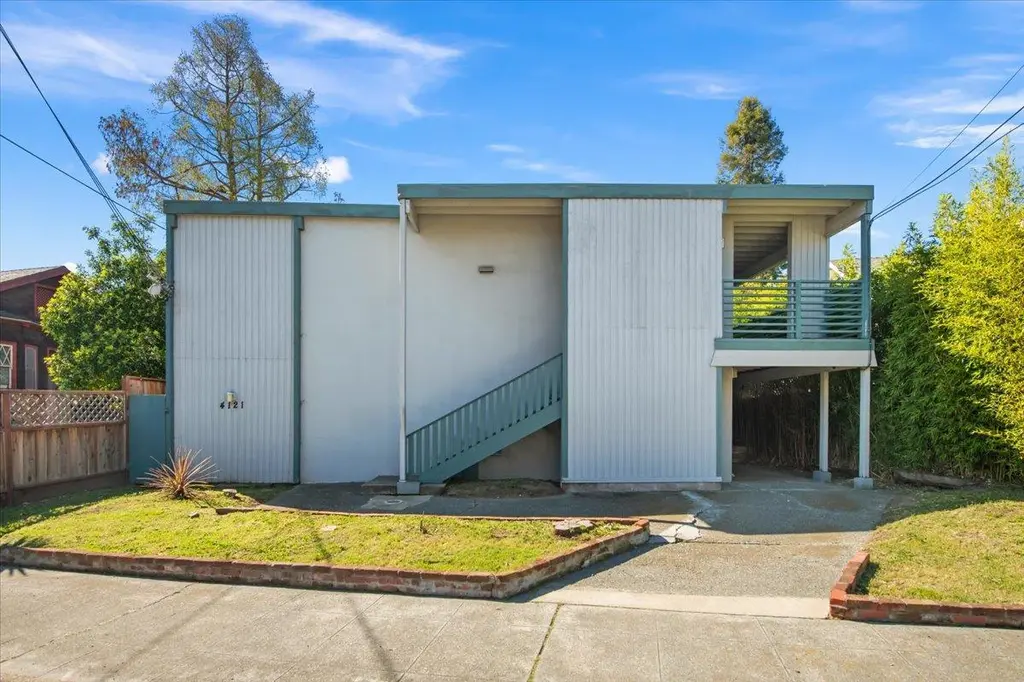
4121 Opal St · Oakland, CA
Flood risk 1/10 · Minimal
- FEMA flood zone
- X (unshaded)
- Chance of flooding over 30 yrs
- 0.0%
- Est. flood insurance / yr
- $507 – $1,088
Fire risk 1/10 · Minimal
- Est. fire insurance / yr
- $659 – $1,223
Heat risk 3/10 · Minor
- Hot days now (above 84°F)
- 7 days/yr
- Hot days in 30 yrs
- 15 days/yr
Wind risk 1/10 · Minimal
- Chance of severe wind over 30 yrs
- —
Air-quality risk 9/10 · Severe
- Unhealthy air days now
- 16 days/yr
- Unhealthy air days in 30 yrs
- 16 days/yr
Risk factors via First Street. Map © Google.
Why this score? — see what drove the C+ grade
The composite is a weighted blend of 9 inputs, each scored 0–100. Each bar is that input's sub-score; the figure is the points it added to the 100-point composite (weight × sub-score).
- Cash flow +30.0/30.0
- 1% rule +10.0/10.0
- DSCR +10.0/10.0
- Rent growth +4.1/5.0
- Livability +3.6/5.0
- Schools +3.0/10.0
- Condition / age +2.5/5.0
- ARV discount +0.0/15.0
- Appreciation +0.0/10.0
$1,995,000
🖨 Deal sheet 📄 Offer letter ✓ Due diligence
Multi-family units
County records classify this as Multi-Family (5+ Unit). Listing-text estimate: 10 units. confirmed
5+ unit building — per-unit beds/baths from public records are typically unavailable; the breakdown below (if shown) is an estimate from the listing text.
Listing remarks MLS
Marcus & Millichap is pleased to present 4121 Opal Street, a 10-unit apartment building ideally located in Oakland's highly desirable Temescal neighborhood, one of the East Bay's most vibrant and walkable districts. Offered at an attractive $208,000 per unit with nearly a 6% cap rate, the property presents a compelling investment opportunity with significant upside through cosmetic improvements. The asset benefits from exceptional walkability and immediate access to the shopping, dining, and entertainment along Telegraph Avenue, Broadway, and Piedmont Avenue, placing tenants in the center of one of Oaklands most dynamic urban corridors.
Key facts
- 7,600 sq ft lot
- 4 parking spots
- Built 1962
Tags
Neighborhood map
What this means for you Summary
Snapshot
- This is a 10 × 10-bed/10.0-bath units multifamily listed at $2.00M.
Deal economics
- At list price, monthly cash flow is $11k ($131k/yr) — positive. Per door: $1k/mo.
- The deal already cash-flows at list — no discount required.
- Meets the 1% rule at list price ($32k rent vs $2.00M).
- Recommended offer: $1.82M (9.0% below list) — sets the bar for market timing.
- Cap rate 12.9% vs local median 2.4% in Oakland — top-decile yield for the area; either an underpriced asset or a hidden risk that comps aren't pricing in. Stress-test before assuming the spread holds.
Location & tenants
- Location reads 71/100 on livability (#224 in CA) — a middle-class / working-renter tenant base. Strengths: amenities A+, commute A+, employment A+; Watch: schools C-, crime F, cost of living F.
- Oakland Unified (urban): math 27% / reading 33% proficiency, ranked #1,007 of 1,400 in CA (top 72%) — families likely to look elsewhere, expect single-tenant / working-renter base with shorter leases; 68% free/reduced lunch — lower-income household profile, screen leases tightly.
- Market conditions: Rents rising fast (+6.5%/yr); 85 active listings in the ZIP; solid renter incomes; 1,742 units permitted in Alameda County in 2024 (856 in 5+ unit buildings).
- At $32,040/mo this rent would consume 357% of the median local household income ($108k/yr) (locally 1721% of renters already pay >50% of income on rent) — very limited rent-growth headroom before tenants either downsize or default.
Forward outlook
- Local home prices are declining (-3.0%/yr); year-one equity from $14k of loan paydown is wiped out by about $60k of value loss. Plan a longer hold.
- Alameda County population projected at +34% by 2050 — long-run rental-demand tailwind backs the buy-and-hold thesis.
- At projected returns (-3.0% appreciation + 6.5% rent growth), your $559k cash investment doubles in ~5 years — after that, you're playing with house money.
Negotiation context
- It's been on market 97 days — a 9% lower offer ($1.82M) is reasonable based on typical stale-listing flexibility.
- 2 sale attempts with the ask held roughly flat each time — persistent listings suggest the price (not the market) is what's stuck; bring a comps-based counter.
Questions for the listing agent
- It's been on market 97 days. Have you received any prior offers? Is the seller open to a 9% concession, seller financing, or rate buy-down credit?
- Can we see the unit-by-unit rent roll, current vacancy, and any below-market leases? What's the average tenancy length?
- What capital expenditures (roof, boiler, parking lot, exteriors) have been made in the last 5 years, and what's planned in the next 2?
- Built in 1962 — when were the roof, HVAC, electrical panel, plumbing, and water heater last replaced?
- Why hasn't it sold? Are there any deal-killer items the seller is aware of (foundation, flood, title, zoning, code violations)?
- Is there a deadline driving the sale (1031 exchange, divorce, estate, relocation)? That informs how much negotiation room exists.
- Crime grade is F in this area — have there been break-ins, vandalism, or insurance claims at this property in the last 3 years? What carrier currently insures it and at what premium?
- What's the average days-on-market for RENTAL listings here right now (not sales)? A rising rental-DOM trend means longer vacancies and softer asking-rent achievability than the comps imply.
- What's the recent tenant-quality profile in this submarket — average credit score on applications, eviction rate, late-payment / NSF rate, and stable-employment percentage? A property-management company in the area should have these aggregated.
- How much new apartment / multifamily construction is in the pipeline within 1–3 miles? Heavy new supply (>2% of stock underway) typically softens rents 12–24 months out; light construction supports rent growth.
Investment metrics
- 1% rule
- 1.61% ✓
- Cap rate
- 12.88%
- Cash-on-cash
- 23.54%
- DSCR
- 2.05
- GRM
- 5.2
CMA / ARV
- ARV (median comp)
- $1,645,859
- List price
- $1,995,000
- Delta
- 21.21%
- Verdict
- OVERPRICED
- Comps
- 20 within 1.0 mi
Projected returns pro-forma
-3.0% appreciation · 6.51% rent growth · sell at horizon
- IRR
- 20.7%
- Equity multiple
- 1.88×
- Total profit
- $492,521
- Equity at exit
- $297,461
- IRR
- 31.2%
- Equity multiple
- 4.31×
- Total profit
- $1,847,515
- Equity at exit
- $172,491
Cash invested: $558,600 (down + closing). Projections, not guarantees.
Landlord ↔ Tenant lean methodology
- Overall (CITY)
- 0 Strongly Tenant-Friendly
- State California
- 18 Strongly Tenant-Friendly · D+13
- County
- — inherits STATE
- City Oakland
- 0 Strongly Tenant-Friendly · D+62
ZIP-level market 94609
- Rents YoY
- 6.5%
- Active inventory
- 85
- Price-to-rent
- 51.9×
Monthly cashflow live
- Estimated rent
- $32,040 medium interval (Pro) →
- Mortgage (P&I)
- −$10,462
- Tax from tax record
- −$3,062 /mo · $36,741/yr
- Insurance
- −$831
- HOA
- −$0
- Vacancy / Maint / Mgmt
- −$6,728
- Net cashflow
- $10,957
Break-even live
10-unit breakdown (identical units grouped — click to expand)
| Units | Beds | Baths | Est. rent |
|---|---|---|---|
| 10× units | 10 | 10 | $32,040 |
| #1 | 10 | 10 | $3,204 |
| #2 | 10 | 10 | $3,204 |
| #3 | 10 | 10 | $3,204 |
| #4 | 10 | 10 | $3,204 |
| #5 | 10 | 10 | $3,204 |
| #6 | 10 | 10 | $3,204 |
| #7 | 10 | 10 | $3,204 |
| #8 | 10 | 10 | $3,204 |
| #9 | 10 | 10 | $3,204 |
| #10 | 10 | 10 | $3,204 |
| Total (10 units) | $32,040 | ||
UW: 25.0% down · 7.5% · 30yr · 1.5% tax · 5.0% vac · 8.0% maint · 8.0% mgmt
Financing live
Cash to close
- Down payment
- $498,750
- Closing costs
- $59,850
- Reserves months
- —
- Total cash needed
- —
Loan-product check · same deal, 3 products live
Conventional
25% down · 7.5% · 30yr
- Down + closing
- —
- Monthly P&I
- —
- Monthly cashflow
- —
- DSCR
- —
- Eligible?
- —
Personal DTI + credit; lowest rate.
DSCR
20% down · 8.5% · 30yr
- Down + closing
- —
- Monthly P&I
- —
- Monthly cashflow
- —
- DSCR
- —
- Eligible?
- —
No personal income docs; deal must DSCR.
Hard money
10% down · 12.0% · 12mo
- Down + closing
- —
- Monthly P&I
- —
- Monthly cashflow
- —
- DSCR
- —
- Eligible?
- —
Short-term bridge; refi at stabilization.
Listing history 23 events
-
2026-06-18days on market $1,995,000 Active 97 DOM
-
2026-06-17days on market $1,995,000 Active 96 DOM
-
2026-06-16days on market $1,995,000 Active 95 DOM
-
2026-06-15days on market $1,995,000 Active 94 DOM
-
2026-06-13days on market $1,995,000 Active 92 DOM
-
2026-06-13days on market $1,995,000 Active 91 DOM
-
2026-06-09days on market $1,995,000 Active 88 DOM
-
2026-06-08days on market $1,995,000 Active 87 DOM
-
2026-06-07days on market $1,995,000 Active 86 DOM
-
2026-06-04days on market $1,995,000 Active 83 DOM
-
2026-06-03days on market $1,995,000 Active 82 DOM
-
2026-06-02days on market $1,995,000 Active 81 DOM
-
2026-06-01days on market $1,995,000 Active 80 DOM
-
2026-05-31days on market $1,995,000 Active 79 DOM
-
2026-04-10price $1,995,000 648-char remark
Show marketing remark (648 chars)
Marcus & Millichap is pleased to present 4121 Opal Street, a 10-unit apartment building ideally located in Oakland's highly desirable Temescal neighborhood, one of the East Bay's most vibrant and walkable districts. Offered at an attractive $208,000 per unit with nearly a 6% cap rate, the property presents a compelling investment opportunity with significant upside through cosmetic improvements. The asset benefits from exceptional walkability and immediate access to the shopping, dining, and entertainment along Telegraph Avenue, Broadway, and Piedmont Avenue, placing tenants in the center of one of Oaklands most dynamic urban corridors.
-
2026-03-13$2,080,000 Active 648-char remark
Show marketing remark (648 chars)
Marcus & Millichap is pleased to present 4121 Opal Street, a 10-unit apartment building ideally located in Oakland's highly desirable Temescal neighborhood, one of the East Bay's most vibrant and walkable districts. Offered at an attractive $208,000 per unit with nearly a 6% cap rate, the property presents a compelling investment opportunity with significant upside through cosmetic improvements. The asset benefits from exceptional walkability and immediate access to the shopping, dining, and entertainment along Telegraph Avenue, Broadway, and Piedmont Avenue, placing tenants in the center of one of Oaklands most dynamic urban corridors.
-
2023-11-14soldstatus $1,900,000
-
2012-12-27soldstatus $900,000
-
1997-10-01soldstatus $485,000
-
1995-08-08soldstatus $519,027
-
1992-02-24soldstatus $555,000
ⓘ Source: listings_history table (triggers on properties + properties_extension) + one-shot
backfill from property_details.listing_events for pre-trigger history.
Tax reassessment forecast CA · Resets to sale price
- Current annual tax
- $36,741 · $3,062/mo
- Projected year-2 tax
- $36,741 · $3,062/mo
- Expected delta
- $0/yr ($0/mo · 0.0%)
ⓘ Screening estimate from a state-policy table — verify with the county assessor before closing.
Climate risk First Street
- Flood 1/10 Low FEMA zone X (unshaded) · 0% chance over 30 yrs
- Wildfire 1/10 Low
- Heat 3/10 Moderate 7 d/yr ≥84°F today · 15 d/yr by 30 yrs out
- Wind 1/10 Low
- Air quality 9/10 Extreme 16 unhealthy d/yr today · 16 by 30 yrs out
Nearby sold comps map
Loading sold comps map…
Walkable amenities ~0.75 mi
Loading nearby amenities…
Taxation est. · year 1
- Rental income
- $384,480
- − Mortgage interest
- −$111,751
- − Property taxes
- −$36,741
- − Insurance
- −$9,975
- − Repairs & maintenance
- −$30,758
- − Management
- −$30,758
- − Depreciation
- −$58,036
- Taxable income
- $106,459
- Est. tax owed @ 24.0%
- −$25,550
- After-tax cash flow
- $105,929/yr
For passive investors: Depreciation is non-cash, so a rental often shows a tax loss while cash-flowing — sheltering income. Rental losses are passive: they offset passive income freely, and up to $25,000/yr can offset ordinary (W-2) income if you actively participate and your MAGI is under $100k (phasing out to $0 by $150k); unused losses carry forward. On sale, claimed depreciation is recaptured at up to 25%, and gains may owe capital-gains tax (a 1031 exchange can defer both). Figures are a year-1 estimate at your 24.0% rate — not tax advice; consult a CPA.
Schools (NCES district)
- District
- Oakland Unified
- NCES district ID
- 0628050
- Math proficiency
- 27% ▬ 0.00%
- Reading proficiency
- 33% ▬ 0.00%
- Median HH income
- $55,194
- Composite
- 29.52/100
- National rank
- #11769
- State rank
- #1007 of 1400 in CA
Livability — Oakland
- Score
- 71/100
- State rank
- #224
- US rank
- #7245
Category grades
Schools grade is shown separately in the Schools card above.
Census & demographics
- Census place
- Oakland, CA
- County
- Alameda County · 1,614,355 people
- City population
- 385,993
- Metro
- San Francisco-Oakland-Berkeley, CA
- Population (ZIP)
- 23,928
- Household income
- $107,834
- Rent vs Own
- Severe rent burden
- 1721.0
Population outlook (Alameda County) Hauer SSP2
- Today (2025)
- 1,928,884 people
- By 2030
- 2,069,146 · +7.3%
- By 2040
- 2,338,405 · +21.2%
- By 2050
- 2,586,608 · +34.1%
- By 2075
- 3,061,911 · +58.7%
- By 2100
- 3,234,133 · +67.7%
Race, ethnicity, and origin ACS 2023
- Neighborhood character
- Highly diverse neighborhood (Simpson 0.74)
- Race & ethnicity
- White 41% Black 25% Hispanic / Latino 14% Two or more races 13% Asian 10%
- Hispanic origin (detail)
- Mexican 8%
- Common ancestry
- Italian 3% Romanian 2% Lithuanian 2%
- Foreign-born
- 18% · Canada, China, Vietnam
- Languages at home
- 76% English-only · Spanish 8% Other Indo-European 3% Chinese 2%
Political lean MEDSL · Alameda
- 2024 margin
- Solid D (+53.6) · D 74.6% · R 21.0% · Other 4.4%
- 2008→2024 swing
- -5.9pp toward R · 2008: 59.5pp · 2024: 53.6pp
- All cycles
- 2024: D+53.6 2020: D+62.5 2016: D+64.4 2012: D+59.8 2008: D+59.5
Not yet ingested
- Civics
- —
Market trends
- HPI YoY
- ▼ -765.68%
- Current HPI
- 327.2982
- Rent YoY
- ▲ 6.51%
- Metro
- San Francisco-Oakland-Berkeley, CA
- State GDP YoY
- ▲ 3.21%
- F500 in state
- 116
Industry mix (Fortune 500 HQ in CA)
| Industry | F500 HQs | Revenue |
|---|---|---|
| Technology | 27 | $1,492B |
|
||
| Financial Services | 3 | $174B |
|
||
| Retail | 3 | $44B |
|
||
| Insurance | 3 | $26B |
|
||
| Media / Entertainment | 2 | $115B |
|
||
| Pharmaceuticals / Biotech | 2 | $62B |
|
||
Price history
+259.5% since first listed9 events — show timeline
- 2026-04-10 Price Changed $1,995,000 bridgeMLS, Bay East AOR, or Contra Costa AOR
- 2026-04-10 Price Changed $1,995,000 MLSListings
- 2026-03-13 Listed $2,080,000 MLSListings
- 2026-03-13 Listed $2,080,000 bridgeMLS, Bay East AOR, or Contra Costa AOR
- 2023-11-14 Sold (Public Records) $1,900,000 Public Records
- 2012-12-27 Sold (Public Records) $900,000 Public Records
- 1997-10-01 Sold (Public Records) $485,000 Public Records
- 1995-08-08 Sold (Public Records) $519,027 Public Records
- 1992-02-24 Sold (Public Records) $555,000 Public Records
Property tax history
+7.5%/yrLatest (2025): $36,741 · +16.4% YoY. Source: county tax records.
Cash-flow waterfall
monthlySold comps — $/sqft
last 12 mo · ≤1 miLoading sold comps…