129 Havana Glen Rd. Rd · Montour Falls, NY
Flood risk 5/10 · Moderate
- FEMA flood zone
- X
- Chance of flooding over 30 yrs
- 0.49%
- Est. flood insurance / yr
- $473 – $860
Fire risk 3/10 · Minor
- Est. fire insurance / yr
- $691 – $1,283
Heat risk 3/10 · Minor
- Hot days now (above 94°F)
- 7 days/yr
- Hot days in 30 yrs
- 17 days/yr
Wind risk 1/10 · Minimal
- Chance of severe wind over 30 yrs
- 0.0%
Air-quality risk 1/10 · Minimal
- Unhealthy air days now
- 0 days/yr
- Unhealthy air days in 30 yrs
- 0 days/yr
Risk factors via First Street. Map © Google.
Why this score? — see what drove the C- grade
The composite is a weighted blend of 9 inputs, each scored 0–100. Each bar is that input's sub-score; the figure is the points it added to the 100-point composite (weight × sub-score).
- Cash flow +16.9/30.0
- Appreciation +7.1/10.0
- DSCR +5.3/10.0
- ARV discount +5.0/15.0
- Schools +4.3/10.0
- 1% rule +3.8/10.0
- Livability +3.2/5.0
- Rent growth +2.5/5.0
- Condition / age +2.5/5.0
$125,000
🖨 Deal sheet 📄 Offer letter ✓ Due diligence
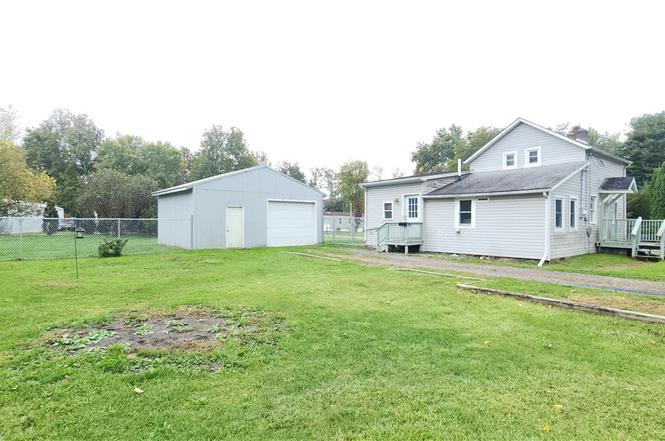
Listing remarks
Welcome to this delightful 3-bedroom, 2-bath home located in the Village of Montour Falls—just a short walk to beautiful Havana Glen Park! Step inside to find a spacious layout with many updates throughout. The large kitchen offers plenty of room for cooking and entertaining. The first floor features two comfortable bedrooms and a full bath with a walk-in shower. Upstairs, you’ll find a spacious bedroom with a beautifully remodeled full bathroom featuring a relaxing soaker tub. The fenced-in backyard is perfect for kids, pets, or outdoor gatherings. A large garage provides great storage and could easily be finished for extra living or hobby space. With its mix of charm, updates,
Key facts
- Large kitchen
- Fenced-in backyard
- Soaker tub
Tags
Neighborhood map
What this means for you Summary
Snapshot
- This is a 3-bed/1.5-bath single-family listed at $125k.
Deal economics
- At list price, monthly cash flow is $83 ($990/yr) — positive.
- The deal already cash-flows at list — no discount required.
- To meet the 1% rule (rent ≥ 1% of price), the offer needs to be $111k (11.6% below list).
- Recommended offer: $111k (11.6% below list) — sets the bar for 1% rule.
Location & tenants
- Location reads 63/100 on livability (#786 in NY) — a middle-class / working-renter tenant base. Strengths: cost of living A+, crime A-, housing B+; Watch: health & safety D, amenities F, commute F.
- Odessa-Montour Central School District (rural): math 41% / reading 60% proficiency, ranked #383 of 590 in NY (top 65%) — acceptable for families but not a draw, mixed tenant base, ~2y average lease.
- Zoned schools: B C Cate Elementary School (239 students, 38% FRL) — zoned schools at 38% FRL track the district average.
- Market conditions: 19 active listings in the ZIP; 52 units permitted in Schuyler County in 2024 (0 in 5+ unit buildings).
Forward outlook
- In year one you build about $6k of equity ($864 loan paydown + $5k appreciation (4.2% local appreciation)).
- Schuyler County population projected at -15% by 2050 — secular population decline; favor cash flow + early exit over multi-decade hold.
- At projected returns (4.2% appreciation + 3.0% rent growth), your $35k cash investment doubles in ~5 years — after that, you're playing with house money.
- By year 6, paydown + projected appreciation supports a ~$32k cash-out refi (75% LTV) — recoverable capital for the next deal without selling this one.
Negotiation context
- It's been on market 28 days — a 2% lower offer ($123k) is reasonable based on typical stale-listing flexibility.
- 3 sale attempts with the ask held roughly flat each time — persistent listings suggest the price (not the market) is what's stuck; bring a comps-based counter.
Risks & watch-outs
- Watch-outs: built in 1940 — expect roof / HVAC / electrical / plumbing capex.
- Climate carrying-cost: moderate flood risk — expect insurance premiums to compound above CPI over the hold.
Questions for the listing agent
- Built in 1940 — when were the roof, HVAC, electrical panel, plumbing, and water heater last replaced?
- Is there a deadline driving the sale (1031 exchange, divorce, estate, relocation)? That informs how much negotiation room exists.
- Schools are F-rated, which usually means shorter tenancies and higher turnover. Who's the typical renter profile here, and what's been the actual vacancy rate?
- What's the average days-on-market for RENTAL listings here right now (not sales)? A rising rental-DOM trend means longer vacancies and softer asking-rent achievability than the comps imply.
- What's the recent tenant-quality profile in this submarket — average credit score on applications, eviction rate, late-payment / NSF rate, and stable-employment percentage? A property-management company in the area should have these aggregated.
- How much new for-sale + rental construction is in the pipeline within 1–3 miles? Heavy new supply typically softens prices + rents 12–24 months out; constrained supply supports both.
Investment metrics
- 1% rule
- 0.88% ✗
- Cap rate
- 7.09%
- Cash-on-cash
- 2.83%
- DSCR
- 1.13
- GRM
- 9.4
CMA / ARV
- ARV (on-the-fly)
- $118,545
- Comps found
- 1
Show comp detail 1 sale within ~0.75 mi
| Address | Dist | Beds/Ba | Sqft | Sold | Price | $/sf | Match |
|---|---|---|---|---|---|---|---|
| 129 Havana Glen Rd. Rd | 0.00mi | 3/2.0 | 1,129 (0%) | 1mo | $118,000 | $105 | 97 |
Match score weights: distance 35% · size 25% · config 20% · recency 20%. Top-matched comps best support the ARV.
Projected returns pro-forma
4.16% appreciation · 3.0% rent growth · sell at horizon
- IRR
- 13.2%
- Equity multiple
- 1.80×
- Total profit
- $28,125
- Equity at exit
- $64,545
- IRR
- 14.4%
- Equity multiple
- 3.39×
- Total profit
- $83,529
- Equity at exit
- $106,510
Cash invested: $35,000 (down + closing). Projections, not guarantees.
Landlord ↔ Tenant lean methodology
- Overall (STATE)
- 15 Strongly Tenant-Friendly
- State New York
- 15 Strongly Tenant-Friendly · D+10
- County
- — inherits STATE
- City
- — inherits STATE
ZIP-level market 14865
- Home prices YoY
- 1.6%
- Active inventory
- 19
- Price-to-rent
- 9.4×
Monthly cashflow live
- Estimated rent
- $1,106 medium interval (Pro) →
- Mortgage (P&I)
- −$656
- Tax from tax record
- −$83 /mo · $1,000/yr
- Insurance
- −$52
- HOA
- −$0
- Vacancy / Maint / Mgmt
- −$232
- Net cashflow
- $83
Break-even live
UW: 25.0% down · 7.5% · 30yr · 1.5% tax · 5.0% vac · 8.0% maint · 8.0% mgmt
Financing live
Cash to close
- Down payment
- $31,250
- Closing costs
- $3,750
- Reserves months
- —
- Total cash needed
- —
Loan-product check · same deal, 3 products live
Conventional
25% down · 7.5% · 30yr
- Down + closing
- —
- Monthly P&I
- —
- Monthly cashflow
- —
- DSCR
- —
- Eligible?
- —
Personal DTI + credit; lowest rate.
DSCR
20% down · 8.5% · 30yr
- Down + closing
- —
- Monthly P&I
- —
- Monthly cashflow
- —
- DSCR
- —
- Eligible?
- —
No personal income docs; deal must DSCR.
Hard money
10% down · 12.0% · 12mo
- Down + closing
- —
- Monthly P&I
- —
- Monthly cashflow
- —
- DSCR
- —
- Eligible?
- —
Short-term bridge; refi at stabilization.
Listing history 5 events
-
2026-04-02status Pending
-
2026-03-05$125,000 Active
-
2025-12-11status Active
-
2025-10-31historical Active Under Contract
-
2025-10-15$125,000 Active
ⓘ Source: listings_history table (triggers on properties + properties_extension) + one-shot
backfill from property_details.listing_events for pre-trigger history.
Tax reassessment forecast NY · Partial reset (capped growth)
- Current annual tax
- $1,000 · $83/mo
- Projected year-2 tax
- $1,556 · $130/mo
- Expected delta
- +$556/yr (+$46/mo · 55.7%)
ⓘ Screening estimate from a state-policy table — verify with the county assessor before closing.
Climate risk First Street
- Flood 5/10 Major FEMA zone X · 49% chance over 30 yrs
- Wildfire 3/10 Moderate
- Heat 3/10 Moderate 7 d/yr ≥94°F today · 17 d/yr by 30 yrs out
- Wind 1/10 Low 0% chance of damaging wind over 30 yrs
- Air quality 1/10 Low 0 unhealthy d/yr today · 0 by 30 yrs out
Nearby sold comps map
Loading sold comps map…
Walkable amenities ~0.75 mi
Loading nearby amenities…
Taxation est. · year 1
- Rental income
- $13,267
- − Mortgage interest
- −$7,002
- − Property taxes
- −$1,000
- − Insurance
- −$625
- − Repairs & maintenance
- −$1,061
- − Management
- −$1,061
- − Depreciation
- −$3,636
- Taxable loss
- −$1,118
- Est. tax savings @ 24.0%
- +$268
- After-tax cash flow
- $1,259/yr
For passive investors: Depreciation is non-cash, so a rental often shows a tax loss while cash-flowing — sheltering income. Rental losses are passive: they offset passive income freely, and up to $25,000/yr can offset ordinary (W-2) income if you actively participate and your MAGI is under $100k (phasing out to $0 by $150k); unused losses carry forward. On sale, claimed depreciation is recaptured at up to 25%, and gains may owe capital-gains tax (a 1031 exchange can defer both). Figures are a year-1 estimate at your 24.0% rate — not tax advice; consult a CPA.
Schools (NCES district)
- District
- Odessa-Montour Central School District
- NCES district ID
- 3621630
- Math proficiency
- 41% ▼ -8.00%
- Reading proficiency
- 60% ▲ 7.00%
- Median HH income
- $46,720
- Composite
- 42.81/100
- National rank
- #3142
- State rank
- #383 of 590 in NY
Livability — Montour Falls
- Score
- 63/100
- State rank
- #786
- US rank
- #15104
Category grades
Schools grade is shown separately in the Schools card above.
Census & demographics
- Census place
- Montour Falls, NY
- Population (ZIP)
- 2,578
Population outlook (Schuyler County) Hauer SSP2
- Today (2025)
- 17,999 people
- By 2030
- 17,676 · -1.8%
- By 2040
- 16,586 · -7.9%
- By 2050
- 15,322 · -14.9%
- By 2075
- 13,004 · -27.8%
- By 2100
- 10,752 · -40.3%
Race, ethnicity, and origin ACS 2023
- Neighborhood character
- Predominantly White (92%)
- Race & ethnicity
- White 92% Two or more races 6%
- Common ancestry
- Lithuanian 7% Iranian 4% Slovak 3%
- Foreign-born
- 2% · Canada
- Languages at home
- 98% English-only · German/W. Germanic 1%
Political lean MEDSL · Schuyler
- 2024 margin
- Strong R (+21.0) · D 39.5% · R 60.5%
- 2008→2024 swing
- -13.9pp toward R · 2008: -7.1pp · 2024: -21.0pp
- All cycles
- 2024: R+21.0 2020: R+17.6 2016: R+28.7 2012: R+7.9 2008: R+7.1
Not yet ingested
- Civics
- —
Market trends
- HPI YoY
- ▲ 4.16%
- Current HPI
- 263.1314
- Rent YoY
- —
- Metro
- —
- State GDP YoY
- ▲ 2.60%
- F500 in state
- 92
Industry mix (Fortune 500 HQ in NY)
| Industry | F500 HQs | Revenue |
|---|---|---|
| Financial Services | 10 | $950B |
|
||
| Consumer Goods | 9 | $162B |
|
||
| Insurance | 4 | $225B |
|
||
| Telecommunications | 2 | $144B |
|
||
| Pharmaceuticals | 2 | $112B |
|
||
| Media / Entertainment | 2 | $69B |
|
||
Price history
+0.0% since first listed5 events — show timeline
- 2026-04-02 Pending — IBRMLS
- 2026-03-05 Listed $125,000 IBRMLS
- 2025-12-11 Relisted — IBRMLS
- 2025-10-31 Contingent — IBRMLS
- 2025-10-15 Listed $125,000 IBRMLS
Property tax history
+0.1%/yrLatest (2023): $1,000 · -68.6% YoY. Source: county tax records.
Cash-flow waterfall
monthlySold comps — $/sqft
last 12 mo · ≤1 miLoading sold comps…