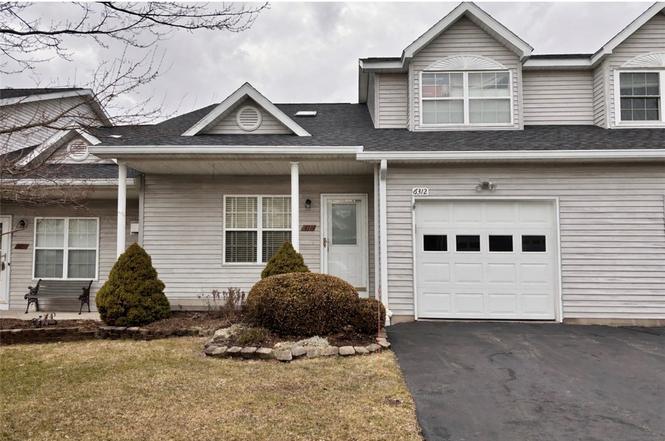
6312 Bentley Dr · Victor, NY
Flood risk 1/10 · Minimal
- FEMA flood zone
- X
- Chance of flooding over 30 yrs
- 0.0%
- Est. flood insurance / yr
- $473 – $860
Fire risk 2/10 · Minimal
- Est. fire insurance / yr
- $691 – $1,283
Heat risk 3/10 · Minor
- Hot days now (above 95°F)
- 7 days/yr
- Hot days in 30 yrs
- 17 days/yr
Wind risk 1/10 · Minimal
- Chance of severe wind over 30 yrs
- —
Air-quality risk 2/10 · Minimal
- Unhealthy air days now
- 0 days/yr
- Unhealthy air days in 30 yrs
- 1 days/yr
Risk factors via First Street. Map © Google.
Why this score? — see what drove the D grade
The composite is a weighted blend of 9 inputs, each scored 0–100. Each bar is that input's sub-score; the figure is the points it added to the 100-point composite (weight × sub-score).
- Cash flow +11.3/30.0
- ARV discount +8.1/15.0
- Schools +5.2/10.0
- 1% rule +4.6/10.0
- Livability +4.0/5.0
- DSCR +3.3/10.0
- Rent growth +2.5/5.0
- Condition / age +2.5/5.0
- Appreciation +0.0/10.0
$254,900
🖨 Deal sheet (PDF) 📄 Offer letter ✓ Due diligence
Listing remarks MLS
What a great space to call home! This exceptional townhouse in popular Victoria woods features a cathdraled 2 story liv rm, formal din rm & eat in oak kit! Bonus loft space - perfect for home office/sitting area, newer wood laminate flrs, updated light & bright interior, thermo windows, C/A & skylights! Plus your own deck area & nicely landscaped yard, cozy front porch, vinyl siding, new roof, garage & parking for 2 vehicles - fabulous!
Key facts
- Cathedral ceilings
- Spacious deck
- Full basement
Tags
Property features AI
Finance
- Financial info: Pets allowed with number limit
- HOA & community: Association: TJMG Properties LLC; Association fee $240 monthly; Association fee includes common area maintenance, common area insurance, insurance, structure maintenance, reserve fund, snow removal, trash
Exterior
- Parking: Attached garage with 1 assigned space; Garage door opener; Two-space designation / assigned parking
- Utilities: Public water connected; Sewer connected; Cable available; High-speed internet available; Circuit breaker electric
- Home design: 2 stories; Resale property; Asphalt roof; Vinyl siding; City street frontage; Rectangular residential lot (approx. 29 x 38)
- Construction: Vinyl siding construction; Asphalt roof; Full basement
- Exterior features: Deck; Open porch
Interior
- Kitchen: Dishwasher; Electric oven; Electric range; Refrigerator; Eat-in kitchen
- Bedrooms: Includes loft (additional living space counted among rooms)
- Flooring: Carpet; Laminate; Vinyl; Varies
- Bathrooms: 1 full bathroom; 1 half bathroom; One main-level bathroom
- Heating & cooling: Gas forced-air heating; Central air conditioning
- Interior features: Ceiling fan(s); Cathedral ceilings; Separate/formal dining room; Eat-in kitchen; Separate/formal living room; Living/dining room; Sliding glass doors; Window treatments; Skylight(s); Drapes; Loft; Basement (full)
- Laundry & utility: Washer; Dryer; Laundry in basement; Gas water heater
Neighborhood map
What this means for you Summary
Snapshot
- This is a 3-bed/1.5-bath townhouse listed at $255k.
Deal economics
- At list price, monthly cash flow is $-95 ($-1k/yr) — negative.
- To cash-flow at today's rent, offer at most $238k (6.6% below list).
- To meet the 1% rule (rent ≥ 1% of price), the offer needs to be $245k (4.1% below list).
- Recommended offer: $238k (6.6% below list) — sets the bar for cash-flow.
- Cap rate 5.8% vs local median 2.6% in Victor — top-decile yield for the area; either an underpriced asset or a hidden risk that comps aren't pricing in. Stress-test before assuming the spread holds.
Location & tenants
- Location reads 79/100 on livability (#122 in NY, #1,991 nationally) — a middle-class / working-renter tenant base. Strengths: employment A+, housing A+, health & safety A+; Watch: amenities F, commute F.
- Victor Central School District (suburban): math 56% / reading 62% proficiency, ranked #222 of 590 in NY (top 38%) — acceptable for families but not a draw, mixed tenant base, ~2y average lease; only 12% free/reduced lunch — higher-income household profile.
- Zoned schools: Victor Primary School (math 46% / reading 60%, grade C, #983 of 2,108 statewide, top 47%, 711 students, 25% FRL); Victor Intermediate School (math 40% / reading 58%, grade C-, #294 of 729 statewide, top 41%, 919 students, 26% FRL); Victor Senior High School (math 98% / reading 72%, grade A, #369 of 1,100 statewide, top 34%, 1,320 students, 26% FRL).
- Market conditions: 109 active listings in the ZIP; 3 comparable units currently listed for rent nearby; rentals leasing fast (median 5d on market — plan ~1-2 weeks tenant-placement turnaround); high-income renter base; 284 units permitted in Ontario County in 2024 (69 in 5+ unit buildings).
Forward outlook
- Local home prices are declining (-3.0%/yr); year-one equity from $2k of loan paydown is wiped out by about $8k of value loss. Plan a longer hold.
- Ontario County population projected to shrink 6% by 2050 — rents likely to lag national; underwrite the cash flow, not the appreciation.
Negotiation context
- It's been on market 53 days — a 3% lower offer ($247k) is reasonable based on typical stale-listing flexibility.
- 2 sale attempts since 16y ago; this cycle's ask has dropped $20k (7%) from the opening price — seller is motivated, your offer sets the floor, not the list.
- Current owner paid $123k; list at $255k implies a 107% gain — meaningful room to come down on a strong offer.
Questions for the listing agent
- What do current leases actually rent for vs. the listed asking? Can we see a recent rent roll and the last 12 months of T-12 income?
- It's been on market 53 days. Have you received any prior offers? Is the seller open to a 7% concession, seller financing, or rate buy-down credit?
- What does the HOA fee cover, when was the last increase, and are there any pending special assessments or reserve-fund shortfalls?
- Is there a deadline driving the sale (1031 exchange, divorce, estate, relocation)? That informs how much negotiation room exists.
- Schools are A-rated — typically a magnet for longer-tenancy family renters. What's the average tenant stay here, and is there a school-zone premium baked into asking?
- The area grade is low — what's the realistic commute time and amenity access for the typical tenant pool here? Any planned neighborhood developments (good or bad) we should know about?
- What's the average days-on-market for RENTAL listings here right now (not sales)? A rising rental-DOM trend means longer vacancies and softer asking-rent achievability than the comps imply.
- What's the recent tenant-quality profile in this submarket — average credit score on applications, eviction rate, late-payment / NSF rate, and stable-employment percentage? A property-management company in the area should have these aggregated.
- How much new for-sale + rental construction is in the pipeline within 1–3 miles? Heavy new supply typically softens prices + rents 12–24 months out; constrained supply supports both.
Investment metrics
- 1% rule
- 0.96% ✗
- Cap rate
- 5.84%
- Cash-on-cash
- -1.61%
- DSCR
- 0.93
- GRM
- 8.7
CMA / ARV
- ARV (on-the-fly)
- $258,434
- Comps found
- 12
Show comp detail 12 sales within ~0.75 mi
| Address | Dist | Beds/Ba | Sqft | Sold | Price | $/sf | Match |
|---|---|---|---|---|---|---|---|
| 6312 Bentley Dr | 0.00mi | 3/1.5 | 1,382 (0%) | 1mo | $230,000 | $166 | 99 |
| 1322 Courtney Dr | 0.05mi | 3/1.5 | 1,370 (-1%) | 3mo | $281,000 | $205 | 94 |
| 6275 Teasel St | 0.16mi | 3/2.0 | 1,425 (+3%) | 1mo | $315,000 | $221 | 84 |
| 6316 Bentley Dr | 0.01mi | 2/1.5 (-1) | 1,440 (+4%) | 4mo | $270,000 | $188 | 84 |
| 6273 Teasel St | 0.17mi | 3/2.5 | 1,425 (+3%) | 1mo | $275,000 | $193 | 83 |
| 6275 Mallard Pt | 0.13mi | 3/2.5 | 1,388 (+0%) | 9mo | $260,000 | $187 | 82 |
| 1162 Hampton Dr | 0.22mi | 2/1.5 (-1) | 1,372 (-1%) | 4mo | $236,000 | $172 | 80 |
| 1155 Cunningham Dr | 0.26mi | 3/2.0 | 1,360 (-2%) | 4mo | $270,000 | $199 | 79 |
| 1182 Cunningham Dr | 0.31mi | 3/1.5 | 1,365 (-1%) | 7mo | $220,500 | $162 | 78 |
| 1128 Cunningham Dr | 0.27mi | 2/1.5 (-1) | 1,372 (-1%) | 6mo | $200,000 | $146 | 76 |
| 1170 Ridge Crest Dr | 0.14mi | 2/2.0 (-1) | 1,343 (-3%) | 8mo | $218,000 | $162 | 75 |
| 6438 Sterling Cir | 0.45mi | 2/1.5 (-1) | 1,300 (-6%) | 0mo | $235,000 | $181 | 64 |
Match score weights: distance 35% · size 25% · config 20% · recency 20%. Top-matched comps best support the ARV.
Projected returns pro-forma
-3.0% appreciation · 3.0% rent growth · sell at horizon
- IRR
- -18.8%
- Equity multiple
- 0.34×
- Total profit
- $-47,186
- Equity at exit
- $38,006
- IRR
- -11.2%
- Equity multiple
- 0.33×
- Total profit
- $-48,106
- Equity at exit
- $22,039
Cash invested: $71,372 (down + closing). Projections, not guarantees.
Landlord ↔ Tenant lean methodology
- Overall (STATE)
- 15 Strongly Tenant-Friendly
- State New York
- 15 Strongly Tenant-Friendly · D+10
- County
- — inherits STATE
- City
- — inherits STATE
ZIP-level market 14564
- Home prices YoY
- -12.8%
- Active inventory
- 109
- Price-to-rent
- 8.7×
Monthly cashflow live
- Estimated rent
- $2,445 medium interval (Pro) →
- Mortgage (P&I)
- −$1,337
- Tax from tax record
- −$344 /mo · $4,130/yr
- Insurance
- −$106
- HOA
- −$240
- Lot rent
- −$0
- Vacancy / Maint / Mgmt
- −$513
- Net cashflow
- $-95
Break-even live
Sensitivity live
| Price | -10% $49 | -5% $-23 | +0% $-95 | +5% $-168 | +10% $-240 |
|---|---|---|---|---|---|
| Rent | -10% $-289 | -5% $-192 | +0% $-95 | +5% $1 | +10% $98 |
| Rate | -1.0pp $33 | -0.5pp $-31 | base $-95 | +0.5pp $-162 | +1.0pp $-229 |
UW: 25.0% down · 7.5% · 30yr · 1.5% tax · 5.0% vac · 8.0% maint · 8.0% mgmt
Financing live
Cash to close
- Down payment
- $63,725
- Closing costs
- $7,647
- Reserves months
- —
- Total cash needed
- —
Loan-product check · same deal, 3 products live
Conventional
25% down · 7.5% · 30yr
- Down + closing
- —
- Monthly P&I
- —
- Monthly cashflow
- —
- DSCR
- —
- Eligible?
- —
Personal DTI + credit; lowest rate.
DSCR
20% down · 8.5% · 30yr
- Down + closing
- —
- Monthly P&I
- —
- Monthly cashflow
- —
- DSCR
- —
- Eligible?
- —
No personal income docs; deal must DSCR.
Hard money
10% down · 12.0% · 12mo
- Down + closing
- —
- Monthly P&I
- —
- Monthly cashflow
- —
- DSCR
- —
- Eligible?
- —
Short-term bridge; refi at stabilization.
Rent comps 3 comps
| Address | Beds | Baths | Sqft | Rent | $/sqft | DOM | Units | Dist |
|---|---|---|---|---|---|---|---|---|
| 6316 Bentley Dr Victor, NY | 2.0 | 1.5 | 1500 | $2,400 | $1.60 | 25d | 1 | 0.03mi |
| 6141 Cedar Creek Way Farmington, NY | 1.0–3.0 | 1.0–2.0 | 1272 | $2,375 | $1.87 | 5d | 17 | 0.70mi |
| 1188 Barry Pl Farmington, NY | 1.0–3.0 | 1.0–2.5 | 1072 | $2,675 | $2.50 | 5d | 12 | 1.43mi |
HOA detail
- Monthly dues
- $240 · $2,880/yr
Listing history 10 events
-
2026-04-29status Pending
-
2026-04-14historical Active Under Contract
-
2026-03-31price $254,900
-
2026-03-17price $264,900
-
2026-03-06$274,900 Active
-
2010-09-01soldstatus $123,000 470-char remark
Show marketing remark (470 chars)
What a great space to call home! This exceptional townhouse in popular Victoria woods features a cathdraled 2 story liv rm, formal din rm & eat in oak kit! Bonus loft space - perfect for home office/sitting area, newer wood laminate flrs, updated light & bright interior, thermo windows, C/A & skylights! Plus your own deck area & nicely landscaped yard, cozy front porch, vinyl siding, new roof, garage & parking for 2 vehicles - fabulous!
-
2010-08-31soldstatus $123,000
-
2010-06-02$124,900 470-char remark
Show marketing remark (470 chars)
What a great space to call home! This exceptional townhouse in popular Victoria woods features a cathdraled 2 story liv rm, formal din rm & eat in oak kit! Bonus loft space - perfect for home office/sitting area, newer wood laminate flrs, updated light & bright interior, thermo windows, C/A & skylights! Plus your own deck area & nicely landscaped yard, cozy front porch, vinyl siding, new roof, garage & parking for 2 vehicles - fabulous!
-
2003-10-10soldstatus $103,000
-
2000-10-31soldstatus $88,750
ⓘ Source: listings_history table (triggers on properties + properties_extension) + one-shot
backfill from property_details.listing_events for pre-trigger history.
Tax reassessment forecast NY · Partial reset (capped growth)
- Current annual tax
- $4,130 · $344/mo
- Projected year-2 tax
- $4,219 · $352/mo
- Expected delta
- +$89/yr (+$7/mo · 2.2%)
ⓘ Screening estimate from a state-policy table — verify with the county assessor before closing.
Climate risk First Street
- Flood 1/10 Low FEMA zone X · 0% chance over 30 yrs
- Wildfire 2/10 Low
- Heat 3/10 Moderate 7 d/yr ≥95°F today · 17 d/yr by 30 yrs out
- Wind 1/10 Low
- Air quality 2/10 Low 0 unhealthy d/yr today · 1 by 30 yrs out
Nearby sold comps map
Loading sold comps map…
Walkable amenities ~0.75 mi
Loading nearby amenities…
Taxation est. · year 1
- Rental income
- $29,341
- − Mortgage interest
- −$14,278
- − Property taxes
- −$4,130
- − Insurance
- −$1,274
- − Repairs & maintenance
- −$2,347
- − Management
- −$2,347
- − HOA
- −$2,880
- − Depreciation
- −$7,415
- Taxable loss
- −$5,332
- Est. tax savings @ 24.0%
- +$1,280
- After-tax cash flow
- $134/yr
For passive investors: Depreciation is non-cash, so a rental often shows a tax loss while cash-flowing — sheltering income. Rental losses are passive: they offset passive income freely, and up to $25,000/yr can offset ordinary (W-2) income if you actively participate and your MAGI is under $100k (phasing out to $0 by $150k); unused losses carry forward. On sale, claimed depreciation is recaptured at up to 25%, and gains may owe capital-gains tax (a 1031 exchange can defer both). Figures are a year-1 estimate at your 24.0% rate — not tax advice; consult a CPA.
Schools (NCES district)
- District
- Victor Central School District
- NCES district ID
- 3629640
- Math proficiency
- 56% ▼ -18.00%
- Reading proficiency
- 62% ▲ 3.00%
- Median HH income
- $73,046
- Composite
- 52.43/100
- National rank
- #1575
- State rank
- #222 of 590 in NY
Livability — Victor
- Score
- 79/100
- State rank
- #122
- US rank
- #1991
Category grades
Schools grade is shown separately in the Schools card above.
Census & demographics
- County
- Ontario County · 58,989 people
- City population
- 16,364
- Metro
- Rochester, NY
- Population (ZIP)
- 16,364
- Household income
- $115,625
- Rent vs Own
- Severe rent burden
- 357.0
Population outlook (Ontario County) Hauer SSP2
- Today (2025)
- 111,230 people
- By 2030
- 111,401 · +0.2%
- By 2040
- 109,535 · -1.5%
- By 2050
- 104,895 · -5.7%
- By 2075
- 92,999 · -16.4%
- By 2100
- 73,723 · -33.7%
Race, ethnicity, and origin ACS 2023
- Neighborhood character
- Predominantly White (89%)
- Race & ethnicity
- White 89% Two or more races 4% Hispanic / Latino 4% Asian 4% Black 1%
- Common ancestry
- Romanian 6% Iranian 3% Lithuanian 2%
- Foreign-born
- 7% · South Korea, Canada
- Languages at home
- 92% English-only · Other Indo-European 4% Spanish 1% German/W. Germanic 1%
Political lean MEDSL · Ontario
- 2024 margin
- Toss-up / Even · D 49.4% · R 50.6%
- 2008→2024 swing
- -1.0pp toward R · 2008: -0.1pp · 2024: -1.2pp
- All cycles
- 2024: R+1.2 2020: R+0.0 2016: R+8.6 2012: R+1.6 2008: R+0.1
Not yet ingested
- Civics
- —
Market trends
- HPI YoY
- ▼ -40.90%
- Current HPI
- 279.9821
- Rent YoY
- —
- Metro
- Rochester, NY
- State GDP YoY
- ▲ 2.60%
- F500 in state
- 92
Industry mix (Fortune 500 HQ in NY)
| Industry | F500 HQs | Revenue |
|---|---|---|
| Financial Services | 10 | $950B |
|
||
| Consumer Goods | 9 | $162B |
|
||
| Insurance | 4 | $225B |
|
||
| Telecommunications | 2 | $144B |
|
||
| Pharmaceuticals | 2 | $112B |
|
||
| Media / Entertainment | 2 | $69B |
|
||
Price history
+187.2% since first listed10 events — show timeline
- 2026-04-29 Pending — UNYREIS
- 2026-04-14 Contingent — UNYREIS
- 2026-03-31 Price Changed $254,900 UNYREIS
- 2026-03-17 Price Changed $264,900 UNYREIS
- 2026-03-06 Listed $274,900 UNYREIS
- 2010-09-01 Sold (MLS) $123,000 UNYREIS
- 2010-08-31 Sold (Public Records) $123,000 Public Records
- 2010-06-02 Listed $124,900 UNYREIS
- 2003-10-10 Sold (Public Records) $103,000 Public Records
- 2000-10-31 Sold (Public Records) $88,750 Public Records
Property tax history
+4.3%/yrLatest (2025): $4,130 · -0.7% YoY. Source: county tax records.
Cash-flow waterfall
monthlySold comps — $/sqft
last 12 mo · ≤1 miLoading sold comps…