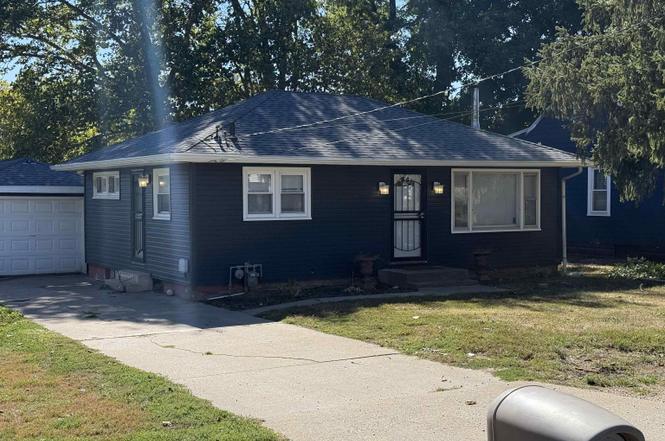
3410 W Lincoln Ave · Bellevue, IL
Flood risk 1/10 · Minimal
- FEMA flood zone
- X
- Chance of flooding over 30 yrs
- 0.0%
- Est. flood insurance / yr
- $473 – $860
Fire risk 1/10 · Minimal
- Est. fire insurance / yr
- $804 – $1,492
Heat risk 3/10 · Minor
- Hot days now (above 105°F)
- 7 days/yr
- Hot days in 30 yrs
- 18 days/yr
Wind risk 2/10 · Minimal
- Chance of severe wind over 30 yrs
- 1.0%
Air-quality risk 3/10 · Minor
- Unhealthy air days now
- 1 days/yr
- Unhealthy air days in 30 yrs
- 3 days/yr
Risk factors via First Street. Map © Google.
Why this score? — see what drove the C- grade
The composite is a weighted blend of 9 inputs, each scored 0–100. Each bar is that input's sub-score; the figure is the points it added to the 100-point composite (weight × sub-score).
- Cash flow +19.0/30.0
- ARV discount +7.5/15.0
- 1% rule +6.6/10.0
- DSCR +6.0/10.0
- Livability +3.2/5.0
- Rent growth +3.1/5.0
- Schools +2.9/10.0
- Condition / age +2.5/5.0
- Appreciation +0.0/10.0
$84,000
🖨 Deal sheet 📄 Offer letter ✓ Due diligence
Listing remarks MLS
MOVE RIGHT INTO THIS SHARP, SHARP RANCH IN QUIET NEIGHBORHOOD CLOSE TO SHOPPING, GOLFING AND ALL YOUR NEEDS. LIMESTONE SCHOOL. MANY UPDATES INCLUDE ROOF, FURNACE, CENTRAL AIR, LOWER LEVEL AND SOME HARDWOOD FLOORS. THIS IS ONE YOU DON'T WANT TO MISS!
Key facts
- Roof
- Fenced yard
- Vinyl siding
Tags
Property features AI
Finance
- Other: Green / energy efficient features include high-efficiency water heater
Exterior
- Parking: Detached 1-car garage; On-street parking; Gravel and paved parking surfaces
- Utilities: Public water; Public sewer; High-efficiency water heater
- Home design: Single-family residence; Built in 1955; Shoff subdivision; Residential zoning
- Construction: Shingle roof; Not new construction; Full finished basement
- Exterior features: Fenced yard; Level lot; Deck; Patio; Paved road access
Interior
- Kitchen: Microwave; Refrigerator
- Bedrooms: 2 bedrooms (both on main level)
- Flooring: Laminate flooring in main-level living areas and bedrooms; Vinyl flooring in the basement; Other flooring in basement laundry/utility
- Bathrooms: 1 full bathroom
- Heating & cooling: Forced air heating; Central air conditioning; High-efficiency heating and high-efficiency air conditioning
- Interior features: Cable available; Ceiling fan(s); High-speed internet
- Laundry & utility: Washer; Dryer; Finished full basement with laundry area
Neighborhood map
What this means for you Summary
Snapshot
- This is a 2-bed/1.0-bath single-family listed at $84k.
Deal economics
- At list price, monthly cash flow is $87 ($1k/yr) — positive.
- The deal already cash-flows at list — no discount required.
- Meets the 1% rule at list price ($977 rent vs $84k).
- Recommended offer: $74k (12.0% below list) — sets the bar for market timing.
Location & tenants
- Location reads 65/100 on livability (#601 in IL) — a middle-class / working-renter tenant base. Strengths: crime A+, cost of living A+, housing A+; Watch: employment C-, amenities F, commute F.
- Limestone Chsd 310 (rural): math 25% / reading 35% proficiency, ranked #486 of 919 in IL (top 53%) — families likely to look elsewhere, expect single-tenant / working-renter base with shorter leases.
- Zoned schools: Limestone Community High School (math 17% / reading 22%, grade F, #397 of 693 statewide, top 61%, 924 students, 0% FRL).
- Market conditions: Rents rising (+2.3%/yr); 180 active listings in the ZIP; 14 comparable units currently listed for rent nearby; rentals at typical pace (median 21d on market — plan ~3-4 weeks tenant-placement turnaround); 73 units permitted in Peoria County in 2024 (0 in 5+ unit buildings).
Forward outlook
- Local home prices are declining (-3.0%/yr); year-one equity from $581 of loan paydown is wiped out by about $3k of value loss. Plan a longer hold.
- Peoria County population projected at -11% by 2050 — secular population decline; favor cash flow + early exit over multi-decade hold.
Negotiation context
- It's been on market 253 days — a 12% lower offer ($74k) is reasonable based on typical stale-listing flexibility.
- 2 sale attempts since 20y ago; this cycle's ask has dropped $21k (20%) from the opening price — seller is motivated, your offer sets the floor, not the list.
Risks & watch-outs
- Watch-outs: property tax is 3.0% of price; built in 1955 — expect roof / HVAC / electrical / plumbing capex.
Questions for the listing agent
- It's been on market 253 days. Have you received any prior offers? Is the seller open to a 12% concession, seller financing, or rate buy-down credit?
- Built in 1955 — when were the roof, HVAC, electrical panel, plumbing, and water heater last replaced?
- Property tax is high relative to price — has the assessment been appealed recently, and will the sale trigger a re-assessment?
- Why hasn't it sold? Are there any deal-killer items the seller is aware of (foundation, flood, title, zoning, code violations)?
- Is there a deadline driving the sale (1031 exchange, divorce, estate, relocation)? That informs how much negotiation room exists.
- Schools are D-rated, which usually means shorter tenancies and higher turnover. Who's the typical renter profile here, and what's been the actual vacancy rate?
- What's the average days-on-market for RENTAL listings here right now (not sales)? A rising rental-DOM trend means longer vacancies and softer asking-rent achievability than the comps imply.
- What's the recent tenant-quality profile in this submarket — average credit score on applications, eviction rate, late-payment / NSF rate, and stable-employment percentage? A property-management company in the area should have these aggregated.
- How much new for-sale + rental construction is in the pipeline within 1–3 miles? Heavy new supply typically softens prices + rents 12–24 months out; constrained supply supports both.
Investment metrics
- 1% rule
- 1.16% ✓
- Cap rate
- 7.54%
- Cash-on-cash
- 4.45%
- DSCR
- 1.20
- GRM
- 7.2
CMA / ARV
- ARV (on-the-fly)
- $32,256
- Comps found
- 12
Show comp detail 12 sales within ~0.75 mi
| Address | Dist | Beds/Ba | Sqft | Sold | Price | $/sf | Match |
|---|---|---|---|---|---|---|---|
| 3203 W Proctor Pl | 0.27mi | 2/1.0 | 793 (+3%) | 6mo | $33,500 | $42 | 77 |
| 3214 W Proctor Pl | 0.25mi | 2/1.0 | 720 (-6%) | 5mo | $37,000 | $51 | 74 |
| 2725 W Lincoln Ave | 0.58mi | 2/1.0 | 770 (+0%) | 2mo | $32,100 | $42 | 71 |
| 3024 W Wiswall St | 0.35mi | 2/1.0 | 796 (+4%) | 20mo | $27,500 | $35 | 61 |
| 3000 Wiswall St | 0.40mi | 2/1.0 | 676 (-12%) | 1mo | $32,000 | $47 | 60 |
| 3207 W Latrobe St | 0.56mi | 2/1.0 | 764 (-0%) | 16mo | $20,000 | $26 | 60 |
| 853 S Kim Moor Ave | 0.61mi | 2/1.0 | 696 (-9%) | 8mo | $25,000 | $36 | 49 |
| 2813 W Marquette St | 0.60mi | 1/1.0 (-1) | 850 (+11%) | 1mo | $20,000 | $24 | 48 |
| 3019 Proctor St | 0.38mi | 2/1.0 | 676 (-12%) | 22mo | $30,000 | $44 | 44 |
| 3012 W Proctor St | 0.40mi | 2/1.0 | 676 (-12%) | 21mo | $68,000 | $101 | 44 |
| 3000 W Starr St | 0.63mi | 2/2.0 | 864 (+12%) | 22mo | $23,500 | $27 | 28 |
| 2710 W Antoinette St | 0.66mi | 1/1.0 (-1) | 664 (-14%) | 21mo | $21,000 | $32 | 24 |
Match score weights: distance 35% · size 25% · config 20% · recency 20%. Top-matched comps best support the ARV.
Projected returns pro-forma
-3.0% appreciation · 2.3% rent growth · sell at horizon
- IRR
- -10.2%
- Equity multiple
- 0.63×
- Total profit
- $-8,665
- Equity at exit
- $12,525
- IRR
- -1.8%
- Equity multiple
- 0.88×
- Total profit
- $-2,843
- Equity at exit
- $7,263
Cash invested: $23,520 (down + closing). Projections, not guarantees.
Landlord ↔ Tenant lean methodology
- Overall (STATE)
- 43 Moderately Tenant-Leaning
- State Illinois
- 43 Moderately Tenant-Leaning · D+7
- County
- — inherits STATE
- City
- — inherits STATE
ZIP-level market 61604
- Home prices YoY
- -24.6%
- Rents YoY
- 2.3%
- Active inventory
- 180
- Price-to-rent
- 7.2×
Monthly cashflow live
- Estimated rent
- $977 high interval (Pro) →
- Mortgage (P&I)
- −$441
- Tax from tax record
- −$209 /mo · $2,511/yr
- Insurance
- −$35
- HOA
- −$0
- Vacancy / Maint / Mgmt
- −$205
- Net cashflow
- $87
Break-even live
UW: 25.0% down · 7.5% · 30yr · 1.5% tax · 5.0% vac · 8.0% maint · 8.0% mgmt
Financing live
Cash to close
- Down payment
- $21,000
- Closing costs
- $2,520
- Reserves months
- —
- Total cash needed
- —
Loan-product check · same deal, 3 products live
Conventional
25% down · 7.5% · 30yr
- Down + closing
- —
- Monthly P&I
- —
- Monthly cashflow
- —
- DSCR
- —
- Eligible?
- —
Personal DTI + credit; lowest rate.
DSCR
20% down · 8.5% · 30yr
- Down + closing
- —
- Monthly P&I
- —
- Monthly cashflow
- —
- DSCR
- —
- Eligible?
- —
No personal income docs; deal must DSCR.
Hard money
10% down · 12.0% · 12mo
- Down + closing
- —
- Monthly P&I
- —
- Monthly cashflow
- —
- DSCR
- —
- Eligible?
- —
Short-term bridge; refi at stabilization.
Rent comps 14 comps
| Address | Beds | Baths | Sqft | Rent | $/sqft | DOM | Units | Dist |
|---|---|---|---|---|---|---|---|---|
| 906 S Tonti Cir Peoria, IL | 2.0 | 1.0 | 780 | $950 | $1.22 | 13d | 1 | 0.31mi |
| 3031 W Wiswall St Peoria, IL | 2.0 | 1.0 | 1100 | $1,100 | $1.00 | 13d | 1 | 0.34mi |
| 3001 W Wiswall St Peoria, IL | 2.0 | 1.0 | 1000 | $1,100 | $1.10 | 13d | 1 | 0.42mi |
| 2822 W Antoinette St Peoria, IL | 2.0 | 1.0 | 720 | $1,149 | $1.60 | 21d | 1 | 0.58mi |
| 2804 W Humboldt St Peoria, IL | 3.0 | 1.0 | 1060 | $995 | $0.94 | 13d | 1 | 0.83mi |
| 2317 W Martin Luther King Junior Dr Unit 2-214 Peoria, IL | 2.0 | 1.0 | 807 | $800 | $0.99 | 44d | 1 | 0.97mi |
| 2317 W Martin Luther King Junior Dr Peoria, IL | 1.0–2.0 | 1.0 | 697 | $800 | $1.15 | 13d | 3 | 0.97mi |
| 2317 W Martin Luther King Junior Dr Unit 1-106 Peoria, IL | 1.0 | 1.0 | 588 | $775 | $1.32 | 44d | 1 | 0.97mi |
| 1825 S Kneer Ave Peoria, IL | 2.0 | 1.0 | 858 | $858 | $1.00 | 13d | 1 | 0.99mi |
| 2320 W Garden St Peoria, IL | 2.0 | 1.0 | 1096 | $1,000 | $0.91 | 44d | 1 | 1.01mi |
| 2116 W Proctor St Peoria, IL | 2.0 | 1.0 | 912 | $879 | $0.96 | 13d | 1 | 1.11mi |
| 2916 W Meidroth St Peoria, IL | 2.0 | 1.0 | 1125 | $1,049 | $0.93 | 21d | 1 | 1.19mi |
| 1507 S Livingston St Peoria, IL | 2.0 | 1.0 | 842 | $946 | $1.12 | 44d | 1 | 1.21mi |
| 2807 W Nevada St Peoria, IL | 1.0 | 1.0 | 540 | $629 | $1.16 | 21d | 1 | 1.43mi |
Listing history 24 events
-
2026-06-19days on market $84,000 Active 253 DOM
-
2026-06-18days on market $84,000 Active 252 DOM
-
2026-06-17days on market $84,000 Active 251 DOM
-
2026-06-16days on market $84,000 Active 250 DOM
-
2026-06-15days on market $84,000 Active 249 DOM
-
2026-06-14days on market $84,000 Active 247 DOM
-
2026-06-13days on market $84,000 Active 246 DOM
-
2026-06-10days on market $84,000 Active 244 DOM
-
2026-06-09days on market $84,000 Active 243 DOM
-
2026-06-08days on market $84,000 Active 242 DOM
-
2026-06-07days on market $84,000 Active 241 DOM
-
2026-06-03days on market $84,000 Active 237 DOM
-
2026-06-02days on market $84,000 Active 236 DOM
-
2026-06-01days on market $84,000 Active 235 DOM
-
2026-05-31days on market $84,000 Active 234 DOM
-
2026-05-30days on market $84,000 Active 233 DOM
-
2026-05-07price $84,000
-
2026-03-10price $88,500
-
2025-11-24price $94,900
-
2025-10-20price $99,900
-
2025-10-08$105,000 Active
-
2006-07-31soldstatus $85,000
-
2006-07-27soldstatus $84,900 249-char remark
Show marketing remark (249 chars)
MOVE RIGHT INTO THIS SHARP, SHARP RANCH IN QUIET NEIGHBORHOOD CLOSE TO SHOPPING, GOLFING AND ALL YOUR NEEDS. LIMESTONE SCHOOL. MANY UPDATES INCLUDE ROOF, FURNACE, CENTRAL AIR, LOWER LEVEL AND SOME HARDWOOD FLOORS. THIS IS ONE YOU DON'T WANT TO MISS!
-
2006-03-31$84,900 249-char remark
Show marketing remark (249 chars)
MOVE RIGHT INTO THIS SHARP, SHARP RANCH IN QUIET NEIGHBORHOOD CLOSE TO SHOPPING, GOLFING AND ALL YOUR NEEDS. LIMESTONE SCHOOL. MANY UPDATES INCLUDE ROOF, FURNACE, CENTRAL AIR, LOWER LEVEL AND SOME HARDWOOD FLOORS. THIS IS ONE YOU DON'T WANT TO MISS!
ⓘ Source: listings_history table (triggers on properties + properties_extension) + one-shot
backfill from property_details.listing_events for pre-trigger history.
Tax reassessment forecast IL · Partial reset (capped growth)
- Current annual tax
- $2,511 · $209/mo
- Projected year-2 tax
- $2,511 · $209/mo
- Expected delta
- $0/yr ($0/mo · 0.0%)
ⓘ Screening estimate from a state-policy table — verify with the county assessor before closing.
Climate risk First Street
- Flood 1/10 Low FEMA zone X · 0% chance over 30 yrs
- Wildfire 1/10 Low
- Heat 3/10 Moderate 7 d/yr ≥105°F today · 18 d/yr by 30 yrs out
- Wind 2/10 Low 100% chance of damaging wind over 30 yrs
- Air quality 3/10 Moderate 1 unhealthy d/yr today · 3 by 30 yrs out
Nearby sold comps map
Loading sold comps map…
Walkable amenities ~0.75 mi
Loading nearby amenities…
Taxation est. · year 1
- Rental income
- $11,726
- − Mortgage interest
- −$4,705
- − Property taxes
- −$2,511
- − Insurance
- −$420
- − Repairs & maintenance
- −$938
- − Management
- −$938
- − Depreciation
- −$2,444
- Taxable loss
- −$231
- Est. tax savings @ 24.0%
- +$55
- After-tax cash flow
- $1,101/yr
For passive investors: Depreciation is non-cash, so a rental often shows a tax loss while cash-flowing — sheltering income. Rental losses are passive: they offset passive income freely, and up to $25,000/yr can offset ordinary (W-2) income if you actively participate and your MAGI is under $100k (phasing out to $0 by $150k); unused losses carry forward. On sale, claimed depreciation is recaptured at up to 25%, and gains may owe capital-gains tax (a 1031 exchange can defer both). Figures are a year-1 estimate at your 24.0% rate — not tax advice; consult a CPA.
Schools (NCES district)
- District
- Limestone Chsd 310
- NCES district ID
- 1722950
- Math proficiency
- 25% ▲ 5.00%
- Reading proficiency
- 35% ▲ 4.00%
- Median HH income
- $49,759
- Composite
- 28.99/100
- National rank
- #11932
- State rank
- #486 of 919 in IL
Livability — Bellevue
- Score
- 65/100
- State rank
- #601
- US rank
- #12423
Category grades
Schools grade is shown separately in the Schools card above.
Census & demographics
- County
- Peoria County · 120,495 people
- Metro
- Peoria, IL
- Population (ZIP)
- 28,313
- Household income
- $52,414
- Rent vs Own
- Severe rent burden
- 815.0
Population outlook (Peoria County) Hauer SSP2
- Today (2025)
- 183,007 people
- By 2030
- 179,643 · -1.8%
- By 2040
- 171,782 · -6.1%
- By 2050
- 163,508 · -10.7%
- By 2075
- 140,178 · -23.4%
- By 2100
- 114,493 · -37.4%
Race, ethnicity, and origin ACS 2023
- Neighborhood character
- Diverse neighborhood (Simpson 0.61)
- Race & ethnicity
- White 55% Black 29% Two or more races 10% Hispanic / Latino 7% Asian 2%
- Hispanic origin (detail)
- Mexican 5%
- Common ancestry
- Italian 2% Slovak 1% Iranian 1%
- Foreign-born
- 6% · Canada, China
- Languages at home
- 92% English-only · Spanish 4% Chinese 1% French/Haitian/Cajun 1%
Political lean MEDSL · Peoria
- 2024 margin
- Toss-up / Even · D 51.5% · R 46.9% · Other 1.6%
- 2008→2024 swing
- -9.2pp toward R · 2008: 13.9pp · 2024: 4.7pp
- All cycles
- 2024: D+4.7 2020: D+6.3 2016: D+2.8 2012: D+4.4 2008: D+13.9
Not yet ingested
- Civics
- —
Market trends
- HPI YoY
- ▼ -54.15%
- Current HPI
- 165.8838
- Rent YoY
- ▲ 2.30%
- Metro
- Peoria, IL
- State GDP YoY
- ▲ 1.59%
- F500 in state
- 60
Industry mix (Fortune 500 HQ in IL)
| Industry | F500 HQs | Revenue |
|---|---|---|
| Insurance | 4 | $201B |
|
||
| Consumer Goods | 4 | $87B |
|
||
| Industrial Machinery | 3 | $64B |
|
||
| Healthcare | 2 | $55B |
|
||
| Retail / Pharmacy | 1 | $148B |
|
||
| Agriculture / Food | 1 | $86B |
|
||
Price history
-1.1% since first listed8 events — show timeline
- 2026-05-07 Price Changed $84,000 RMLSA as Distributed by MLS Grid
- 2026-03-10 Price Changed $88,500 RMLSA as Distributed by MLS Grid
- 2025-11-24 Price Changed $94,900 RMLSA as Distributed by MLS Grid
- 2025-10-20 Price Changed $99,900 RMLSA as Distributed by MLS Grid
- 2025-10-08 Listed $105,000 RMLSA as Distributed by MLS Grid
- 2006-07-31 Sold (Public Records) $85,000 Public Records
- 2006-07-27 Sold (MLS) $84,900 RMLSA as Distributed by MLS Grid
- 2006-03-31 Listed $84,900 RMLSA as Distributed by MLS Grid
Property tax history
+3.0%/yrLatest (2024): $2,511 · +6.9% YoY. Source: county tax records.
Cash-flow waterfall
monthlySold comps — $/sqft
last 12 mo · ≤1 miLoading sold comps…