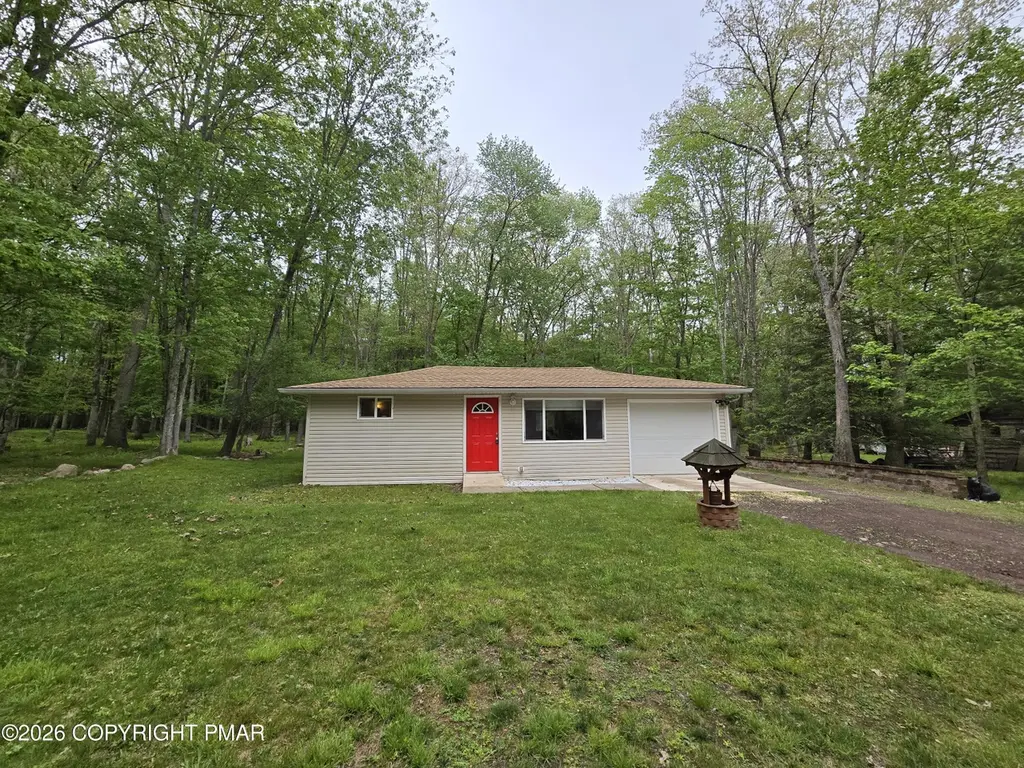
27 Deer Cross Rd · Hickory Hills, PA
Flood risk 1/10 · Minimal
- FEMA flood zone
- X (unshaded)
- Chance of flooding over 30 yrs
- 0.0%
- Est. flood insurance / yr
- $507 – $1,088
Fire risk 2/10 · Minimal
- Est. fire insurance / yr
- $511 – $949
Heat risk 2/10 · Minimal
- Hot days now (above 91°F)
- 7 days/yr
- Hot days in 30 yrs
- 16 days/yr
Wind risk 4/10 · Minor
- Chance of severe wind over 30 yrs
- 7.0%
Air-quality risk 2/10 · Minimal
- Unhealthy air days now
- 1 days/yr
- Unhealthy air days in 30 yrs
- 2 days/yr
Risk factors via First Street. Map © Google.
Why this score? — see what drove the D+ grade
The composite is a weighted blend of 9 inputs, each scored 0–100. Each bar is that input's sub-score; the figure is the points it added to the 100-point composite (weight × sub-score).
- Cash flow +15.5/30.0
- Appreciation +10.0/10.0
- ARV discount +5.4/15.0
- DSCR +4.8/10.0
- 1% rule +4.0/10.0
- Livability +2.9/5.0
- Rent growth +2.5/5.0
- Condition / age +2.5/5.0
- Schools +2.0/10.0
$156,000
🖨 Deal sheet 📄 Offer letter ✓ Due diligence
Listing remarks
Beautifully maintained ranch home offering comfortable one-floor living in Hickory Hills! This charming home features 2 bedrooms, 1 full bathroom with a laundry area, and a 1-car garage. The roof was replaced just 2 years ago, providing added peace of mind for the next owner. Enjoy a half acre of beautiful front and rear yards with plenty of space for relaxing, gardening, or entertaining. Additional storage sheds offer extra room for tools, outdoor equipment, and hobbies. Seller is highly motivated due to relocation - making this a wonderful opportunity to own a move-in ready home! Hickory Hills amenities include a lake, picnic pavilion, clubhouse, outdoor pool, playground, and basketball c
Key facts
- Outdoor pool
- Basketball court
- Half acre yard
Tags
Property features AI
Finance
- Other: Subdivision: Hickory Hills (Foster Twp)
- HOA & community: Homeowners association with annual fee (clubhouse, playground, basketball court, pool); Association fee includes trash and security
Exterior
- Parking: Attached garage (1 car); Off-street driveway parking; 4 open parking spaces
- Security: Smoke detector(s)
- Utilities: Well water; Septic tank; 200+ amp electrical service
- Home design: Single family residence; House
- Construction: Vinyl siding; Asphalt/fiberglass shingle roof; Crawl space with sump pump
- Exterior features: Level lot; Gravel road frontage on a private road; Private road with road maintenance agreement; Shed(s)
Interior
- Kitchen: Electric range; Refrigerator; Microwave
- Flooring: Carpet; Laminate
- Bathrooms: 1 full bathroom
- Heating & cooling: Baseboard heating (electric); Ceiling fan(s)
- Interior features: Eat-in kitchen; Insulated windows; Furnished
- Laundry & utility: Washer; Dryer; Washer hookup; Electric dryer hookup; Laundry located in bathroom
Neighborhood map
What this means for you Summary
Snapshot
- This is a 2-bed/1.0-bath single-family listed at $156k.
Deal economics
- At list price, monthly cash flow is $64 ($766/yr) — positive.
- The deal already cash-flows at list — no discount required.
- To meet the 1% rule (rent ≥ 1% of price), the offer needs to be $140k (10.3% below list).
- Recommended offer: $140k (10.3% below list) — sets the bar for 1% rule.
Location & tenants
- Location reads 57/100 on livability (#1,624 in PA) — a working-class tenant base; expect higher turnover. Strengths: cost of living A+, housing B; Watch: schools F, amenities F, commute F.
- Hazleton Area SD (suburban): math 18% / reading 30% proficiency, ranked #476 of 539 in PA (top 88%) — low school quality limits family demand, transient renter base, plan for 1-2y turnover.
- Market conditions: 70 active listings in the ZIP; 1 comparable units currently listed for rent nearby; 349 units permitted in Luzerne County in 2024 (16 in 5+ unit buildings).
Forward outlook
- In year one you build about $17k of equity ($1k loan paydown + $16k appreciation (10.0% local appreciation)).
- Luzerne County population projected at +4% by 2050 — modest demand growth; plan on rents tracking national, not racing it.
- At projected returns (10.0% appreciation + 3.0% rent growth), your $44k cash investment doubles in ~3 years — after that, you're playing with house money.
- By year 3, paydown + projected appreciation supports a ~$42k cash-out refi (75% LTV) — recoverable capital for the next deal without selling this one.
Negotiation context
- Only 4 days on market — expect competitive offers; lowballing is unlikely to land.
- 4 sale attempts since 23y ago with the ask held roughly flat each time — persistent listings suggest the price (not the market) is what's stuck; bring a comps-based counter.
- Current owner paid $70k; list at $156k implies a 123% gain — meaningful room to come down on a strong offer.
Questions for the listing agent
- What does the HOA fee cover, when was the last increase, and are there any pending special assessments or reserve-fund shortfalls?
- Is there a deadline driving the sale (1031 exchange, divorce, estate, relocation)? That informs how much negotiation room exists.
- Schools are F-rated, which usually means shorter tenancies and higher turnover. Who's the typical renter profile here, and what's been the actual vacancy rate?
- The area grade is low — what's the realistic commute time and amenity access for the typical tenant pool here? Any planned neighborhood developments (good or bad) we should know about?
- What's the average days-on-market for RENTAL listings here right now (not sales)? A rising rental-DOM trend means longer vacancies and softer asking-rent achievability than the comps imply.
- What's the recent tenant-quality profile in this submarket — average credit score on applications, eviction rate, late-payment / NSF rate, and stable-employment percentage? A property-management company in the area should have these aggregated.
- How much new for-sale + rental construction is in the pipeline within 1–3 miles? Heavy new supply typically softens prices + rents 12–24 months out; constrained supply supports both.
Investment metrics
- 1% rule
- 0.90% ✗
- Cap rate
- 6.78%
- Cash-on-cash
- 1.75%
- DSCR
- 1.08
- GRM
- 9.3
CMA / ARV
- ARV (on-the-fly)
- $148,960
- Comps found
- 7
Show comp detail 7 sales within ~0.75 mi
| Address | Dist | Beds/Ba | Sqft | Sold | Price | $/sf | Match |
|---|---|---|---|---|---|---|---|
| 78 Lake Dr | 0.12mi | 3/1.5 (+1) | 800 (+5%) | 14mo | $169,000 | $211 | 67 |
| 57 Sunshine Dr | 0.56mi | 2/1.0 | 750 (-1%) | 7mo | $152,000 | $203 | 66 |
| 17 Brookside Dr | 0.25mi | 2/1.5 | 800 (+5%) | 24mo | $136,000 | $170 | 57 |
| 1269 Woodhaven Dr | 0.46mi | 2/1.0 | 720 (-5%) | 22mo | $140,000 | $194 | 52 |
| 64 Holiday Dr | 0.61mi | 2/1.0 | 672 (-12%) | 4mo | $155,000 | $231 | 49 |
| 1252 Woodhaven Dr | 0.57mi | 2/1.0 | 816 (+7%) | 18mo | $113,000 | $138 | 46 |
| 26 Vacation Dr | 0.68mi | 3/1.0 (+1) | 828 (+9%) | 4mo | $162,000 | $196 | 45 |
Match score weights: distance 35% · size 25% · config 20% · recency 20%. Top-matched comps best support the ARV.
Projected returns pro-forma
10.0% appreciation · 3.0% rent growth · sell at horizon
- IRR
- 25.5%
- Equity multiple
- 3.04×
- Total profit
- $89,027
- Equity at exit
- $140,537
- IRR
- 22.5%
- Equity multiple
- 6.93×
- Total profit
- $258,971
- Equity at exit
- $303,074
Cash invested: $43,680 (down + closing). Projections, not guarantees.
Landlord ↔ Tenant lean methodology
- Overall (STATE)
- 62 Landlord-Friendly
- State Pennsylvania
- 62 Landlord-Friendly · EVEN
- County
- — inherits STATE
- City
- — inherits STATE
ZIP-level market 18661
- Home prices YoY
- 15.0%
- Active inventory
- 70
- Price-to-rent
- 9.3×
Monthly cashflow live
- Estimated rent
- $1,400 medium interval (Pro) →
- Mortgage (P&I)
- −$818
- Tax from tax record
- −$85 /mo · $1,021/yr
- Insurance
- −$65
- HOA
- −$74
- Vacancy / Maint / Mgmt
- −$294
- Net cashflow
- $64
Break-even live
UW: 25.0% down · 7.5% · 30yr · 1.5% tax · 5.0% vac · 8.0% maint · 8.0% mgmt
Financing live
Cash to close
- Down payment
- $39,000
- Closing costs
- $4,680
- Reserves months
- —
- Total cash needed
- —
Loan-product check · same deal, 3 products live
Conventional
25% down · 7.5% · 30yr
- Down + closing
- —
- Monthly P&I
- —
- Monthly cashflow
- —
- DSCR
- —
- Eligible?
- —
Personal DTI + credit; lowest rate.
DSCR
20% down · 8.5% · 30yr
- Down + closing
- —
- Monthly P&I
- —
- Monthly cashflow
- —
- DSCR
- —
- Eligible?
- —
No personal income docs; deal must DSCR.
Hard money
10% down · 12.0% · 12mo
- Down + closing
- —
- Monthly P&I
- —
- Monthly cashflow
- —
- DSCR
- —
- Eligible?
- —
Short-term bridge; refi at stabilization.
Rent comps 1 comps
| Address | Beds | Baths | Sqft | Rent | $/sqft | DOM | Units | Dist |
|---|---|---|---|---|---|---|---|---|
| 16 Lee Rd White Haven, PA | 3.0 | 2.0 | 1000 | $1,400 | $1.40 | 43d | 1 | 0.89mi |
HOA detail
- Monthly dues
- $74 · $888/yr
- Likely covers
- pool
Listing history 6 events
-
2026-05-22$156,000 Active
-
2020-12-02soldstatus $70,000
-
2020-11-20soldstatus $70,000
-
2020-07-16$69,900
-
2019-04-26$65,000
-
2003-07-21$52,500
ⓘ Source: listings_history table (triggers on properties + properties_extension) + one-shot
backfill from property_details.listing_events for pre-trigger history.
Tax reassessment forecast PA · Partial reset (capped growth)
- Current annual tax
- $1,021 · $85/mo
- Projected year-2 tax
- $1,743 · $145/mo
- Expected delta
- +$722/yr (+$60/mo · 70.7%)
ⓘ Screening estimate from a state-policy table — verify with the county assessor before closing.
Climate risk First Street
- Flood 1/10 Low FEMA zone X (unshaded) · 0% chance over 30 yrs
- Wildfire 2/10 Low
- Heat 2/10 Low 7 d/yr ≥91°F today · 16 d/yr by 30 yrs out
- Wind 4/10 Moderate 7% chance of damaging wind over 30 yrs
- Air quality 2/10 Low 1 unhealthy d/yr today · 2 by 30 yrs out
Nearby sold comps map
Loading sold comps map…
Walkable amenities ~0.75 mi
Loading nearby amenities…
Taxation est. · year 1
- Rental income
- $16,800
- − Mortgage interest
- −$8,738
- − Property taxes
- −$1,021
- − Insurance
- −$780
- − Repairs & maintenance
- −$1,344
- − Management
- −$1,344
- − HOA
- −$888
- − Depreciation
- −$4,538
- Taxable loss
- −$1,853
- Est. tax savings @ 24.0%
- +$445
- After-tax cash flow
- $1,211/yr
For passive investors: Depreciation is non-cash, so a rental often shows a tax loss while cash-flowing — sheltering income. Rental losses are passive: they offset passive income freely, and up to $25,000/yr can offset ordinary (W-2) income if you actively participate and your MAGI is under $100k (phasing out to $0 by $150k); unused losses carry forward. On sale, claimed depreciation is recaptured at up to 25%, and gains may owe capital-gains tax (a 1031 exchange can defer both). Figures are a year-1 estimate at your 24.0% rate — not tax advice; consult a CPA.
Schools (NCES district)
- District
- Hazleton Area SD
- NCES district ID
- 4211700
- Math proficiency
- 18% ▼ -3.00%
- Reading proficiency
- 30% ▼ -15.00%
- Median HH income
- $42,247
- Composite
- 20.44/100
- National rank
- #8582
- State rank
- #476 of 539 in PA
Livability — Hickory Hills
- Score
- 57/100
- State rank
- #1624
- US rank
- #22283
Category grades
Schools grade is shown separately in the Schools card above.
Census & demographics
- Census place
- Hickory Hills, PA
- Population (ZIP)
- 5,541
Population outlook (Luzerne County) Hauer SSP2
- Today (2025)
- 319,505 people
- By 2030
- 319,943 · +0.1%
- By 2040
- 322,643 · +1.0%
- By 2050
- 330,817 · +3.5%
- By 2075
- 379,145 · +18.7%
- By 2100
- 431,908 · +35.2%
Race, ethnicity, and origin ACS 2023
- Neighborhood character
- Predominantly White (92%)
- Race & ethnicity
- White 92% Two or more races 4% Hispanic / Latino 3%
- Common ancestry
- Romanian 16% Lithuanian 2% Polish 1%
- Foreign-born
- 3% · Canada
- Languages at home
- 96% English-only · Other Asian/Pacific 1% Russian/Polish/Slavic 1% Spanish 1%
Political lean MEDSL · Luzerne
- 2024 margin
- R (+19.2) · D 40.0% · R 59.2%
- 2008→2024 swing
- -27.6pp toward R · 2008: 8.4pp · 2024: -19.2pp
- All cycles
- 2024: R+19.2 2020: R+14.4 2016: R+19.6 2012: D+4.8 2008: D+8.4
Not yet ingested
- Civics
- —
Market trends
- HPI YoY
- ▲ 38.68%
- Current HPI
- 296.5596
- Rent YoY
- —
- Metro
- —
- State GDP YoY
- ▲ 1.68%
- F500 in state
- 34
Industry mix (Fortune 500 HQ in PA)
| Industry | F500 HQs | Revenue |
|---|---|---|
| Healthcare | 2 | $309B |
|
||
| Insurance | 2 | $27B |
|
||
| Telecommunications / Media | 1 | $124B |
|
||
| Industrial Distribution | 1 | $22B |
|
||
| Financial Services | 1 | $20B |
|
||
| Chemicals / Materials | 1 | $18B |
|
||
Price history
+197.1% since first listed6 events — show timeline
- 2026-05-22 Listed $156,000 PMAR
- 2020-12-02 Sold (Public Records) $70,000 Public Records
- 2020-11-20 Sold (MLS) $70,000 PMAR
- 2020-07-16 Listed $69,900 PMAR
- 2019-04-26 Listed $65,000 PMAR
- 2003-07-21 Listed $52,500 PMAR
Property tax history
+2.8%/yrLatest (2026): $1,021 · +4.6% YoY. Source: county tax records.
Cash-flow waterfall
monthlySold comps — $/sqft
last 12 mo · ≤1 miLoading sold comps…