636 Clear Creek Ct · Clyde, TX
Flood risk No data
- FEMA flood zone
- —
- Chance of flooding over 30 yrs
- —
- Est. flood insurance / yr
- —
Fire risk No data
- Est. fire insurance / yr
- —
Heat risk No data
- Hot days now (above threshold)
- —
- Hot days in 30 yrs
- —
Wind risk No data
- Chance of severe wind over 30 yrs
- —
Air-quality risk No data
- Unhealthy air days now
- —
- Unhealthy air days in 30 yrs
- —
Risk factors via First Street. Map © Google.
Why this score? — see what drove the F grade
The composite is a weighted blend of 9 inputs, each scored 0–100. Each bar is that input's sub-score; the figure is the points it added to the 100-point composite (weight × sub-score).
- Cash flow +11.5/30.0
- Schools +3.6/10.0
- DSCR +3.4/10.0
- Livability +3.4/5.0
- 1% rule +3.3/10.0
- Rent growth +2.5/5.0
- Condition / age +2.5/5.0
- ARV discount +0.0/15.0
- Appreciation +0.0/10.0
$237,990
🖨 Deal sheet 📄 Offer letter ✓ Due diligence
Listing remarks
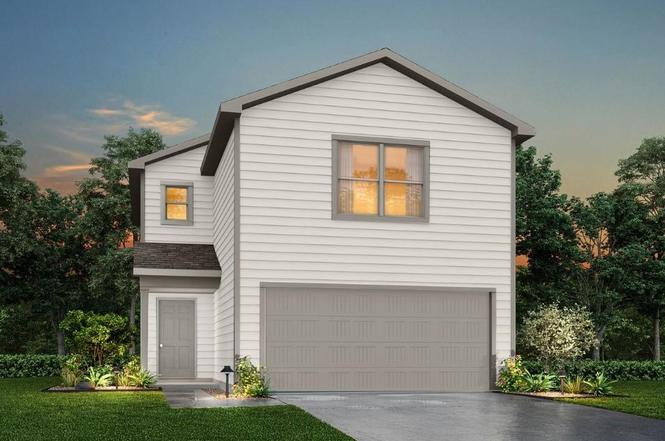
MLS# 21165960 - Built by NHC - Ready Now! ~ Model 1600-2 A1 - Glacier The Glacier Plan from our Freedom Series is a thoughtfully designed 2-story home offering 3 bedrooms, 2.5 bathrooms, and 1,600 square feet of living space, complete with a 2-car garage. As you step inside, you’ll pass the staircase to the upper level before arriving at the bright and open family room. This inviting space flows seamlessly into the kitchen and dining area, creating the perfect setting for family time or entertainment. A convenient half bathroom is located just off the kitchen for easy access. The upper level is designed for relaxation and privacy, featuring a spacious primary suite with a walk-in clo
Key facts
- 0.24 acre lot
- 2 garage spots
- Built 2025
Neighborhood map
What this means for you Summary
Snapshot
- This is a 3-bed/2.5-bath single-family listed at $238k.
Deal economics
- At list price, monthly cash flow is $-80 ($-966/yr) — negative.
- To cash-flow at today's rent, offer at most $226k (4.9% below list).
- To meet the 1% rule (rent ≥ 1% of price), the offer needs to be $198k (16.8% below list).
- Recommended offer: $198k (16.8% below list) — sets the bar for 1% rule.
- Cap rate 5.9% vs local median 3.2% in Clyde — top-decile yield for the area; either an underpriced asset or a hidden risk that comps aren't pricing in. Stress-test before assuming the spread holds.
Location & tenants
- Location reads 68/100 on livability (#498 in TX) — a middle-class / working-renter tenant base. Strengths: crime A+, cost of living A+, housing A+; Watch: employment C-, health & safety D+, amenities F.
- Clyde CISD (town): math 42% / reading 42% proficiency, ranked #341 of 826 in TX (top 41%) — families likely to look elsewhere, expect single-tenant / working-renter base with shorter leases.
- Zoned schools: Clyde El (366 students, 58% FRL).
- Market conditions: 132 active listings in the ZIP; 1 comparable units currently listed for rent nearby; 11 units permitted in Callahan County in 2024 (0 in 5+ unit buildings).
Forward outlook
- Local home prices are declining (-3.0%/yr); year-one equity from $2k of loan paydown is wiped out by about $7k of value loss. Plan a longer hold.
- Callahan County population projected to shrink 5% by 2050 — rents likely to lag national; underwrite the cash flow, not the appreciation.
Negotiation context
- It's been on market 53 days — a 3% lower offer ($231k) is reasonable based on typical stale-listing flexibility.
Questions for the listing agent
- What do current leases actually rent for vs. the listed asking? Can we see a recent rent roll and the last 12 months of T-12 income?
- It's been on market 53 days. Have you received any prior offers? Is the seller open to a 17% concession, seller financing, or rate buy-down credit?
- Is there a deadline driving the sale (1031 exchange, divorce, estate, relocation)? That informs how much negotiation room exists.
- The area grade is low — what's the realistic commute time and amenity access for the typical tenant pool here? Any planned neighborhood developments (good or bad) we should know about?
- What's the average days-on-market for RENTAL listings here right now (not sales)? A rising rental-DOM trend means longer vacancies and softer asking-rent achievability than the comps imply.
- What's the recent tenant-quality profile in this submarket — average credit score on applications, eviction rate, late-payment / NSF rate, and stable-employment percentage? A property-management company in the area should have these aggregated.
- How much new for-sale + rental construction is in the pipeline within 1–3 miles? Heavy new supply typically softens prices + rents 12–24 months out; constrained supply supports both.
Investment metrics
- 1% rule
- 0.83% ✗
- Cap rate
- 5.89%
- Cash-on-cash
- -1.45%
- DSCR
- 0.94
- GRM
- 10.0
CMA / ARV
- ARV (on-the-fly)
- $190,400
- Comps found
- 12
Show comp detail 12 sales within ~0.75 mi
| Address | Dist | Beds/Ba | Sqft | Sold | Price | $/sf | Match |
|---|---|---|---|---|---|---|---|
| 812 Sunset Dr | 0.13mi | 3/2.0 | 1,579 (-1%) | 5mo | $232,000 | $147 | 85 |
| 624 Clear Crk | 0.07mi | 4/2.0 (+1) | 1,510 (-6%) | 2mo | $192,090 | $127 | 79 |
| 618 Clear Crk | 0.04mi | 4/2.0 (+1) | 1,510 (-6%) | 4mo | $187,909 | $124 | 79 |
| 627 Clear Crk | 0.05mi | 4/2.0 (+1) | 1,510 (-6%) | 4mo | $188,990 | $125 | 78 |
| 613 Clear Crk | 0.02mi | 4/2.0 (+1) | 1,510 (-6%) | 8mo | $174,993 | $116 | 76 |
| 608 Clear Creek Ct | 0.06mi | 4/2.0 (+1) | 1,510 (-6%) | 8mo | $179,994 | $119 | 74 |
| 602 Clear Creek Ct | 0.10mi | 4/2.0 (+1) | 1,510 (-6%) | 9mo | $196,990 | $130 | 72 |
| 604 Clear Creek Ct | 0.09mi | 4/2.0 (+1) | 1,804 (+13%) | 4mo | $199,996 | $111 | 64 |
| 605 Clear Crk | 0.08mi | 4/2.0 (+1) | 1,804 (+13%) | 8mo | $199,994 | $111 | 62 |
| 703 Pecan Meadow Dr | 0.12mi | 3/2.0 | 1,368 (-14%) | 9mo | $95,000 | $69 | 61 |
| 1702 Friar Ct | 0.68mi | 4/2.5 (+1) | 1,528 (-4%) | 5mo | $179,000 | $117 | 52 |
| 102 S 2nd St | 0.65mi | 4/2.0 (+1) | 1,516 (-5%) | 5mo | $74,900 | $49 | 50 |
Match score weights: distance 35% · size 25% · config 20% · recency 20%. Top-matched comps best support the ARV.
Projected returns pro-forma
-3.0% appreciation · 3.0% rent growth · sell at horizon
- IRR
- -18.7%
- Equity multiple
- 0.34×
- Total profit
- $-43,662
- Equity at exit
- $35,485
- IRR
- -11.1%
- Equity multiple
- 0.33×
- Total profit
- $-44,500
- Equity at exit
- $20,577
Cash invested: $66,637 (down + closing). Projections, not guarantees.
Landlord ↔ Tenant lean methodology
- Overall (STATE)
- 87 Strongly Landlord-Friendly
- State Texas
- 87 Strongly Landlord-Friendly · R+5
- County
- — inherits STATE
- City
- — inherits STATE
ZIP-level market 79510
- Home prices YoY
- -21.6%
- Active inventory
- 132
- Price-to-rent
- 10.0×
Monthly cashflow live
- Estimated rent
- $1,980 medium interval (Pro) →
- Mortgage (P&I)
- −$1,248
- Tax est. 1.5%
- −$297 /mo · $3,570/yr
- Insurance
- −$99
- HOA
- −$0
- Vacancy / Maint / Mgmt
- −$416
- Net cashflow
- $-80
Break-even live
UW: 25.0% down · 7.5% · 30yr · 1.5% tax · 5.0% vac · 8.0% maint · 8.0% mgmt
Financing live
Cash to close
- Down payment
- $59,498
- Closing costs
- $7,140
- Reserves months
- —
- Total cash needed
- —
Loan-product check · same deal, 3 products live
Conventional
25% down · 7.5% · 30yr
- Down + closing
- —
- Monthly P&I
- —
- Monthly cashflow
- —
- DSCR
- —
- Eligible?
- —
Personal DTI + credit; lowest rate.
DSCR
20% down · 8.5% · 30yr
- Down + closing
- —
- Monthly P&I
- —
- Monthly cashflow
- —
- DSCR
- —
- Eligible?
- —
No personal income docs; deal must DSCR.
Hard money
10% down · 12.0% · 12mo
- Down + closing
- —
- Monthly P&I
- —
- Monthly cashflow
- —
- DSCR
- —
- Eligible?
- —
Short-term bridge; refi at stabilization.
Rent comps 1 comps
| Address | Beds | Baths | Sqft | Rent | $/sqft | DOM | Units | Dist |
|---|---|---|---|---|---|---|---|---|
| 613 Marlin St Clyde, TX | 4.0 | 1.0 | 1218 | $1,980 | $1.63 | 20d | 1 | 0.89mi |
Listing history 5 events
-
2026-03-23status Pending
-
2026-03-11price $237,990
-
2026-03-10price $236,990
-
2026-03-06price $234,990
-
2026-01-29$233,322 Active
ⓘ Source: listings_history table (triggers on properties + properties_extension) + one-shot
backfill from property_details.listing_events for pre-trigger history.
Nearby sold comps map
Loading sold comps map…
Walkable amenities ~0.75 mi
Loading nearby amenities…
Taxation est. · year 1
- Rental income
- $23,760
- − Mortgage interest
- −$13,331
- − Property taxes
- −$3,570
- − Insurance
- −$1,190
- − Repairs & maintenance
- −$1,901
- − Management
- −$1,901
- − Depreciation
- −$6,923
- Taxable loss
- −$5,056
- Est. tax savings @ 24.0%
- +$1,213
- After-tax cash flow
- $247/yr
For passive investors: Depreciation is non-cash, so a rental often shows a tax loss while cash-flowing — sheltering income. Rental losses are passive: they offset passive income freely, and up to $25,000/yr can offset ordinary (W-2) income if you actively participate and your MAGI is under $100k (phasing out to $0 by $150k); unused losses carry forward. On sale, claimed depreciation is recaptured at up to 25%, and gains may owe capital-gains tax (a 1031 exchange can defer both). Figures are a year-1 estimate at your 24.0% rate — not tax advice; consult a CPA.
Schools (NCES district)
- District
- Clyde CISD
- NCES district ID
- 4814450
- Math proficiency
- 42% ▼ -7.00%
- Reading proficiency
- 42% ▼ -2.00%
- Median HH income
- $46,614
- Composite
- 35.84/100
- National rank
- #4824
- State rank
- #341 of 826 in TX
Livability — Clyde
- Score
- 68/100
- State rank
- #498
- US rank
- #9935
Category grades
Schools grade is shown separately in the Schools card above.
Census & demographics
- Census place
- Clyde, TX
- Population (ZIP)
- 8,135
Population outlook (Callahan County) Hauer SSP2
- Today (2025)
- 13,664 people
- By 2030
- 13,578 · -0.6%
- By 2040
- 13,283 · -2.8%
- By 2050
- 13,008 · -4.8%
- By 2075
- 12,354 · -9.6%
- By 2100
- 11,326 · -17.1%
Race, ethnicity, and origin ACS 2023
- Neighborhood character
- Predominantly White (79%)
- Race & ethnicity
- White 79% Hispanic / Latino 13% Two or more races 12% Black 2%
- Hispanic origin (detail)
- Mexican 13%
- Common ancestry
- Italian 8% Slovak 3% Serbian 3%
- Foreign-born
- 1% · China
- Languages at home
- 93% English-only · Spanish 5% German/W. Germanic 2%
Political lean MEDSL · Callahan
- 2024 margin
- Solid R (+77.6) · D 10.9% · R 88.5%
- 2008→2024 swing
- -15.9pp toward R · 2008: -61.7pp · 2024: -77.6pp
- All cycles
- 2024: R+77.6 2020: R+77.3 2016: R+77.2 2012: R+69.8 2008: R+61.7
Not yet ingested
- Civics
- —
Market trends
- HPI YoY
- ▼ -51.42%
- Current HPI
- 186.6326
- Rent YoY
- —
- Metro
- —
- State GDP YoY
- ▲ 3.95%
- F500 in state
- 110
Industry mix (Fortune 500 HQ in TX)
| Industry | F500 HQs | Revenue |
|---|---|---|
| Energy | 16 | $1,198B |
|
||
| Technology | 5 | $198B |
|
||
| Engineering / Construction | 4 | $72B |
|
||
| Energy Services | 3 | $60B |
|
||
| Utilities | 3 | $41B |
|
||
| Healthcare | 2 | $330B |
|
||
Price history
+2.0% since first listed5 events — show timeline
- 2026-03-23 Pending — NTREIS
- 2026-03-11 Price Changed $237,990 NTREIS
- 2026-03-10 Price Changed $236,990 NTREIS
- 2026-03-06 Price Changed $234,990 NTREIS
- 2026-01-29 Listed $233,322 NTREIS
Cash-flow waterfall
monthlySold comps — $/sqft
last 12 mo · ≤1 miLoading sold comps…