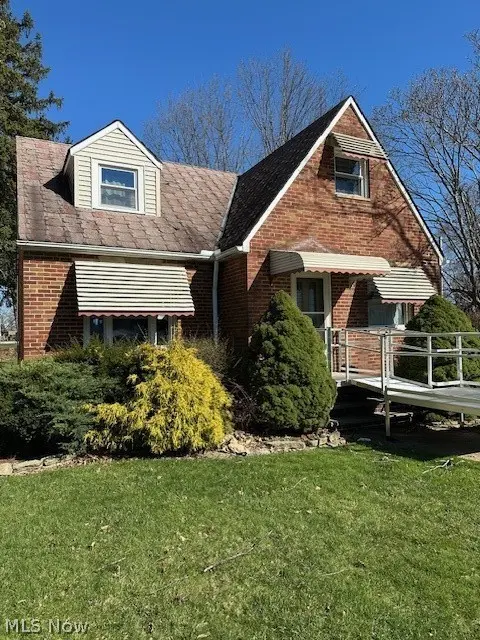
5857 W 54th St · Parma, OH
Flood risk 1/10 · Minimal
- FEMA flood zone
- X (unshaded)
- Chance of flooding over 30 yrs
- 0.0%
- Est. flood insurance / yr
- $473 – $860
Fire risk 1/10 · Minimal
- Est. fire insurance / yr
- $713 – $1,323
Heat risk 3/10 · Minor
- Hot days now (above 95°F)
- 7 days/yr
- Hot days in 30 yrs
- 17 days/yr
Wind risk 1/10 · Minimal
- Chance of severe wind over 30 yrs
- —
Air-quality risk 3/10 · Minor
- Unhealthy air days now
- 2 days/yr
- Unhealthy air days in 30 yrs
- 4 days/yr
Risk factors via First Street. Map © Google.
Why this score? — see what drove the C- grade
The composite is a weighted blend of 9 inputs, each scored 0–100. Each bar is that input's sub-score; the figure is the points it added to the 100-point composite (weight × sub-score).
- ARV discount +15.0/15.0
- Cash flow +13.2/30.0
- 1% rule +4.1/10.0
- Schools +4.1/10.0
- Livability +4.1/5.0
- DSCR +4.0/10.0
- Rent growth +3.6/5.0
- Condition / age +2.5/5.0
- Appreciation +0.0/10.0
$190,000
🖨 Deal sheet (PDF) 📄 Offer letter ✓ Due diligence
Listing remarks MLS
Well kept with recent cosmetic finishes including new carpet, fresh paint on walls and trim. This 3 Bed 2 bath Cape-Cod is a perfect starter home for anyone trying to live in the heart of Parma! The 0.15 Acres corner lot backs up to a very large park with two baseball diamonds. Spacious yard, great location, and could use your final touches in the basement!
Key facts
- Cozy breezeway
- Great views
- Nearby park
Tags
Neighborhood map
What this means for you Summary
Snapshot
- This is a 4-bed/1.5-bath single-family listed at $190k.
Deal economics
- At list price, monthly cash flow is $-3 ($-39/yr) — negative.
- To cash-flow at today's rent, offer at most $189k (0.3% below list).
- To meet the 1% rule (rent ≥ 1% of price), the offer needs to be $173k (9.0% below list).
- Recommended offer: $173k (9.0% below list) — sets the bar for 1% rule.
- Cap rate 6.3% vs local median 5.0% in Parma — meaningfully above typical; check what's discounted (condition, days-on-market, listing class) to confirm the premium yield is real.
Location & tenants
- Location reads 82/100 on livability (#84 in OH, #1,232 nationally) — a professional / high-income tenant draw. Strengths: crime A+, amenities A+, cost of living A+; Watch: employment C-, commute F.
- Parma City (suburban): math 43% / reading 52% proficiency, ranked #469 of 656 in OH (top 72%) — families likely to look elsewhere, expect single-tenant / working-renter base with shorter leases.
- Zoned schools: Renwood Elementary School (math 57% / reading 52%, grade C, #788 of 1,584 statewide, top 52%, 252 students, 66% FRL); Shiloh Middle School (math 27% / reading 46%, grade F, #539 of 654 statewide, top 83%, 511 students, 65% FRL); Parma High School (math 32% / reading 47%, grade F, #528 of 781 statewide, top 71%, 1,233 students, 55% FRL) — zoned schools average 62% FRL vs 41% district-wide (21 pts higher); higher-poverty schools than district average — tighter screening recommended.
- Market conditions: Rents rising fast (+4.3%/yr); 88 active listings in the ZIP; 20 comparable units currently listed for rent nearby; rentals at typical pace (median 17d on market — plan ~3-4 weeks tenant-placement turnaround); 1,441 units permitted in Cuyahoga County in 2024 (700 in 5+ unit buildings).
Forward outlook
- Local home prices are declining (-3.0%/yr); year-one equity from $1k of loan paydown is wiped out by about $6k of value loss. Plan a longer hold.
- Cuyahoga County population projected to shrink 8% by 2050 — rents likely to lag national; underwrite the cash flow, not the appreciation.
Negotiation context
- Only 7 days on market — expect competitive offers; lowballing is unlikely to land.
- 2 sale attempts since 6y ago with the ask held roughly flat each time — persistent listings suggest the price (not the market) is what's stuck; bring a comps-based counter.
- Current owner paid $123k; list at $190k implies a 54% gain — meaningful room to come down on a strong offer.
Risks & watch-outs
- Watch-outs: built in 1950 — expect roof / HVAC / electrical / plumbing capex.
Questions for the listing agent
- What do current leases actually rent for vs. the listed asking? Can we see a recent rent roll and the last 12 months of T-12 income?
- Built in 1950 — when were the roof, HVAC, electrical panel, plumbing, and water heater last replaced?
- Is there a deadline driving the sale (1031 exchange, divorce, estate, relocation)? That informs how much negotiation room exists.
- Schools are B-rated — typically a magnet for longer-tenancy family renters. What's the average tenant stay here, and is there a school-zone premium baked into asking?
- What's the average days-on-market for RENTAL listings here right now (not sales)? A rising rental-DOM trend means longer vacancies and softer asking-rent achievability than the comps imply.
- What's the recent tenant-quality profile in this submarket — average credit score on applications, eviction rate, late-payment / NSF rate, and stable-employment percentage? A property-management company in the area should have these aggregated.
- How much new for-sale + rental construction is in the pipeline within 1–3 miles? Heavy new supply typically softens prices + rents 12–24 months out; constrained supply supports both.
Investment metrics
- 1% rule
- 0.91% ✗
- Cap rate
- 6.27%
- Cash-on-cash
- -0.07%
- DSCR
- 1.00
- GRM
- 9.2
CMA / ARV
- ARV (on-the-fly)
- $236,060
- Comps found
- 12
Show comp detail 12 sales within ~0.75 mi
| Address | Dist | Beds/Ba | Sqft | Sold | Price | $/sf | Match |
|---|---|---|---|---|---|---|---|
| 5857 W 54th St | 0.00mi | 3/2.0 (-1) | 1,276 (0%) | 1mo | $190,000 | $149 | 92 |
| 5710 Alber Ave | 0.16mi | 3/2.0 (-1) | 1,326 (+4%) | 2mo | $212,000 | $160 | 78 |
| 6010 Allanwood Dr | 0.34mi | 3/1.5 (-1) | 1,297 (+2%) | 2mo | $222,000 | $171 | 75 |
| 6307 Kenneth Ave | 0.38mi | 4/1.0 | 1,219 (-4%) | 0mo | $243,000 | $199 | 73 |
| 6514 Kenneth Ave | 0.45mi | 3/1.0 (-1) | 1,296 (+2%) | 1mo | $200,000 | $154 | 69 |
| 5503 Westlake Ave | 0.48mi | 4/2.0 | 1,219 (-4%) | 0mo | $252,000 | $207 | 68 |
| 3908 Kenmore Ave | 0.61mi | 3/1.5 (-1) | 1,242 (-3%) | 0mo | $151,000 | $122 | 62 |
| 5706 Brownfield Dr | 0.44mi | 4/1.5 | 1,418 (+11%) | 1mo | $200,000 | $141 | 60 |
| 5706 Virginia Ave | 0.47mi | 3/2.0 (-1) | 1,172 (-8%) | 0mo | $265,000 | $226 | 57 |
| 5803 Renwood Dr | 0.53mi | 3/1.0 (-1) | 1,188 (-7%) | 2mo | $251,000 | $211 | 56 |
| 3716 Grantwood Dr | 0.74mi | 3/2.0 (-1) | 1,248 (-2%) | 2mo | $235,000 | $188 | 54 |
| 6106 Pelham Dr | 0.60mi | 3/1.0 (-1) | 1,092 (-14%) | 1mo | $202,500 | $185 | 40 |
Match score weights: distance 35% · size 25% · config 20% · recency 20%. Top-matched comps best support the ARV.
Projected returns pro-forma
-3.0% appreciation · 4.29% rent growth · sell at horizon
- IRR
- -14.9%
- Equity multiple
- 0.46×
- Total profit
- $-28,659
- Equity at exit
- $28,330
- IRR
- -4.1%
- Equity multiple
- 0.71×
- Total profit
- $-15,397
- Equity at exit
- $16,428
Cash invested: $53,200 (down + closing). Projections, not guarantees.
Landlord ↔ Tenant lean methodology
- Overall (STATE)
- 73 Landlord-Friendly
- State Ohio
- 73 Landlord-Friendly · R+6
- County
- — inherits STATE
- City
- — inherits STATE
ZIP-level market 44129
- Rents YoY
- 4.3%
- Active inventory
- 88
- Price-to-rent
- 9.2×
Monthly cashflow live
- Estimated rent
- $1,729 high interval (Pro) →
- Mortgage (P&I)
- −$996
- Tax from tax record
- −$294 /mo · $3,524/yr
- Insurance
- −$79
- HOA
- −$0
- Vacancy / Maint / Mgmt
- −$363
- Net cashflow
- $-3
Break-even live
Sensitivity live
| Price | -10% $104 | -5% $51 | +0% $-3 | +5% $-57 | +10% $-111 |
|---|---|---|---|---|---|
| Rent | -10% $-140 | -5% $-72 | +0% $-3 | +5% $65 | +10% $133 |
| Rate | -1.0pp $92 | -0.5pp $45 | base $-3 | +0.5pp $-52 | +1.0pp $-103 |
UW: 25.0% down · 7.5% · 30yr · 1.5% tax · 5.0% vac · 8.0% maint · 8.0% mgmt
Financing live
Cash to close
- Down payment
- $47,500
- Closing costs
- $5,700
- Reserves months
- —
- Total cash needed
- —
Loan-product check · same deal, 3 products live
Conventional
25% down · 7.5% · 30yr
- Down + closing
- —
- Monthly P&I
- —
- Monthly cashflow
- —
- DSCR
- —
- Eligible?
- —
Personal DTI + credit; lowest rate.
DSCR
20% down · 8.5% · 30yr
- Down + closing
- —
- Monthly P&I
- —
- Monthly cashflow
- —
- DSCR
- —
- Eligible?
- —
No personal income docs; deal must DSCR.
Hard money
10% down · 12.0% · 12mo
- Down + closing
- —
- Monthly P&I
- —
- Monthly cashflow
- —
- DSCR
- —
- Eligible?
- —
Short-term bridge; refi at stabilization.
Rent comps 20 comps
| Address | Beds | Baths | Sqft | Rent | $/sqft | DOM | Units | Dist |
|---|---|---|---|---|---|---|---|---|
| 6505 Snow Rd Unit REAR Parma, OH | 3.0 | 1.5 | 1312 | $1,599 | $1.22 | 9d | 1 | 0.39mi |
| 5606 Theota Ave Cleveland, OH | 3.0 | 1.5 | 1676 | $1,400 | $0.84 | 9d | 1 | 0.73mi |
| 5606 Theota Ave Cleveland, OH | 3.0 | 1.5 | 1676 | $1,400 | $0.84 | 6d | 1 | 0.73mi |
| 7514 Bertha Ave Cleveland, OH | 5.0 | 2.0 | 1672 | $1,776 | $1.06 | 3d | 1 | 0.76mi |
| 4606 Lincoln Ave Cleveland, OH | 3.0 | 2.0 | 1418 | $1,995 | $1.41 | 3d | 1 | 0.79mi |
| 3330 Fortune Ave Cleveland, OH | 3.0 | 1.5 | 1258 | $1,775 | $1.41 | 45d | 1 | 0.94mi |
| 2907 Snow Rd Unit up Parma, OH | 3.0 | 1.0 | 1026 | $1,700 | $1.66 | 45d | 1 | 0.95mi |
| 6511 Luelda Ave Unit Na Parma, OH | 3.0 | 2.0 | 1577 | $1,975 | $1.25 | 45d | 1 | 0.97mi |
| 7906 Lanyard Dr Unit 1496071P Parma, OH | 4.0 | 1.5 | 1227 | $5,834 | $4.75 | 9d | 1 | 0.99mi |
| 4407 Woodway Ave Cleveland, OH | 3.0 | 2.0 | 1728 | $1,750 | $1.01 | 25d | 1 | 1.00mi |
| 5252 W 45th St Unit 1496134P Parma, OH | 3.0 | 2.0 | 1065 | $5,388 | $5.06 | 16d | 1 | 1.03mi |
| 6007 Merkle Ave Unit Down Parma, OH | 3.0 | 1.0 | 1250 | $1,399 | $1.12 | 4d | 1 | 1.04mi |
| 7903 Ackley Rd Unit 7903 Parma, OH | 3.0 | 1.0 | 1100 | $1,600 | $1.45 | 45d | 1 | 1.16mi |
| 2611 Brookdale Ave Cleveland, OH | 3.0 | 1.0 | 1092 | $1,825 | $1.67 | 45d | 1 | 1.25mi |
| 8326 Fernhill Ave Cleveland, OH | 3.0 | 1.0 | 1350 | $1,700 | $1.26 | 45d | 1 | 1.26mi |
| 4191 W Ridgewood Dr Unit 4193 Parma, OH | 4.0 | 3.0 | 1800 | $1,950 | $1.08 | 45d | 1 | 1.26mi |
| 2716 Lincoln Ave Unit 1288912P Parma, OH | 4.0 | 2.0 | 1205 | $4,125 | $3.42 | 9d | 1 | 1.29mi |
| 6236 Westminster Dr Cleveland, OH | 3.0 | 1.0 | 1131 | $1,700 | $1.50 | 16d | 1 | 1.31mi |
| 5876 Wickfield Dr Cleveland, OH | 5.0 | 2.0 | 1316 | $1,900 | $1.44 | 3d | 1 | 1.40mi |
| 5080 Whispering Oaks BLVD Parma, OH | 3.0 | 2.0 | 1332 | $1,799 | $1.35 | 14d | 1 | 1.48mi |
Listing history 7 events
-
2026-04-27status Pending
-
2026-04-15$190,000 Active
-
2020-04-21soldstatus $123,000
-
2020-04-20soldstatus $123,000 Closed 359-char remark
Show marketing remark (359 chars)
Well kept with recent cosmetic finishes including new carpet, fresh paint on walls and trim. This 3 Bed 2 bath Cape-Cod is a perfect starter home for anyone trying to live in the heart of Parma! The 0.15 Acres corner lot backs up to a very large park with two baseball diamonds. Spacious yard, great location, and could use your final touches in the basement!
-
2020-03-10status Pending 359-char remark
Show marketing remark (359 chars)
Well kept with recent cosmetic finishes including new carpet, fresh paint on walls and trim. This 3 Bed 2 bath Cape-Cod is a perfect starter home for anyone trying to live in the heart of Parma! The 0.15 Acres corner lot backs up to a very large park with two baseball diamonds. Spacious yard, great location, and could use your final touches in the basement!
-
2020-03-04$124,000 Active 359-char remark
Show marketing remark (359 chars)
Well kept with recent cosmetic finishes including new carpet, fresh paint on walls and trim. This 3 Bed 2 bath Cape-Cod is a perfect starter home for anyone trying to live in the heart of Parma! The 0.15 Acres corner lot backs up to a very large park with two baseball diamonds. Spacious yard, great location, and could use your final touches in the basement!
-
1976-05-01soldstatus $44,000
ⓘ Source: listings_history table (triggers on properties + properties_extension) + one-shot
backfill from property_details.listing_events for pre-trigger history.
Tax reassessment forecast OH · Partial reset (capped growth)
- Current annual tax
- $3,524 · $294/mo
- Projected year-2 tax
- $3,524 · $294/mo
- Expected delta
- $0/yr ($0/mo · 0.0%)
ⓘ Screening estimate from a state-policy table — verify with the county assessor before closing.
Climate risk First Street
- Flood 1/10 Low FEMA zone X (unshaded) · 0% chance over 30 yrs
- Wildfire 1/10 Low
- Heat 3/10 Moderate 7 d/yr ≥95°F today · 17 d/yr by 30 yrs out
- Wind 1/10 Low
- Air quality 3/10 Moderate 2 unhealthy d/yr today · 4 by 30 yrs out
Nearby sold comps map
Loading sold comps map…
Walkable amenities ~0.75 mi
Loading nearby amenities…
Taxation est. · year 1
- Rental income
- $20,749
- − Mortgage interest
- −$10,643
- − Property taxes
- −$3,524
- − Insurance
- −$950
- − Repairs & maintenance
- −$1,660
- − Management
- −$1,660
- − Depreciation
- −$5,527
- Taxable loss
- −$3,215
- Est. tax savings @ 24.0%
- +$772
- After-tax cash flow
- $733/yr
For passive investors: Depreciation is non-cash, so a rental often shows a tax loss while cash-flowing — sheltering income. Rental losses are passive: they offset passive income freely, and up to $25,000/yr can offset ordinary (W-2) income if you actively participate and your MAGI is under $100k (phasing out to $0 by $150k); unused losses carry forward. On sale, claimed depreciation is recaptured at up to 25%, and gains may owe capital-gains tax (a 1031 exchange can defer both). Figures are a year-1 estimate at your 24.0% rate — not tax advice; consult a CPA.
Schools (NCES district)
- District
- Parma City
- NCES district ID
- 3904463
- Math proficiency
- 43% ▼ -18.00%
- Reading proficiency
- 52% ▼ -10.00%
- Median HH income
- $50,371
- Composite
- 40.72/100
- National rank
- #3662
- State rank
- #469 of 656 in OH
Livability — Parma
- Score
- 82/100
- State rank
- #84
- US rank
- #1232
Category grades
Schools grade is shown separately in the Schools card above.
Census & demographics
- Census place
- Parma, OH
- County
- Cuyahoga County · 1,090,369 people
- City population
- 66,574
- Metro
- Cleveland-Elyria, OH
- Population (ZIP)
- 28,800
- Household income
- $70,651
- Rent vs Own
- Severe rent burden
- 541.0
Population outlook (Cuyahoga County) Hauer SSP2
- Today (2025)
- 1,244,621 people
- By 2030
- 1,230,093 · -1.2%
- By 2040
- 1,189,108 · -4.5%
- By 2050
- 1,145,706 · -7.9%
- By 2075
- 1,076,557 · -13.5%
- By 2100
- 978,987 · -21.3%
Race, ethnicity, and origin ACS 2023
- Neighborhood character
- Predominantly White (76%)
- Race & ethnicity
- White 76% Hispanic / Latino 13% Two or more races 8% Black 7% Asian 2%
- Hispanic origin (detail)
- Puerto Rican 9%
- Common ancestry
- Romanian 12% Subsaharan African 3% Scandinavian 1%
- Foreign-born
- 11% · Canada, India, Vietnam
- Languages at home
- 82% English-only · Spanish 7% Russian/Polish/Slavic 4% Other Indo-European 3%
Political lean MEDSL · Cuyahoga
- 2024 margin
- Solid D (+31.5) · D 65.4% · R 33.9%
- 2008→2024 swing
- -7.4pp toward R · 2008: 38.9pp · 2024: 31.5pp
- All cycles
- 2024: D+31.5 2020: D+34.1 2016: D+35.0 2012: D+38.7 2008: D+38.9
Not yet ingested
- Civics
- —
Market trends
- HPI YoY
- ▼ -143.31%
- Current HPI
- 184.2628
- Rent YoY
- ▲ 4.29%
- Metro
- Cleveland-Elyria, OH
- State GDP YoY
- ▲ 1.98%
- F500 in state
- 48
Industry mix (Fortune 500 HQ in OH)
| Industry | F500 HQs | Revenue |
|---|---|---|
| Insurance | 3 | $145B |
|
||
| Industrial Machinery | 3 | $49B |
|
||
| Financial Services | 3 | $24B |
|
||
| Consumer Goods | 2 | $93B |
|
||
| Aerospace / Defense | 2 | $47B |
|
||
| Utilities | 2 | $33B |
|
||
Price history
+331.8% since first listed7 events — show timeline
- 2026-04-27 Pending — MLSNOW
- 2026-04-15 Listed $190,000 MLSNOW
- 2020-04-21 Sold (Public Records) $123,000 Public Records
- 2020-04-20 Sold (MLS) $123,000 MLSNOW
- 2020-03-10 Pending — MLSNOW
- 2020-03-04 Listed $124,000 MLSNOW
- 1976-05-01 Sold (Public Records) $44,000 Public Records
Property tax history
+5.9%/yrLatest (2025): $3,524 · -5.5% YoY. Source: county tax records.
Cash-flow waterfall
monthlySold comps — $/sqft
last 12 mo · ≤1 miLoading sold comps…