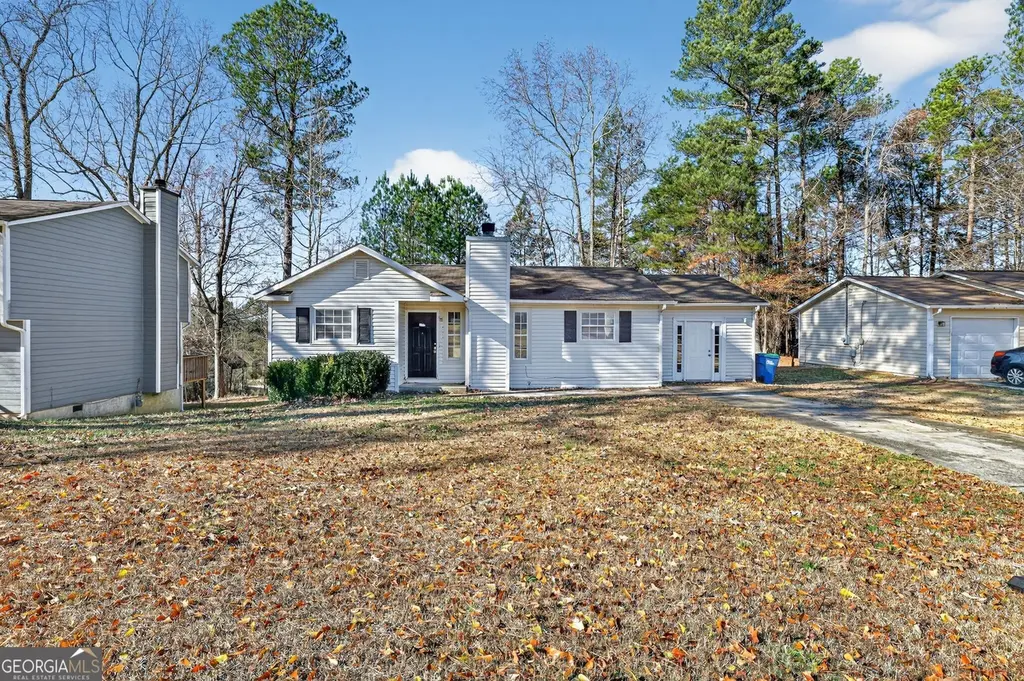
2820 Robinson Wood Dr · South Fulton, GA
Flood risk 1/10 · Minimal
- FEMA flood zone
- X (unshaded)
- Chance of flooding over 30 yrs
- 0.0%
- Est. flood insurance / yr
- $507 – $1,088
Fire risk 4/10 · Minor
- Est. fire insurance / yr
- $963 – $1,789
Heat risk 6/10 · Moderate
- Hot days now (above 104°F)
- 7 days/yr
- Hot days in 30 yrs
- 18 days/yr
Wind risk 6/10 · Moderate
- Chance of severe wind over 30 yrs
- 27.0%
Air-quality risk 4/10 · Minor
- Unhealthy air days now
- 4 days/yr
- Unhealthy air days in 30 yrs
- 6 days/yr
Risk factors via First Street. Map © Google.
Why this score? — see what drove the D grade
The composite is a weighted blend of 9 inputs, each scored 0–100. Each bar is that input's sub-score; the figure is the points it added to the 100-point composite (weight × sub-score).
- Cash flow +11.5/30.0
- ARV discount +10.8/15.0
- Schools +4.5/10.0
- DSCR +3.4/10.0
- Rent growth +3.4/5.0
- 1% rule +3.2/10.0
- Livability +2.5/5.0
- Condition / age +2.5/5.0
- Appreciation +0.0/10.0
$224,900
🖨 Deal sheet (PDF) 📄 Offer letter ✓ Due diligence
Listing remarks MLS
2820 Robinson Wood Dr, Riverdale, GA 30296, is a charming residential home located in a quiet and established neighborhood. This spacious property features a cozy yet functional layout with multiple bedrooms and bathrooms, perfect for families or those looking for extra space. The house boasts an inviting exterior with a well-maintained lawn and a private backyard, ideal for outdoor gatherings and relaxation. Inside, you'll find a bright and airy living area, a modern kitchen with updated appliances, and generous room sizes throughout.
Key facts
- Updated appliances
- Private backyard
- Well maintained lawn
Tags
Neighborhood map
What this means for you Summary
Snapshot
- This is a 3-bed/2.0-bath single-family listed at $225k.
Deal economics
- At list price, monthly cash flow is $-72 ($-870/yr) — negative.
- To cash-flow at today's rent, offer at most $212k (5.7% below list).
- To meet the 1% rule (rent ≥ 1% of price), the offer needs to be $184k (18.0% below list).
- Recommended offer: $184k (18.0% below list) — sets the bar for 1% rule.
- Cap rate 5.9% vs local median 4.6% in South Fulton — meaningfully above typical; check what's discounted (condition, days-on-market, listing class) to confirm the premium yield is real.
Location & tenants
- Location reads: area grade D — affects rentability + tenant quality, not the cash-flow math above.
- Fulton County (suburban): math 49% / reading 53% proficiency, ranked #12 of 174 in GA (top 7%) — acceptable for families but not a draw, mixed tenant base, ~2y average lease.
- Zoned schools: Amana Academy School (math 47% / reading 52%, grade D, #264 of 1,228 statewide, top 23%, 731 students, 30% FRL, charter); Mcnair Middle School (math 8% / reading 12%, grade F, #433 of 470 statewide, top 93%, 888 students, 100% FRL); Creekside High School (math 30% / reading 24%, grade F, #160 of 424 statewide, top 38%, 1,768 students, 100% FRL) — zoned schools average 77% FRL vs 41% district-wide (35 pts higher); higher-poverty schools than district average — tighter screening recommended.
- Zoned-school proficiency averages 29% at this address vs 51% district-wide (-22 pts) — the specific schools serving this property underperform the Fulton County average; the district grade overstates school quality for this exact location.
- Market conditions: Rents rising (+3.5%/yr); 142 active listings in the ZIP; 30 comparable units currently listed for rent nearby; rentals at typical pace (median 15d on market — plan ~3-4 weeks tenant-placement turnaround); 11,565 units permitted in Fulton County in 2024 (8,159 in 5+ unit buildings).
- This rent runs 35% of the median local income ($63k/yr) — at the standard rent-burdened threshold; future hikes will face affordability resistance.
Forward outlook
- Local home prices are declining (-3.0%/yr); year-one equity from $2k of loan paydown is wiped out by about $7k of value loss. Plan a longer hold.
- Fulton County population projected at +38% by 2050 — long-run rental-demand tailwind backs the buy-and-hold thesis.
Negotiation context
- It's been on market 156 days — a 12% lower offer ($198k) is reasonable based on typical stale-listing flexibility.
Risks & watch-outs
- Climate carrying-cost: major wind risk, 27% chance of damaging wind over 30y; extreme-heat days projected 7→18/yr by 2055 (HVAC capex compounding) — expect insurance premiums to compound above CPI over the hold.
Questions for the listing agent
- What do current leases actually rent for vs. the listed asking? Can we see a recent rent roll and the last 12 months of T-12 income?
- It's been on market 156 days. Have you received any prior offers? Is the seller open to a 18% concession, seller financing, or rate buy-down credit?
- Why hasn't it sold? Are there any deal-killer items the seller is aware of (foundation, flood, title, zoning, code violations)?
- Is there a deadline driving the sale (1031 exchange, divorce, estate, relocation)? That informs how much negotiation room exists.
- The area grade is low — what's the realistic commute time and amenity access for the typical tenant pool here? Any planned neighborhood developments (good or bad) we should know about?
- What's the average days-on-market for RENTAL listings here right now (not sales)? A rising rental-DOM trend means longer vacancies and softer asking-rent achievability than the comps imply.
- What's the recent tenant-quality profile in this submarket — average credit score on applications, eviction rate, late-payment / NSF rate, and stable-employment percentage? A property-management company in the area should have these aggregated.
- How much new for-sale + rental construction is in the pipeline within 1–3 miles? Heavy new supply typically softens prices + rents 12–24 months out; constrained supply supports both.
Investment metrics
- 1% rule
- 0.82% ✗
- Cap rate
- 5.91%
- Cash-on-cash
- -1.38%
- DSCR
- 0.94
- GRM
- 10.2
CMA / ARV
- ARV (median comp)
- $242,733
- List price
- $224,900
- Delta
- -7.35%
- Verdict
- FAIR
- Comps
- 20 within 1.0 mi
Show comp detail 12 sales within ~0.75 mi
| Address | Dist | Beds/Ba | Sqft | Sold | Price | $/sf | Match |
|---|---|---|---|---|---|---|---|
| 290 Lori Ln | 0.22mi | 3/2.5 | 1,369 (-2%) | 2mo | $209,900 | $153 | 82 |
| 3085 Sandy Cir | 0.25mi | 4/2.0 (+1) | 1,387 (-1%) | 4mo | $270,000 | $195 | 78 |
| 6985 Winkfield Pl | 0.30mi | 3/1.5 | 1,350 (-4%) | 10mo | $192,000 | $142 | 69 |
| 2980 Creel Rd | 0.30mi | 3/2.5 | 1,377 (-2%) | 21mo | $209,500 | $152 | 64 |
| 2526 Wood Bend Ln | 0.61mi | 3/2.5 | 1,440 (+3%) | 2mo | $275,000 | $191 | 63 |
| 7010 Old Bethsaida Way | 0.06mi | 4/3.0 (+1) | 1,509 (+8%) | 18mo | $254,900 | $169 | 60 |
| 2725 Carolina Rdg | 0.46mi | 3/2.5 | 1,427 (+2%) | 23mo | $213,000 | $149 | 54 |
| 6850 Brown Dr S | 0.63mi | 3/2.0 | 1,344 (-4%) | 20mo | $207,000 | $154 | 47 |
| 7215 Buck Creek Dr | 0.58mi | 3/2.0 | 1,318 (-6%) | 20mo | $200,000 | $152 | 47 |
| 6878 Merrywood Dr | 0.69mi | 3/2.5 | 1,392 (-1%) | 22mo | $265,000 | $190 | 46 |
| 2535 Hallie Mill Rd | 0.68mi | 3/2.5 | 1,274 (-9%) | 14mo | $255,000 | $200 | 39 |
| 2497 Wood Bend Ln | 0.65mi | 3/2.5 | 1,226 (-12%) | 9mo | $213,000 | $174 | 39 |
Match score weights: distance 35% · size 25% · config 20% · recency 20%. Top-matched comps best support the ARV.
Projected returns pro-forma
-3.0% appreciation · 3.55% rent growth · sell at horizon
- IRR
- -18.0%
- Equity multiple
- 0.36×
- Total profit
- $-40,021
- Equity at exit
- $33,533
- IRR
- -9.1%
- Equity multiple
- 0.42×
- Total profit
- $-36,483
- Equity at exit
- $19,445
Cash invested: $62,972 (down + closing). Projections, not guarantees.
Landlord ↔ Tenant lean methodology
- Overall (STATE)
- 90 Strongly Landlord-Friendly
- State Georgia
- 90 Strongly Landlord-Friendly · R+3
- County
- — inherits STATE
- City
- — inherits STATE
ZIP-level market 30296
- Rents YoY
- 3.5%
- Active inventory
- 142
- Price-to-rent
- 10.2×
Monthly cashflow live
- Estimated rent
- $1,844 high interval (Pro) →
- Mortgage (P&I)
- −$1,179
- Tax from tax record
- −$256 /mo · $3,077/yr
- Insurance
- −$94
- HOA
- −$0
- Vacancy / Maint / Mgmt
- −$387
- Net cashflow
- $-72
Break-even live
Sensitivity live
| Price | -10% $55 | -5% $-9 | +0% $-72 | +5% $-136 | +10% $-200 |
|---|---|---|---|---|---|
| Rent | -10% $-218 | -5% $-145 | +0% $-72 | +5% $0 | +10% $73 |
| Rate | -1.0pp $41 | -0.5pp $-15 | base $-72 | +0.5pp $-131 | +1.0pp $-190 |
UW: 25.0% down · 7.5% · 30yr · 1.5% tax · 5.0% vac · 8.0% maint · 8.0% mgmt
Financing live
Cash to close
- Down payment
- $56,225
- Closing costs
- $6,747
- Reserves months
- —
- Total cash needed
- —
Loan-product check · same deal, 3 products live
Conventional
25% down · 7.5% · 30yr
- Down + closing
- —
- Monthly P&I
- —
- Monthly cashflow
- —
- DSCR
- —
- Eligible?
- —
Personal DTI + credit; lowest rate.
DSCR
20% down · 8.5% · 30yr
- Down + closing
- —
- Monthly P&I
- —
- Monthly cashflow
- —
- DSCR
- —
- Eligible?
- —
No personal income docs; deal must DSCR.
Hard money
10% down · 12.0% · 12mo
- Down + closing
- —
- Monthly P&I
- —
- Monthly cashflow
- —
- DSCR
- —
- Eligible?
- —
Short-term bridge; refi at stabilization.
Rent comps 30 comps
| Address | Beds | Baths | Sqft | Rent | $/sqft | DOM | Units | Dist |
|---|---|---|---|---|---|---|---|---|
| 2722 South Hills Riverdale, GA | 3.0 | 2.5 | 1722 | $2,175 | $1.26 | 1d | 1 | 0.29mi |
| 7060 Kimberly Mill Rd Atlanta, GA | 3.0 | 1.0 | 1056 | $1,425 | $1.35 | 7d | 1 | 0.30mi |
| 7060 Kimberly Mill Rd Atlanta, GA | 3.0 | 1.0 | 1056 | $1,425 | $1.35 | 1d | 1 | 0.30mi |
| 7045 Birling Dr Atlanta, GA | 4.0 | 3.0 | 1488 | $1,765 | $1.19 | 45d | 1 | 0.34mi |
| 3206 Pine Tree Trl Unit 15C Atlanta, GA | 3.0 | 2.5 | 1466 | $1,950 | $1.33 | 6d | 1 | 0.43mi |
| 2590 South Hills Riverdale, GA | 3.0 | 2.5 | 1850 | $2,005 | $1.08 | 14d | 1 | 0.48mi |
| 7210 Buck Creek Dr Fairburn, GA | 3.0 | 2.0 | 1140 | $1,666 | $1.46 | 1d | 1 | 0.53mi |
| 110 Fruitwood Trce Unit A Riverdale, GA | 3.0 | 2.0 | 1100 | $1,800 | $1.64 | 22d | 1 | 0.60mi |
| 2529 Wood Bend Ln Riverdale, GA | 3.0 | 2.5 | 1508 | $1,945 | $1.29 | 45d | 1 | 0.61mi |
| 105 Fruitwood Trce Unit A Riverdale, GA | 2.0 | 2.0 | 1012 | $1,395 | $1.38 | 1d | 1 | 0.62mi |
| 6985 Smoke Ridge Dr Fairburn, GA | 4.0 | 2.0 | 1054 | $1,820 | $1.73 | 1d | 1 | 0.64mi |
| 2550 Hallie Mill Rd Atlanta, GA | 3.0 | 2.0 | 1372 | $1,600 | $1.17 | 14d | 1 | 0.66mi |
| 7025 Brentwood Ct Riverdale, GA | 2.0 | 1.5 | 1124 | $1,425 | $1.27 | 45d | 1 | 0.67mi |
| 145 W Village Ct Riverdale, GA | 3.0 | 2.5 | 1284 | $1,840 | $1.43 | 1d | 1 | 0.73mi |
| 2405 Wood Bend Ln Riverdale, GA | 3.0 | 2.5 | 1396 | $1,800 | $1.29 | 45d | 1 | 0.76mi |
| 2820 Greenbower Ct Atlanta, GA | 3.0 | 2.0 | 1338 | $1,730 | $1.29 | 5d | 1 | 0.87mi |
| 3500 Keels Ln Atlanta, GA | 3.0 | 2.0 | 1272 | $1,755 | $1.38 | 3d | 1 | 1.06mi |
| 6500 Connell Rd Atlanta, GA | 3.0 | 2.0 | 1483 | $1,650 | $1.11 | 26d | 1 | 1.07mi |
| 6575 Smoke Ridge Dr Atlanta, GA | 4.0 | 2.0 | 1808 | $1,815 | $1.00 | 45d | 1 | 1.14mi |
| 6445 Connell Rd Atlanta, GA | 3.0 | 2.0 | 1357 | $1,856 | $1.37 | 45d | 1 | 1.17mi |
| 6440 Connell Rd Atlanta, GA | 3.0 | 2.0 | 1391 | $1,695 | $1.22 | 26d | 1 | 1.17mi |
| 6450 Peppermill Ln Atlanta, GA | 4.0 | 2.0 | 1188 | $1,531 | $1.29 | 26d | 1 | 1.21mi |
| 3800 Leisure Ln Atlanta, GA | 3.0 | 2.0 | 1198 | $2,350 | $1.96 | 24d | 1 | 1.24mi |
| 325 Pointer Ct Atlanta, GA | 3.0 | 2.0 | 1474 | $1,620 | $1.10 | 7d | 1 | 1.25mi |
| 3760 Cedar Hurst Way Atlanta, GA | 4.0 | 2.5 | 1595 | $2,150 | $1.35 | 12d | 1 | 1.32mi |
| 3105 Garnet Way Atlanta, GA | 3.0 | 2.0 | 1470 | $1,660 | $1.13 | 14d | 1 | 1.37mi |
| 6345 Peppermill Ln Atlanta, GA | 3.0 | 2.5 | 1224 | $1,800 | $1.47 | 45d | 1 | 1.37mi |
| 7495 Royale Ct Riverdale, GA | 4.0 | 3.0 | 1284 | $2,150 | $1.67 | 3d | 1 | 1.42mi |
| 2560 Foxlair Trl Atlanta, GA | 4.0 | 2.0 | 1485 | $1,795 | $1.21 | 26d | 1 | 1.42mi |
| 2667 Rocky Ct Atlanta, GA | 3.0 | 2.5 | 1432 | $2,200 | $1.54 | 45d | 1 | 1.48mi |
Listing history 8 events
-
2026-06-03days on market $224,900 Active 156 DOM
-
2026-06-01days on market $224,900 Active 154 DOM
-
2026-05-31days on market $224,900 Active 153 DOM
-
2025-12-29$224,900 New 541-char remark
Show marketing remark (541 chars)
2820 Robinson Wood Dr, Riverdale, GA 30296, is a charming residential home located in a quiet and established neighborhood. This spacious property features a cozy yet functional layout with multiple bedrooms and bathrooms, perfect for families or those looking for extra space. The house boasts an inviting exterior with a well-maintained lawn and a private backyard, ideal for outdoor gatherings and relaxation. Inside, you'll find a bright and airy living area, a modern kitchen with updated appliances, and generous room sizes throughout.
-
2021-12-30soldstatus $5,953,114
-
2018-10-19soldstatus $1,611,200
-
1995-12-27soldstatus $67,000
-
1991-02-14soldstatus $73,900
ⓘ Source: listings_history table (triggers on properties + properties_extension) + one-shot
backfill from property_details.listing_events for pre-trigger history.
Tax reassessment forecast GA · Resets to sale price
- Current annual tax
- $3,077 · $256/mo
- Projected year-2 tax
- $3,077 · $256/mo
- Expected delta
- $0/yr ($0/mo · 0.0%)
ⓘ Screening estimate from a state-policy table — verify with the county assessor before closing.
Climate risk First Street
- Flood 1/10 Low FEMA zone X (unshaded) · 0% chance over 30 yrs
- Wildfire 4/10 Moderate
- Heat 6/10 Major 7 d/yr ≥104°F today · 18 d/yr by 30 yrs out
- Wind 6/10 Major 27% chance of damaging wind over 30 yrs
- Air quality 4/10 Moderate 4 unhealthy d/yr today · 6 by 30 yrs out
Nearby sold comps map
Loading sold comps map…
Walkable amenities ~0.75 mi
Loading nearby amenities…
Taxation est. · year 1
- Rental income
- $22,132
- − Mortgage interest
- −$12,598
- − Property taxes
- −$3,077
- − Insurance
- −$1,124
- − Repairs & maintenance
- −$1,771
- − Management
- −$1,771
- − Depreciation
- −$6,543
- Taxable loss
- −$4,751
- Est. tax savings @ 24.0%
- +$1,140
- After-tax cash flow
- $270/yr
For passive investors: Depreciation is non-cash, so a rental often shows a tax loss while cash-flowing — sheltering income. Rental losses are passive: they offset passive income freely, and up to $25,000/yr can offset ordinary (W-2) income if you actively participate and your MAGI is under $100k (phasing out to $0 by $150k); unused losses carry forward. On sale, claimed depreciation is recaptured at up to 25%, and gains may owe capital-gains tax (a 1031 exchange can defer both). Figures are a year-1 estimate at your 24.0% rate — not tax advice; consult a CPA.
Schools (NCES district)
- District
- Fulton County
- NCES district ID
- 1302280
- Math proficiency
- 49% ▼ -2.00%
- Reading proficiency
- 53% ▬ 0.00%
- Median HH income
- $68,035
- Composite
- 45.33/100
- National rank
- #2640
- State rank
- #12 of 174 in GA
Livability — South Fulton
No livability data for this city. (Only ~50 U.S. cities are tracked.)
Census & demographics
- Census place
- South Fulton, GA
- County
- Clayton County · 230,153 people
- City population
- 127,674
- Metro
- Atlanta-Sandy Springs-Alpharetta, GA
- Population (ZIP)
- 27,045
- Household income
- $63,292
- Rent vs Own
- Severe rent burden
- 1400.0
Population outlook (Fulton County) Hauer SSP2
- Today (2025)
- 1,203,707 people
- By 2030
- 1,299,706 · +8.0%
- By 2040
- 1,488,256 · +23.6%
- By 2050
- 1,664,580 · +38.3%
- By 2075
- 2,036,072 · +69.2%
- By 2100
- 2,222,402 · +84.6%
Race, ethnicity, and origin ACS 2023
- Neighborhood character
- Predominantly Black (81%)
- Race & ethnicity
- Black 81% Hispanic / Latino 10% White 4% Asian 4% Two or more races 4%
- Hispanic origin (detail)
- Mexican 7%
- Common ancestry
- Hispanic 2%
- Foreign-born
- 14% · Canada, China, Vietnam
- Languages at home
- 80% English-only · Spanish 9% Chinese 3% French/Haitian/Cajun 2%
Political lean MEDSL · Fulton
- 2024 margin
- Solid D (+44.9) · D 71.9% · R 27.0% · Other 1.1%
- 2008→2024 swing
- +9.8pp toward D · 2008: 35.0pp · 2024: 44.9pp
- All cycles
- 2024: D+44.9 2020: D+46.4 2016: D+42.1 2012: D+29.6 2008: D+35.0
Not yet ingested
- Civics
- —
Market trends
- HPI YoY
- ▼ -137.25%
- Current HPI
- 209.7527
- Rent YoY
- ▲ 3.55%
- Metro
- Atlanta-Sandy Springs-Alpharetta, GA
- State GDP YoY
- ▲ 2.66%
- F500 in state
- 28
Industry mix (Fortune 500 HQ in GA)
| Industry | F500 HQs | Revenue |
|---|---|---|
| Paper / Packaging | 2 | $29B |
|
||
| Retail | 1 | $160B |
|
||
| Transportation / Logistics | 1 | $91B |
|
||
| Airlines | 1 | $62B |
|
||
| Consumer Goods | 1 | $47B |
|
||
| Utilities | 1 | $25B |
|
||
Price history
+204.3% since first listed5 events — show timeline
- 2025-12-29 Listed $224,900 GAMLS
- 2021-12-30 Sold (Public Records) $5,953,114 Public Records
- 2018-10-19 Sold (Public Records) $1,611,200 Public Records
- 1995-12-27 Sold (Public Records) $67,000 Public Records
- 1991-02-14 Sold (Public Records) $73,900 Public Records
Property tax history
+9.4%/yrLatest (2025): $3,077 · -0.0% YoY. Source: county tax records.
Cash-flow waterfall
monthlySold comps — $/sqft
last 12 mo · ≤1 miLoading sold comps…