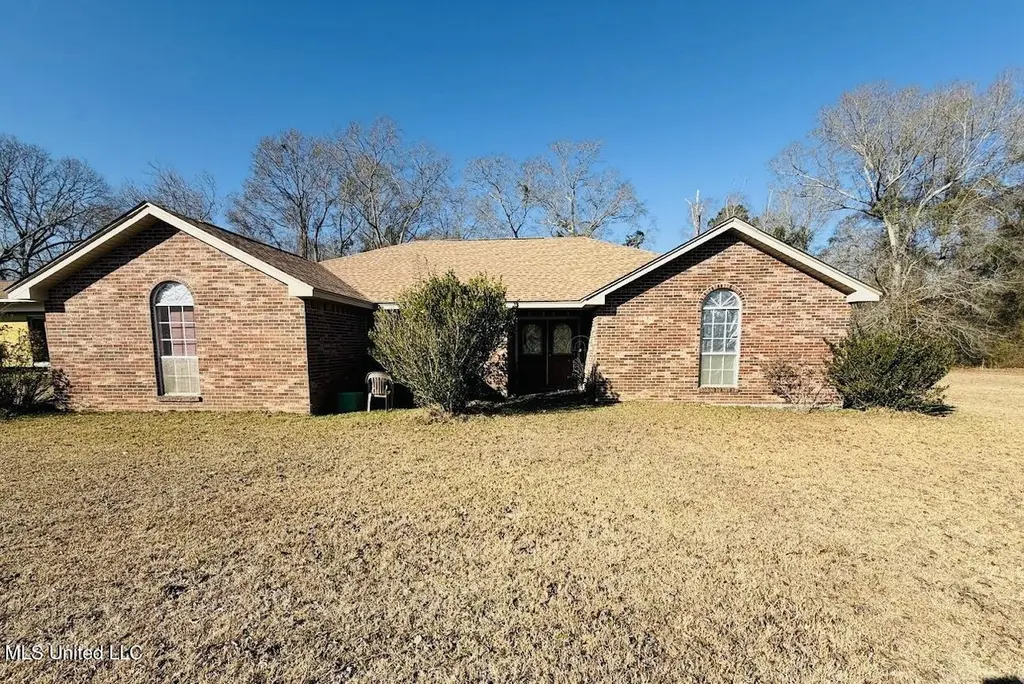
27101 Highway 53 · Saucier, MS
Flood risk 1/10 · Minimal
- FEMA flood zone
- X (unshaded)
- Chance of flooding over 30 yrs
- 0.0%
- Est. flood insurance / yr
- $507 – $1,088
Fire risk 8/10 · Major
- Est. fire insurance / yr
- $1,241 – $2,305
Heat risk 9/10 · Severe
- Hot days now (above 109°F)
- 7 days/yr
- Hot days in 30 yrs
- 20 days/yr
Wind risk 9/10 · Severe
- Chance of severe wind over 30 yrs
- 99.0%
Air-quality risk 1/10 · Minimal
- Unhealthy air days now
- 0 days/yr
- Unhealthy air days in 30 yrs
- 0 days/yr
Risk factors via First Street. Map © Google.
Why this score? — see what drove the D+ grade
The composite is a weighted blend of 9 inputs, each scored 0–100. Each bar is that input's sub-score; the figure is the points it added to the 100-point composite (weight × sub-score).
- ARV discount +15.0/15.0
- Cash flow +14.0/30.0
- DSCR +4.2/10.0
- Schools +4.2/10.0
- Livability +3.3/5.0
- 1% rule +2.8/10.0
- Rent growth +2.5/5.0
- Condition / age +2.5/5.0
- Appreciation +0.0/10.0
$236,500
🖨 Deal sheet (PDF) 📄 Offer letter ✓ Due diligence
Listing remarks
REDUCED! REDUCED! REDUCED!! Second dwelling will be removed prior to closing!!! Discover the perfect blend of space, comfort, and peaceful country living at this beautiful property situated on 2.5 acres in Saucier. This spacious home features 4 bedrooms, 2 bathrooms, and over 2,000 square feet of living space, offering plenty of room for a growing family, working from home, or hosting guests. The open and inviting layout provides a warm and welcoming atmosphere, while the expansive yard offers endless possibilities for outdoor activities, gardening, pets, and future projects. Whether you're looking for privacy, space to spread out, or a place to build lasting memories, this home delivers i
Key facts
- 2.5 acre lot
- Built 1998
- Listed 133 days
Neighborhood map
What this means for you Summary
Snapshot
- This is a 4-bed/1.0-bath single-family listed at $236k.
Deal economics
- At list price, monthly cash flow is $30 ($359/yr) — positive.
- The deal already cash-flows at list — no discount required.
- To meet the 1% rule (rent ≥ 1% of price), the offer needs to be $184k (22.1% below list).
- Recommended offer: $184k (22.1% below list) — sets the bar for 1% rule.
- Cap rate 6.4% vs local median 4.4% in Saucier — top-decile yield for the area; either an underpriced asset or a hidden risk that comps aren't pricing in. Stress-test before assuming the spread holds.
Location & tenants
- Location reads 66/100 on livability (#91 in MS) — a middle-class / working-renter tenant base. Strengths: crime A+, cost of living A+; Watch: amenities F, commute F, health & safety F.
- Harrison County School District (rural): math 52% / reading 46% proficiency, ranked #14 of 130 in MS (top 11%) — families likely to look elsewhere, expect single-tenant / working-renter base with shorter leases; 62% free/reduced lunch — lower-income household profile, screen leases tightly.
- Market conditions: 126 active listings in the ZIP; 2,194 units permitted in Harrison County in 2024 (0 in 5+ unit buildings).
Forward outlook
- Local home prices are declining (-3.0%/yr); year-one equity from $2k of loan paydown is wiped out by about $7k of value loss. Plan a longer hold.
- Harrison County population projected at +27% by 2050 — long-run rental-demand tailwind backs the buy-and-hold thesis.
Negotiation context
- It's been on market 133 days — a 12% lower offer ($208k) is reasonable based on typical stale-listing flexibility.
Risks & watch-outs
- Climate carrying-cost: severe wind risk, 99% chance of damaging wind over 30y; severe wildfire risk; extreme-heat days projected 7→20/yr by 2055 (HVAC capex compounding) — expect insurance premiums to compound above CPI over the hold.
Questions for the listing agent
- It's been on market 133 days. Have you received any prior offers? Is the seller open to a 22% concession, seller financing, or rate buy-down credit?
- Why hasn't it sold? Are there any deal-killer items the seller is aware of (foundation, flood, title, zoning, code violations)?
- Is there a deadline driving the sale (1031 exchange, divorce, estate, relocation)? That informs how much negotiation room exists.
- The area grade is low — what's the realistic commute time and amenity access for the typical tenant pool here? Any planned neighborhood developments (good or bad) we should know about?
- What's the average days-on-market for RENTAL listings here right now (not sales)? A rising rental-DOM trend means longer vacancies and softer asking-rent achievability than the comps imply.
- What's the recent tenant-quality profile in this submarket — average credit score on applications, eviction rate, late-payment / NSF rate, and stable-employment percentage? A property-management company in the area should have these aggregated.
- How much new for-sale + rental construction is in the pipeline within 1–3 miles? Heavy new supply typically softens prices + rents 12–24 months out; constrained supply supports both.
Investment metrics
- 1% rule
- 0.78% ✗
- Cap rate
- 6.44%
- Cash-on-cash
- 0.54%
- DSCR
- 1.02
- GRM
- 10.7
CMA / ARV
- ARV (median comp)
- $446,212
- List price
- $236,500
- Delta
- -47.00%
- Verdict
- UNDERPRICED
- Comps
- 1 within 2.0 mi
Projected returns pro-forma
-3.0% appreciation · 3.0% rent growth · sell at horizon
- IRR
- -15.5%
- Equity multiple
- 0.45×
- Total profit
- $-36,516
- Equity at exit
- $35,263
- IRR
- -7.1%
- Equity multiple
- 0.55×
- Total profit
- $-29,749
- Equity at exit
- $20,448
Cash invested: $66,220 (down + closing). Projections, not guarantees.
Landlord ↔ Tenant lean methodology
- Overall (STATE)
- 90 Strongly Landlord-Friendly
- State Mississippi
- 90 Strongly Landlord-Friendly · R+11
- County
- — inherits STATE
- City
- — inherits STATE
ZIP-level market 39574
- Home prices YoY
- -23.8%
- Active inventory
- 126
- Price-to-rent
- 10.7×
Monthly cashflow live
- Estimated rent
- $1,843 medium interval (Pro) →
- Mortgage (P&I)
- −$1,240
- Tax from tax record
- −$87 /mo · $1,049/yr
- Insurance
- −$99
- HOA
- −$0
- Vacancy / Maint / Mgmt
- −$387
- Net cashflow
- $30
Break-even live
Sensitivity live
| Price | -10% $164 | -5% $97 | +0% $30 | +5% $-37 | +10% $-104 |
|---|---|---|---|---|---|
| Rent | -10% $-116 | -5% $-43 | +0% $30 | +5% $103 | +10% $176 |
| Rate | -1.0pp $149 | -0.5pp $90 | base $30 | +0.5pp $-31 | +1.0pp $-94 |
UW: 25.0% down · 7.5% · 30yr · 1.5% tax · 5.0% vac · 8.0% maint · 8.0% mgmt
Financing live
Cash to close
- Down payment
- $59,125
- Closing costs
- $7,095
- Reserves months
- —
- Total cash needed
- —
Loan-product check · same deal, 3 products live
Conventional
25% down · 7.5% · 30yr
- Down + closing
- —
- Monthly P&I
- —
- Monthly cashflow
- —
- DSCR
- —
- Eligible?
- —
Personal DTI + credit; lowest rate.
DSCR
20% down · 8.5% · 30yr
- Down + closing
- —
- Monthly P&I
- —
- Monthly cashflow
- —
- DSCR
- —
- Eligible?
- —
No personal income docs; deal must DSCR.
Hard money
10% down · 12.0% · 12mo
- Down + closing
- —
- Monthly P&I
- —
- Monthly cashflow
- —
- DSCR
- —
- Eligible?
- —
Short-term bridge; refi at stabilization.
Listing history 22 events
-
2026-06-18days on market $236,500 Active 133 DOM
-
2026-06-17days on market $236,500 Active 132 DOM
-
2026-06-16days on market $236,500 Active 131 DOM
-
2026-06-15days on market $236,500 Active 130 DOM
-
2026-06-14days on market $236,500 Active 128 DOM
-
2026-06-13days on market $236,500 Active 127 DOM
-
2026-06-10days on market $236,500 Active 125 DOM
-
2026-06-09days on market $236,500 Active 124 DOM
-
2026-06-08days on market $236,500 Active 123 DOM
-
2026-06-07remarks 699-char remark
-
2026-06-07pricedays on market $236,500 Active 122 DOM
-
2026-06-02days on market $237,500 Active 117 DOM
-
2026-06-01days on market $237,500 Active 116 DOM
-
2026-05-31days on market $237,500 Active 115 DOM
-
2026-05-30days on market $237,500 Active 114 DOM
-
2026-05-07price $237,500
-
2026-03-02price $247,500
-
2026-02-20price $252,500
-
2026-02-11price $254,900
-
2026-02-05$259,900 Active
-
2017-05-22soldstatus
-
2007-09-14soldstatus
ⓘ Source: listings_history table (triggers on properties + properties_extension) + one-shot
backfill from property_details.listing_events for pre-trigger history.
Tax reassessment forecast MS · Resets to sale price
- Current annual tax
- $1,049 · $87/mo
- Projected year-2 tax
- $1,868 · $156/mo
- Expected delta
- +$819/yr (+$68/mo · 78.0%)
ⓘ Screening estimate from a state-policy table — verify with the county assessor before closing.
Climate risk First Street
- Flood 1/10 Low FEMA zone X (unshaded) · 0% chance over 30 yrs
- Wildfire 8/10 Severe
- Heat 9/10 Extreme 7 d/yr ≥109°F today · 20 d/yr by 30 yrs out
- Wind 9/10 Extreme 99% chance of damaging wind over 30 yrs
- Air quality 1/10 Low 0 unhealthy d/yr today · 0 by 30 yrs out
Nearby sold comps map
Loading sold comps map…
Walkable amenities ~0.75 mi
Loading nearby amenities…
Taxation est. · year 1
- Rental income
- $22,119
- − Mortgage interest
- −$13,248
- − Property taxes
- −$1,049
- − Insurance
- −$1,182
- − Repairs & maintenance
- −$1,770
- − Management
- −$1,770
- − Depreciation
- −$6,880
- Taxable loss
- −$3,780
- Est. tax savings @ 24.0%
- +$907
- After-tax cash flow
- $1,266/yr
For passive investors: Depreciation is non-cash, so a rental often shows a tax loss while cash-flowing — sheltering income. Rental losses are passive: they offset passive income freely, and up to $25,000/yr can offset ordinary (W-2) income if you actively participate and your MAGI is under $100k (phasing out to $0 by $150k); unused losses carry forward. On sale, claimed depreciation is recaptured at up to 25%, and gains may owe capital-gains tax (a 1031 exchange can defer both). Figures are a year-1 estimate at your 24.0% rate — not tax advice; consult a CPA.
Schools (NCES district)
- District
- Harrison County School District
- NCES district ID
- 2801770
- Math proficiency
- 52% ▼ -4.00%
- Reading proficiency
- 46% ▼ -4.00%
- Median HH income
- $46,504
- Composite
- 41.66/100
- National rank
- #3419
- State rank
- #14 of 130 in MS
Livability — Saucier
- Score
- 66/100
- State rank
- #91
- US rank
- #11386
Category grades
Schools grade is shown separately in the Schools card above.
Census & demographics
- Population (ZIP)
- 13,830
Population outlook (Harrison County) Hauer SSP2
- Today (2025)
- 228,444 people
- By 2030
- 241,942 · +5.9%
- By 2040
- 267,531 · +17.1%
- By 2050
- 291,062 · +27.4%
- By 2075
- 346,711 · +51.8%
- By 2100
- 378,165 · +65.5%
Race, ethnicity, and origin ACS 2023
- Neighborhood character
- Predominantly White (90%)
- Race & ethnicity
- White 90% Black 5% Two or more races 4%
- Common ancestry
- Lithuanian 10% Italian 5% Romanian 2%
- Foreign-born
- 0%
Political lean MEDSL · Harrison
- 2024 margin
- Strong R (+28.9) · D 35.0% · R 63.9% · Other 1.1%
- 2008→2024 swing
- -2.9pp toward R · 2008: -26.0pp · 2024: -28.9pp
- All cycles
- 2024: R+28.9 2020: R+25.2 2016: R+30.7 2012: R+26.6 2008: R+26.0
Not yet ingested
- Civics
- —
Market trends
- HPI YoY
- ▼ -64.24%
- Current HPI
- 206.218
- Rent YoY
- —
- Metro
- —
- State GDP YoY
- —
- F500 in state
- 0
Price history
-8.6% since first listed7 events — show timeline
- 2026-05-07 Price Changed $237,500 MLSU
- 2026-03-02 Price Changed $247,500 MLSU
- 2026-02-20 Price Changed $252,500 MLSU
- 2026-02-11 Price Changed $254,900 MLSU
- 2026-02-05 Listed $259,900 MLSU
- 2017-05-22 Sold (Public Records) — Public Records
- 2007-09-14 Sold (Public Records) — Public Records
Property tax history
+1.0%/yrLatest (2025): $1,049 · +7.7% YoY. Source: county tax records.
Cash-flow waterfall
monthlySold comps — $/sqft
last 12 mo · ≤1 miLoading sold comps…