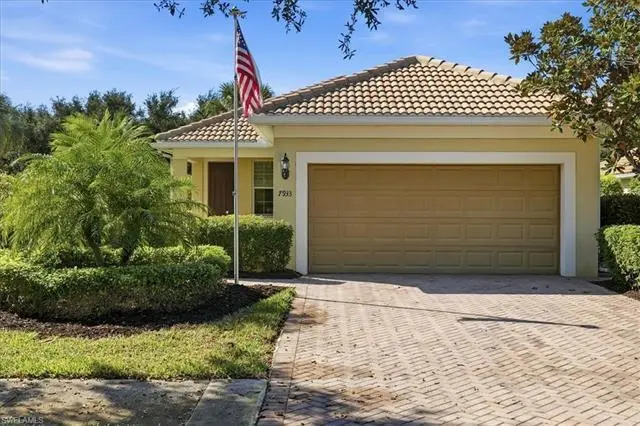
7933 Guadiana Way · Ave Maria, FL
Flood risk 1/10 · Minimal
- FEMA flood zone
- X (unshaded)
- Chance of flooding over 30 yrs
- 0.0%
- Est. flood insurance / yr
- $507 – $1,088
Fire risk 5/10 · Moderate
- Est. fire insurance / yr
- $947 – $1,759
Heat risk 10/10 · Severe
- Hot days now (above 112°F)
- 7 days/yr
- Hot days in 30 yrs
- 28 days/yr
Wind risk 10/10 · Severe
- Chance of severe wind over 30 yrs
- 99.0%
Air-quality risk 2/10 · Minimal
- Unhealthy air days now
- 0 days/yr
- Unhealthy air days in 30 yrs
- 1 days/yr
Risk factors via First Street. Map © Google.
Why this score? — see what drove the B- grade
The composite is a weighted blend of 9 inputs, each scored 0–100. Each bar is that input's sub-score; the figure is the points it added to the 100-point composite (weight × sub-score).
- Cash flow +24.4/30.0
- 1% rule +8.1/10.0
- DSCR +7.9/10.0
- ARV discount +7.5/15.0
- Schools +5.0/10.0
- Appreciation +4.5/10.0
- Rent growth +3.2/5.0
- Livability +2.5/5.0
- Condition / age +2.5/5.0
$345,000
🖨 Deal sheet 📄 Offer letter ✓ Due diligence
Listing remarks
Welcome Home to the Pulte built Taft model in the desirable Bellera Walk neighborhood situated in the Del Webb 55+ community located in Ave Maria, FL. This home is surrounded by beautiful landscaped areas on the back and one side of the home, offering a tranquil park-like setting for hours of relaxation time. The perfect home for year round or seasonal stays away from the cold days of winter up North. This is a 3 bedroom, 2 bath home with a 2 car garage. The large living room with plenty of windows offers lots of light to this home. The kitchen is situated at the rear of the home overlooking the park-like setting. Step through the sliding glass door in your kitchen where you can sit and rel
Key facts
- Landscaped areas
- Large living room
- 7,840 sq ft lot
Tags
Property features AI
Finance
- Other: Deeded restrictions: no commercial use and no RVs
- Financial info: Total annual recurring community fees disclosed; One-time community fees disclosed
- HOA & community: Mandatory HOA; Quarterly HOA fees; Master HOA fee assessed quarterly; HOA maintenance covers cable, internet/WiFi, lawn/land maintenance, manager, street lights, street maintenance and trash removal; Managed by developer; Community amenities include clubhouse, community pool and room, exercise room, golf course (public), tennis and pickleball courts, bocce, bike/jog paths, dog park, park, library, restaurant, shopping, sauna, beauty salon, BBQ/picnic area, hobby room, underground utilities and sidewalks; Gated, golf-course community
Exterior
- Parking: Attached 2-car garage; Paved driveway
- Security: Gated community; Manual storm shutters
- Utilities: Central water; Central sewer; Cable available
- Home design: Single-family, 1-story ranch style; Rear exposure faces southwest; Located in the Ave Maria community (BELLERA WALK)
- Construction: Built in 2012; Concrete block construction; Stucco exterior; Tile roof; Single-hung windows; Regular lot
- Exterior features: Patio; Automatic sprinkler system; Landscaped area/view; Central irrigation
Interior
- Kitchen: Pantry; Dishwasher; Disposal; Microwave; Range; Refrigerator/Freezer; Eat-in kitchen and dining area open to living
- Bedrooms: 3 bedrooms with a split bedroom floor plan
- Flooring: Carpet; Tile
- Bathrooms: 2 full bathrooms; Master bath with dual sinks and a shower (no tub)
- Heating & cooling: Central electric heat; Central electric cooling with ceiling fans
- Interior features: Cable prewire and high-speed internet available; Pantry; Smoke detectors; Walk-in closet; Window coverings; Turnkey furnished; Den/Study; Screened lanai/porch
- Laundry & utility: Laundry in residence with washer and dryer; Auto garage door
Neighborhood map
What this means for you Summary
Snapshot
- This is a 3-bed/2.0-bath single-family listed at $345k.
Deal economics
- At list price, monthly cash flow is $699 ($8k/yr) — positive.
- The deal already cash-flows at list — no discount required.
- Meets the 1% rule at list price ($5k rent vs $345k).
- Recommended offer: $340k (1.5% below list) — sets the bar for market timing.
Location & tenants
- Location reads: area grade B — affects rentability + tenant quality, not the cash-flow math above.
- Collier (suburban): math 60% / reading 56% proficiency, ranked #16 of 73 in FL (top 22%) — acceptable for families but not a draw, mixed tenant base, ~2y average lease.
- Zoned schools: Estates Elementary School (math 70% / reading 67%, grade B+, #409 of 2,144 statewide, top 20%, 862 students, 53% FRL); Palmetto Ridge High School (math 43% / reading 51%, grade D-, #207 of 667 statewide, top 32%, 2,347 students, 38% FRL).
- Market conditions: Rents rising (+3.0%/yr); 449 active listings in the ZIP; 40 comparable units currently listed for rent nearby; rentals at typical pace (median 24d on market — plan ~3-4 weeks tenant-placement turnaround); 3,520 units permitted in Collier County in 2024 (959 in 5+ unit buildings).
- At $4,525/mo this rent would consume 87% of the median local household income ($62k/yr) (locally 1093% of renters already pay >50% of income on rent) — very limited rent-growth headroom before tenants either downsize or default.
Forward outlook
- Local home prices are declining (-1.1%/yr); year-one equity from $2k of loan paydown is wiped out by about $4k of value loss. Plan a longer hold.
- Collier County population projected at +30% by 2050 — long-run rental-demand tailwind backs the buy-and-hold thesis.
- At projected returns (-1.1% appreciation + 3.0% rent growth), your $97k cash investment doubles in ~9 years — after that, you're playing with house money.
Negotiation context
- It's been on market 23 days — a 2% lower offer ($340k) is reasonable based on typical stale-listing flexibility.
- 3 sale attempts with the ask held roughly flat each time — persistent listings suggest the price (not the market) is what's stuck; bring a comps-based counter.
Risks & watch-outs
- Climate carrying-cost: severe wind risk, 99% chance of damaging wind over 30y; moderate wildfire risk; extreme-heat days projected 7→28/yr by 2055 (HVAC capex compounding) — expect insurance premiums to compound above CPI over the hold.
Questions for the listing agent
- What does the HOA fee cover, when was the last increase, and are there any pending special assessments or reserve-fund shortfalls?
- Is there a deadline driving the sale (1031 exchange, divorce, estate, relocation)? That informs how much negotiation room exists.
- What's the average days-on-market for RENTAL listings here right now (not sales)? A rising rental-DOM trend means longer vacancies and softer asking-rent achievability than the comps imply.
- What's the recent tenant-quality profile in this submarket — average credit score on applications, eviction rate, late-payment / NSF rate, and stable-employment percentage? A property-management company in the area should have these aggregated.
- How much new for-sale + rental construction is in the pipeline within 1–3 miles? Heavy new supply typically softens prices + rents 12–24 months out; constrained supply supports both.
Investment metrics
- 1% rule
- 1.31% ✓
- Cap rate
- 8.72%
- Cash-on-cash
- 8.68%
- DSCR
- 1.39
- GRM
- 6.4
CMA / ARV
No comps found within radius.
Projected returns pro-forma
-1.05% appreciation · 2.95% rent growth · sell at horizon
- IRR
- 4.2%
- Equity multiple
- 1.19×
- Total profit
- $17,927
- Equity at exit
- $82,481
- IRR
- 10.7%
- Equity multiple
- 2.04×
- Total profit
- $100,828
- Equity at exit
- $85,933
Cash invested: $96,600 (down + closing). Projections, not guarantees.
Landlord ↔ Tenant lean methodology
- Overall (STATE)
- 87 Strongly Landlord-Friendly
- State Florida
- 87 Strongly Landlord-Friendly · R+3
- County
- — inherits STATE
- City
- — inherits STATE
ZIP-level market 34142
- Home prices YoY
- -0.5%
- Rents YoY
- 3.0%
- Active inventory
- 449
- Price-to-rent
- 6.4×
Monthly cashflow live
- Estimated rent
- $4,525 high interval (Pro) →
- Mortgage (P&I)
- −$1,809
- Tax from tax record
- −$451 /mo · $5,411/yr
- Insurance
- −$144
- HOA
- −$472
- Vacancy / Maint / Mgmt
- −$950
- Net cashflow
- $699
Break-even live
UW: 25.0% down · 7.5% · 30yr · 1.5% tax · 5.0% vac · 8.0% maint · 8.0% mgmt
Financing live
Cash to close
- Down payment
- $86,250
- Closing costs
- $10,350
- Reserves months
- —
- Total cash needed
- —
Loan-product check · same deal, 3 products live
Conventional
25% down · 7.5% · 30yr
- Down + closing
- —
- Monthly P&I
- —
- Monthly cashflow
- —
- DSCR
- —
- Eligible?
- —
Personal DTI + credit; lowest rate.
DSCR
20% down · 8.5% · 30yr
- Down + closing
- —
- Monthly P&I
- —
- Monthly cashflow
- —
- DSCR
- —
- Eligible?
- —
No personal income docs; deal must DSCR.
Hard money
10% down · 12.0% · 12mo
- Down + closing
- —
- Monthly P&I
- —
- Monthly cashflow
- —
- DSCR
- —
- Eligible?
- —
Short-term bridge; refi at stabilization.
Rent comps 40 comps
| Address | Beds | Baths | Sqft | Rent | $/sqft | DOM | Units | Dist |
|---|---|---|---|---|---|---|---|---|
| 8010 Helena Ct Ave Maria, FL | 2.0 | 2.0 | 1554 | $2,500 | $1.61 | 21d | 1 | 0.15mi |
| 5629 Double Eagle Cir #4217 Ave Maria, FL | 2.0 | 2.0 | 1154 | $5,795 | $5.02 | 23d | 1 | 0.20mi |
| 5651 Double Eagle Cir #4316 Ave Maria, FL | 2.0 | 2.0 | 1154 | $5,495 | $4.76 | 23d | 1 | 0.20mi |
| 5835 Double Eagle Cir #4726 Ave Maria, FL | 2.0 | 2.0 | 1154 | $2,095 | $1.82 | 13d | 1 | 0.20mi |
| 5704 Melbourne Ct #6712 Ave Maria, FL | 3.0 | 2.0 | 1741 | $7,295 | $4.19 | 23d | 1 | 0.20mi |
| 5715 Double Eagle Cir #4416 Ave Maria, FL | 2.0 | 2.0 | 1154 | $2,100 | $1.82 | 23d | 1 | 0.20mi |
| 6039 Ellerston WAY #2017 Ave Maria, FL | 2.0 | 2.0 | 1355 | $6,295 | $4.65 | 23d | 1 | 0.20mi |
| 5629 Double Eagle Cir #4218 Ave Maria, FL | 3.0 | 2.0 | 1301 | $6,295 | $4.84 | 23d | 1 | 0.20mi |
| 5710 Melbourne Ct #6511 Ave Maria, FL | 3.0 | 2.0 | 1741 | $7,295 | $4.19 | 23d | 1 | 0.20mi |
| 5629 Double Eagle Cir #4223 Ave Maria, FL | 2.0 | 2.0 | 1154 | $2,395 | $2.08 | 23d | 1 | 0.20mi |
| 6036 Ellerston WAY #1311 Ave Maria, FL | 3.0 | 2.0 | 1741 | $4,490 | $2.58 | 23d | 1 | 0.20mi |
| 5651 Double Eagle Cir #4338 Ave Maria, FL | 2.0 | 2.0 | 1301 | $6,295 | $4.84 | 23d | 1 | 0.20mi |
| 5445 Double Eagle Cir #3011 Ave Maria, FL | 2.0 | 2.0 | 1569 | $2,495 | $1.59 | 23d | 1 | 0.20mi |
| 5835 Double Eagle CIR #4714 Ave Maria, FL | 2.0 | 2.0 | 1120 | $1,895 | $1.69 | 23d | 1 | 0.20mi |
| 6205 Harmony Dr Immokalee, FL | 3.0 | 2.0 | 1558 | $5,000 | $3.21 | 23d | 1 | 0.32mi |
| 6189 Harmony Dr Immokalee, FL | 3.0 | 2.0 | 1558 | $6,295 | $4.04 | 23d | 1 | 0.32mi |
| 6082 National Blvd Ave Maria, FL | 2.0 | 2.0 | 1366 | $4,145 | $3.03 | 23d | 2 | 0.35mi |
| 6168 Harmony Dr Immokalee, FL | 3.0 | 2.0 | 1570 | $5,495 | $3.50 | 13d | 1 | 0.36mi |
| 6023 Ellerston Way #1823 Ave Maria, FL | 3.0 | 2.0 | 1695 | $2,995 | $1.77 | 23d | 1 | 0.39mi |
| 5909 Berwick Ln Ave Maria, FL | 2.0 | 2.0 | 1850 | $10,995 | $5.94 | 23d | 1 | 0.41mi |
| 6058 National Blvd #343 Ave Maria, FL | 2.0 | 2.0 | 1194 | $4,000 | $3.35 | 23d | 1 | 0.45mi |
| 6058 National Blvd #335 Ave Maria, FL | 2.0 | 2.0 | 1120 | $5,795 | $5.17 | 13d | 1 | 0.45mi |
| 6058 National Blvd Ave Maria, FL | 2.0–3.0 | 2.0 | 1210 | $5,795 | $4.79 | 23d | 2 | 0.45mi |
| 6046 National Blvd Ave Maria, FL | 2.0 | 2.0 | 1154 | $4,395 | $3.81 | 23d | 2 | 0.49mi |
| 6034 National Blvd Ave Maria, FL | 2.0 | 2.0 | 1137 | $4,046 | $3.56 | 13d | 3 | 0.55mi |
| 5428 Double Eagle Cir #2517 Ave Maria, FL | 2.0 | 2.0 | 1355 | $2,695 | $1.99 | 23d | 1 | 0.55mi |
| 5410 Double Eagle Cir #2222 Ave Maria, FL | 2.0 | 2.0 | 1355 | $2,395 | $1.77 | 23d | 1 | 0.55mi |
| 5433 Double Eagle Cir #2915 Ave Maria, FL | 2.0 | 2.0 | 1366 | $6,295 | $4.61 | 21d | 1 | 0.58mi |
| 5835 Double Eagle Cir Unit 4742 Ave Maria, FL | 2.0 | 2.0 | 1154 | $5,795 | $5.02 | 23d | 1 | 0.59mi |
| 5807 Double Eagle Cir #4631 Ave Maria, FL | 3.0 | 2.0 | 1301 | $5,695 | $4.38 | 23d | 1 | 0.59mi |
| 5433 Double Eagle Cir Ave Maria, FL | 2.0 | 2.0 | 1366 | $3,295 | $2.41 | 23d | 1 | 0.59mi |
| 5427 Double Eagle Cir #2812 Ave Maria, FL | 2.0 | 2.0 | 1355 | $2,395 | $1.77 | 13d | 1 | 0.61mi |
| 5427 Double Eagle Cir Ave Maria, FL | 2.0 | 2.0 | 1355 | $2,995 | $2.21 | 23d | 1 | 0.61mi |
| 5466 Double Eagle Cir #3425 Ave Maria, FL | 2.0 | 2.0 | 1355 | $5,995 | $4.42 | 23d | 1 | 0.62mi |
| 5478 Double Eagle Cir #3515 Ave Maria, FL | 2.0 | 2.0 | 1355 | $2,395 | $1.77 | 23d | 1 | 0.63mi |
| 5478 Double Eagle Cir #3521 Ave Maria, FL | 2.0 | 2.0 | 1569 | $4,995 | $3.18 | 23d | 1 | 0.66mi |
| 5454 Double Eagle Cir #3325 Ave Maria, FL | 2.0 | 2.0 | 1355 | $2,495 | $1.84 | 23d | 1 | 0.67mi |
| 5479 Double Eagle Cir #3626 Ave Maria, FL | 2.0 | 2.0 | 1154 | $2,200 | $1.91 | 13d | 1 | 0.71mi |
| 5943 Sunningdale St Ave Maria, FL | 3.0 | 2.5 | 1850 | $10,995 | $5.94 | 23d | 1 | 0.72mi |
| 6040 Ellerston Way #1411 Ave Maria, FL | 3.0 | 2.0 | 1741 | $2,695 | $1.55 | 23d | 1 | 0.73mi |
HOA detail
- Monthly dues
- $472 · $5,664/yr
Listing history 20 events
-
2026-06-18days on market $345,000 Active 23 DOM
-
2026-06-17days on market $345,000 Active 22 DOM
-
2026-06-16days on market $345,000 Active 21 DOM
-
2026-06-15days on market $345,000 Active 20 DOM
-
2026-06-14days on market $345,000 Active 18 DOM
-
2026-06-10days on market $345,000 Active 15 DOM
-
2026-06-09days on market $345,000 Active 14 DOM
-
2026-06-08days on market $345,000 Active 13 DOM
-
2026-06-07days on market $345,000 Active 12 DOM
-
2026-06-03days on market $345,000 Active 8 DOM
-
2026-06-02days on market $345,000 Active 7 DOM
-
2026-06-01days on market $345,000 Active 6 DOM
-
2026-05-31days on market $345,000 Active 5 DOM
-
2026-05-30days on market $345,000 Active 4 DOM
-
2026-05-26$345,000 Active
-
2026-04-30historical
-
2025-11-26$362,500 Active
-
2025-10-31historical
-
2025-03-05price $365,000
-
2025-02-05$369,000 Active
ⓘ Source: listings_history table (triggers on properties + properties_extension) + one-shot
backfill from property_details.listing_events for pre-trigger history.
Tax reassessment forecast FL · Resets to sale price
- Current annual tax
- $5,411 · $451/mo
- Projected year-2 tax
- $5,411 · $451/mo
- Expected delta
- $0/yr ($0/mo · 0.0%)
ⓘ Screening estimate from a state-policy table — verify with the county assessor before closing.
Climate risk First Street
- Flood 1/10 Low FEMA zone X (unshaded) · 0% chance over 30 yrs
- Wildfire 5/10 Major
- Heat 10/10 Extreme 7 d/yr ≥112°F today · 28 d/yr by 30 yrs out
- Wind 10/10 Extreme 99% chance of damaging wind over 30 yrs
- Air quality 2/10 Low 0 unhealthy d/yr today · 1 by 30 yrs out
Nearby sold comps map
Loading sold comps map…
Walkable amenities ~0.75 mi
Loading nearby amenities…
Taxation est. · year 1
- Rental income
- $54,300
- − Mortgage interest
- −$19,325
- − Property taxes
- −$5,411
- − Insurance
- −$1,725
- − Repairs & maintenance
- −$4,344
- − Management
- −$4,344
- − HOA
- −$5,664
- − Depreciation
- −$10,036
- Taxable income
- $3,450
- Est. tax owed @ 24.0%
- −$828
- After-tax cash flow
- $7,558/yr
For passive investors: Depreciation is non-cash, so a rental often shows a tax loss while cash-flowing — sheltering income. Rental losses are passive: they offset passive income freely, and up to $25,000/yr can offset ordinary (W-2) income if you actively participate and your MAGI is under $100k (phasing out to $0 by $150k); unused losses carry forward. On sale, claimed depreciation is recaptured at up to 25%, and gains may owe capital-gains tax (a 1031 exchange can defer both). Figures are a year-1 estimate at your 24.0% rate — not tax advice; consult a CPA.
Schools (NCES district)
- District
- Collier
- NCES district ID
- 1200330
- Math proficiency
- 60% ▼ -4.00%
- Reading proficiency
- 56% ▼ -2.00%
- Median HH income
- $58,275
- Composite
- 50.23/100
- National rank
- #1892
- State rank
- #16 of 73 in FL
Livability — Ave Maria
No livability data for this city. (Only ~50 U.S. cities are tracked.)
Census & demographics
- Census place
- Ave Maria, FL
- County
- Collier County · 396,295 people
- Metro
- Naples-Marco Island, FL
- Population (ZIP)
- 35,149
- Household income
- $62,333
- Rent vs Own
- Severe rent burden
- 1093.0
Population outlook (Collier County) Hauer SSP2
- Today (2025)
- 420,858 people
- By 2030
- 450,054 · +6.9%
- By 2040
- 502,232 · +19.3%
- By 2050
- 544,932 · +29.5%
- By 2075
- 627,203 · +49.0%
- By 2100
- 659,015 · +56.6%
Race, ethnicity, and origin ACS 2023
- Neighborhood character
- Majority Hispanic (63%)
- Race & ethnicity
- Hispanic / Latino 63% Two or more races 39% Black 19% White 16% Native American 7%
- Hispanic origin (detail)
- Mexican 43% Puerto Rican 3% Cuban 2% Dominican 1%
- Common ancestry
- Hispanic 8% Slovak 1% Serbian 1%
- Foreign-born
- 32% · Canada, Jamaica
- Languages at home
- 34% English-only · Spanish 53% French/Haitian/Cajun 12%
Political lean MEDSL · Collier
- 2024 margin
- Solid R (+33.1) · D 33.1% · R 66.2%
- 2008→2024 swing
- -10.6pp toward R · 2008: -22.5pp · 2024: -33.1pp
- All cycles
- 2024: R+33.1 2020: R+24.7 2016: R+26.0 2012: R+30.1 2008: R+22.5
Not yet ingested
- Civics
- —
Market trends
- HPI YoY
- ▼ -1.05%
- Current HPI
- 226.9105
- Rent YoY
- ▲ 2.95%
- Metro
- Naples-Marco Island, FL
- State GDP YoY
- ▲ 3.28%
- F500 in state
- 36
Industry mix (Fortune 500 HQ in FL)
| Industry | F500 HQs | Revenue |
|---|---|---|
| Industrial Technology | 2 | $29B |
|
||
| Insurance | 2 | $17B |
|
||
| Retail | 1 | $60B |
|
||
| Technology Distribution | 1 | $58B |
|
||
| Homebuilding | 1 | $35B |
|
||
| Technology Manufacturing | 1 | $35B |
|
||
Price history
-6.5% since first listed6 events — show timeline
- 2026-05-26 Listed $345,000 NAPLESMLS
- 2026-04-30 Listing Removed — NAPLESMLS
- 2025-11-26 Listed $362,500 NAPLESMLS
- 2025-10-31 Listing Removed — NAPLESMLS
- 2025-03-05 Price Changed $365,000 NAPLESMLS
- 2025-02-05 Listed $369,000 NAPLESMLS
Property tax history
+10.0%/yrLatest (2025): $5,411 · +12.4% YoY. Source: county tax records.
Cash-flow waterfall
monthlySold comps — $/sqft
last 12 mo · ≤1 miLoading sold comps…