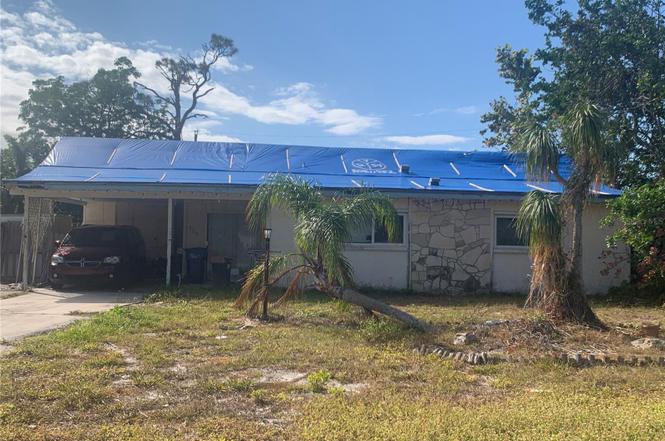
3120 Smith Ave · Bayshore Gardens, FL
Flood risk 8/10 · Major
- FEMA flood zone
- AE
- Chance of flooding over 30 yrs
- 0.97%
- Est. flood insurance / yr
- $1,737 – $8,500
Fire risk 1/10 · Minimal
- Est. fire insurance / yr
- $947 – $1,759
Heat risk 10/10 · Severe
- Hot days now (above 106°F)
- 7 days/yr
- Hot days in 30 yrs
- 29 days/yr
Wind risk 10/10 · Severe
- Chance of severe wind over 30 yrs
- 99.0%
Air-quality risk 2/10 · Minimal
- Unhealthy air days now
- 1 days/yr
- Unhealthy air days in 30 yrs
- 2 days/yr
Risk factors via First Street. Map © Google.
Why this score? — see what drove the B- grade
The composite is a weighted blend of 9 inputs, each scored 0–100. Each bar is that input's sub-score; the figure is the points it added to the 100-point composite (weight × sub-score).
- Cash flow +30.0/30.0
- DSCR +10.0/10.0
- 1% rule +9.4/10.0
- ARV discount +7.5/15.0
- Schools +4.4/10.0
- Livability +4.1/5.0
- Condition / age +2.5/5.0
- Rent growth +1.1/5.0
- Appreciation +0.0/10.0
$159,900
🖨 Deal sheet 📄 Offer letter ✓ Due diligence
Listing remarks
Short Sale. Investor Special. Property has a significant amount of interior deferred maintenance as well as exterior Hurricane damage. Will require new kitchen, appliances, bathrooms, flooring, doors, fixtures, paint, new roof, demo and clean out, exterior work, new screen lanai and pool repair, landscaping, etc.
Key facts
- 0.29 acre lot
- Parking
- Pool
Neighborhood map
What this means for you Summary
Snapshot
- This is a 3-bed/2.0-bath single-family listed at $160k.
Deal economics
- At list price, monthly cash flow is $342 ($4k/yr) — positive.
- The deal already cash-flows at list — no discount required.
- Meets the 1% rule at list price ($2k rent vs $160k).
- Cap rate 12.1% vs local median 4.7% in Bayshore Gardens — top-decile yield for the area; either an underpriced asset or a hidden risk that comps aren't pricing in. Stress-test before assuming the spread holds.
Location & tenants
- Location reads 82/100 on livability (#72 in FL, #1,180 nationally) — a professional / high-income tenant draw. Strengths: cost of living A+, housing A+, health & safety A+; Watch: crime C-, commute C-, schools F.
- Manatee (suburban): math 54% / reading 50% proficiency, ranked #26 of 73 in FL (top 36%) — acceptable for families but not a draw, mixed tenant base, ~2y average lease.
- Market conditions: Rents falling (-5.5%/yr); 361 active listings in the ZIP; 40 comparable units currently listed for rent nearby; rentals at typical pace (median 24d on market — plan ~3-4 weeks tenant-placement turnaround); 7,472 units permitted in Manatee County in 2024 (1,782 in 5+ unit buildings).
- At $2,301/mo this rent would consume 61% of the median local household income ($45k/yr) (locally 1474% of renters already pay >50% of income on rent) — very limited rent-growth headroom before tenants either downsize or default.
Forward outlook
- Local home prices are declining (-3.0%/yr); year-one equity from $1k of loan paydown is wiped out by about $5k of value loss. Plan a longer hold.
- Manatee County population projected at +43% by 2050 — long-run rental-demand tailwind backs the buy-and-hold thesis.
Negotiation context
- Only 1 days on market — expect competitive offers; lowballing is unlikely to land.
- Current owner paid $129k; 24% above their basis — modest negotiation headroom, anchor on the comps not their cost.
Risks & watch-outs
- Watch-outs: flood insurance adds $427/mo.
- Climate carrying-cost: in FEMA flood zone AE (mandatory federal flood insurance); severe wind risk, 99% chance of damaging wind over 30y; extreme-heat days projected 7→29/yr by 2055 (HVAC capex compounding) — expect insurance premiums to compound above CPI over the hold.
Questions for the listing agent
- Built in 1961 — when were the roof, HVAC, electrical panel, plumbing, and water heater last replaced?
- What's the actual annual flood-insurance premium (NFIP or private), and is the property in a SFHA with mandatory coverage?
- Is there a deadline driving the sale (1031 exchange, divorce, estate, relocation)? That informs how much negotiation room exists.
- Schools are F-rated, which usually means shorter tenancies and higher turnover. Who's the typical renter profile here, and what's been the actual vacancy rate?
- What's the average days-on-market for RENTAL listings here right now (not sales)? A rising rental-DOM trend means longer vacancies and softer asking-rent achievability than the comps imply.
- What's the recent tenant-quality profile in this submarket — average credit score on applications, eviction rate, late-payment / NSF rate, and stable-employment percentage? A property-management company in the area should have these aggregated.
- How much new for-sale + rental construction is in the pipeline within 1–3 miles? Heavy new supply typically softens prices + rents 12–24 months out; constrained supply supports both.
Investment metrics
- 1% rule
- 1.44% ✓
- Cap rate
- 12.06%
- Cash-on-cash
- 20.60%
- DSCR
- 1.92
- GRM
- 5.8
CMA / ARV
- ARV (on-the-fly)
- $338,877
- Comps found
- 12
Show comp detail 12 sales within ~0.75 mi
| Address | Dist | Beds/Ba | Sqft | Sold | Price | $/sf | Match |
|---|---|---|---|---|---|---|---|
| 3108 Smith Ave | 0.04mi | 3/2.0 | 1,390 (-5%) | 1mo | $285,000 | $205 | 88 |
| 3307 Miami Pl | 0.13mi | 3/2.0 | 1,412 (-4%) | 4mo | $184,000 | $130 | 84 |
| 6707 Northampton Pl | 0.14mi | 3/2.0 | 1,390 (-5%) | 7mo | $285,000 | $205 | 78 |
| 6616 Auburn Ave | 0.04mi | 3/2.0 | 1,292 (-12%) | 3mo | $298,000 | $231 | 76 |
| 2712 Carnegie Pl | 0.30mi | 3/2.0 | 1,392 (-5%) | 8mo | $345,000 | $248 | 71 |
| 6607 Georgia Ave | 0.24mi | 3/1.5 | 1,612 (+10%) | 0mo | $280,000 | $174 | 70 |
| 2303 Lehigh Ave | 0.54mi | 3/2.0 | 1,438 (-2%) | 5mo | $165,900 | $115 | 67 |
| 2303 Georgetown Rd | 0.53mi | 3/1.5 | 1,420 (-3%) | 1mo | $289,000 | $204 | 67 |
| 6723 Washington Pl | 0.20mi | 3/2.0 | 1,272 (-13%) | 2mo | $310,000 | $244 | 67 |
| 311 Bryn Mawr Is | 0.35mi | 2/1.5 (-1) | 1,390 (-5%) | 3mo | $540,000 | $388 | 65 |
| 6311 Fordham Pl | 0.45mi | 2/2.0 (-1) | 1,433 (-2%) | 7mo | $400,000 | $279 | 64 |
| 3120 Mercer Rd | 0.41mi | 3/2.0 | 1,351 (-8%) | 4mo | $360,000 | $266 | 64 |
Match score weights: distance 35% · size 25% · config 20% · recency 20%. Top-matched comps best support the ARV.
Projected returns pro-forma
-3.0% appreciation · 0.0% rent growth · sell at horizon
- IRR
- -6.6%
- Equity multiple
- 0.76×
- Total profit
- $-10,597
- Equity at exit
- $23,842
- IRR
- -2.5%
- Equity multiple
- 0.86×
- Total profit
- $-6,161
- Equity at exit
- $13,825
Cash invested: $44,772 (down + closing). Projections, not guarantees.
Landlord ↔ Tenant lean methodology
- Overall (STATE)
- 87 Strongly Landlord-Friendly
- State Florida
- 87 Strongly Landlord-Friendly · R+3
- County
- — inherits STATE
- City
- — inherits STATE
ZIP-level market 34207
- Rents YoY
- -5.5%
- Active inventory
- 361
- Price-to-rent
- 5.8×
Monthly cashflow live
- Estimated rent
- $2,301 high interval (Pro) →
- Mortgage (P&I)
- −$839
- Tax from tax record
- −$144 /mo · $1,730/yr
- Insurance
- −$67
- Flood insurance flood zone
- −$427 /mo · $5,118/yr
- HOA
- −$0
- Vacancy / Maint / Mgmt
- −$483
- Net cashflow
- $342
Break-even live
UW: 25.0% down · 7.5% · 30yr · 1.5% tax · 5.0% vac · 8.0% maint · 8.0% mgmt
Financing live
Cash to close
- Down payment
- $39,975
- Closing costs
- $4,797
- Reserves months
- —
- Total cash needed
- —
Loan-product check · same deal, 3 products live
Conventional
25% down · 7.5% · 30yr
- Down + closing
- —
- Monthly P&I
- —
- Monthly cashflow
- —
- DSCR
- —
- Eligible?
- —
Personal DTI + credit; lowest rate.
DSCR
20% down · 8.5% · 30yr
- Down + closing
- —
- Monthly P&I
- —
- Monthly cashflow
- —
- DSCR
- —
- Eligible?
- —
No personal income docs; deal must DSCR.
Hard money
10% down · 12.0% · 12mo
- Down + closing
- —
- Monthly P&I
- —
- Monthly cashflow
- —
- DSCR
- —
- Eligible?
- —
Short-term bridge; refi at stabilization.
Rent comps 40 comps
| Address | Beds | Baths | Sqft | Rent | $/sqft | DOM | Units | Dist |
|---|---|---|---|---|---|---|---|---|
| 6423 Egret Ln #402 Bradenton, FL | 2.0 | 2.0 | 1425 | $3,150 | $2.21 | 23d | 1 | 0.22mi |
| 3304 McDill Rd Bradenton, FL | 2.0 | 1.0 | 1044 | $1,695 | $1.62 | 12d | 1 | 0.23mi |
| 6439 Georgia Ave Bradenton, FL | 2.0 | 1.0 | 1614 | $2,095 | $1.30 | 10d | 1 | 0.28mi |
| 6472 Seagull Dr #306 Bradenton, FL | 3.0 | 2.0 | 1592 | $2,595 | $1.63 | 23d | 1 | 0.28mi |
| 6468 Seagull Dr #316 Bradenton, FL | 2.0 | 2.0 | 1314 | $3,900 | $2.97 | 23d | 1 | 0.30mi |
| 6462 Wild Oak Bay Blvd #243 Bradenton, FL | 3.0 | 2.0 | 1592 | $4,100 | $2.58 | 23d | 1 | 0.32mi |
| 6470 Mourning Dove Dr #203 Bradenton, FL | 2.0 | 2.0 | 1364 | $2,495 | $1.83 | 23d | 1 | 0.36mi |
| 6432 26th St W Bradenton, FL | 3.0 | 2.0 | 1284 | $1,800 | $1.40 | 16d | 1 | 0.43mi |
| 6912 26th St W Unit 1284305P Bradenton, FL | 3.0 | 2.0 | 1539 | $5,420 | $3.52 | 2d | 1 | 0.47mi |
| 6430 Sun Eagle Ln Bradenton, FL | 2.0 | 2.0 | 1364 | $2,448 | $1.79 | 3d | 2 | 0.54mi |
| 2408 Colgate Ave Bradenton, FL | 3.0 | 2.0 | 1482 | $5,500 | $3.71 | 23d | 1 | 0.59mi |
| 6101 34th St W Unit 27C Bradenton, FL | 3.0 | 2.0 | 1547 | $2,250 | $1.45 | 20d | 1 | 0.60mi |
| 2305 69th Ave W Bradenton, FL | 2.0 | 2.0 | 1038 | $1,775 | $1.71 | 23d | 1 | 0.62mi |
| 6101 34th St W Bradenton, FL | 2.0–3.0 | 2.0 | 1444 | $2,000 | $1.39 | 3d | 2 | 0.63mi |
| 2415 Holyoke Ave Bradenton, FL | 3.0 | 2.0 | 1134 | $2,599 | $2.29 | 23d | 1 | 0.66mi |
| 6033 34th St W Bradenton, FL | 2.0 | 2.0 | 942 | $1,550 | $1.64 | 3d | 3 | 0.73mi |
| 6033 34th St W Bradenton, FL | 2.0 | 2.0 | 942 | $1,625 | $1.73 | 2d | 2 | 0.73mi |
| 6033 34th St W Bradenton, FL | 2.0 | 2.0 | 996 | $1,500 | $1.51 | 23d | 2 | 0.73mi |
| 6147 43rd St W Bradenton, FL | 2.0 | 2.0 | 1116 | $3,200 | $2.87 | 23d | 1 | 0.77mi |
| 5903 43rd St W Unit 5903 Bradenton, FL | 2.0 | 2.0 | 1178 | $2,950 | $2.50 | 23d | 1 | 0.78mi |
| 6114 43rd St W Unit 407E Bradenton, FL | 2.0 | 2.0 | 1178 | $2,000 | $1.70 | 14d | 1 | 0.81mi |
| 6050 34th St W Bradenton, FL | 1.0–2.0 | 1.0 | 734 | $1,610 | $2.19 | 1d | 19 | 0.83mi |
| 6116 43rd St W Unit 401D Bradenton, FL | 2.0 | 2.0 | 1178 | $2,500 | $2.12 | 23d | 1 | 0.83mi |
| 2713 60th Avenue Dr W Bradenton, FL | 2.0 | 2.0 | 1076 | $2,000 | $1.86 | 23d | 1 | 0.84mi |
| 4119 61st Avenue Ter W #404 Bradenton, FL | 2.0 | 2.0 | 1178 | $1,500 | $1.27 | 23d | 1 | 0.87mi |
| 4119 61st Avenue Ter W #303 Bradenton, FL | 2.0 | 2.0 | 1178 | $1,800 | $1.53 | 23d | 1 | 0.87mi |
| 4119 61st Avenue Ter W #407 Bradenton, FL | 2.0 | 2.0 | 1178 | $1,695 | $1.44 | 3d | 1 | 0.87mi |
| 4119 61st Avenue Ter W Bradenton, FL | 2.0 | 2.0 | 1178 | $1,595 | $1.35 | 3d | 1 | 0.87mi |
| 4510 El Conquistador Pkwy #207 Bradenton, FL | 2.0 | 2.0 | 1074 | $3,400 | $3.17 | 23d | 1 | 0.90mi |
| 2423 60th Ave W Unit K29 Bradenton, FL | 2.0 | 2.0 | 1026 | $1,495 | $1.46 | 23d | 1 | 1.04mi |
| 3427 59th Ave W Bradenton, FL | 2.0 | 2.5 | 1330 | $2,150 | $1.62 | 16d | 1 | 1.05mi |
| 3533 59th Ave W Unit 3533 Bradenton, FL | 2.0 | 2.0 | 912 | $1,500 | $1.64 | 16d | 1 | 1.08mi |
| 3527 59th Ave W Unit 3527 Bradenton, FL | 2.0 | 2.0 | 912 | $1,400 | $1.54 | 23d | 1 | 1.09mi |
| 3545 59th Ave W #3545 Bradenton, FL | 3.0 | 2.0 | 1037 | $1,600 | $1.54 | 16d | 1 | 1.09mi |
| 3851 59th Ave W Unit 3851 Bradenton, FL | 2.0 | 2.0 | 912 | $1,500 | $1.64 | 23d | 1 | 1.09mi |
| 3843 59th Ave W Bradenton, FL | 2.0 | 2.0 | 912 | $1,200 | $1.32 | 23d | 1 | 1.09mi |
| 3773 59th Ave W Bradenton, FL | 2.0 | 2.0 | 912 | $1,595 | $1.75 | 23d | 1 | 1.11mi |
| 3739 59th Ave W Unit 3739 Bradenton, FL | 2.0 | 2.0 | 912 | $1,575 | $1.73 | 16d | 1 | 1.12mi |
| 3775 59th Ave W Unit 3775 Bradenton, FL | 2.0 | 2.0 | 912 | $3,500 | $3.84 | 23d | 1 | 1.12mi |
| 3848 59th Ave W Bradenton, FL | 2.0 | 2.0 | 912 | $1,395 | $1.53 | 23d | 1 | 1.12mi |
Listing history 5 events
-
2025-01-27status Pending
-
2025-01-27$159,900 Active
-
2002-07-08soldstatus $129,400
-
1996-12-09soldstatus $85,000
-
1994-09-23soldstatus $75,000
ⓘ Source: listings_history table (triggers on properties + properties_extension) + one-shot
backfill from property_details.listing_events for pre-trigger history.
Tax reassessment forecast FL · Resets to sale price
- Current annual tax
- $1,730 · $144/mo
- Projected year-2 tax
- $1,730 · $144/mo
- Expected delta
- $0/yr ($0/mo · 0.0%)
ⓘ Screening estimate from a state-policy table — verify with the county assessor before closing.
Climate risk First Street
- Flood 8/10 Severe FEMA zone AE · 97% chance over 30 yrs
- Wildfire 1/10 Low
- Heat 10/10 Extreme 7 d/yr ≥106°F today · 29 d/yr by 30 yrs out
- Wind 10/10 Extreme 99% chance of damaging wind over 30 yrs
- Air quality 2/10 Low 1 unhealthy d/yr today · 2 by 30 yrs out
Nearby sold comps map
Loading sold comps map…
Walkable amenities ~0.75 mi
Loading nearby amenities…
Taxation est. · year 1
- Rental income
- $27,617
- − Mortgage interest
- −$8,957
- − Property taxes
- −$1,730
- − Insurance
- −$5,918
- − Repairs & maintenance
- −$2,209
- − Management
- −$2,209
- − Depreciation
- −$4,652
- Taxable income
- $1,941
- Est. tax owed @ 24.0%
- −$466
- After-tax cash flow
- $3,641/yr
For passive investors: Depreciation is non-cash, so a rental often shows a tax loss while cash-flowing — sheltering income. Rental losses are passive: they offset passive income freely, and up to $25,000/yr can offset ordinary (W-2) income if you actively participate and your MAGI is under $100k (phasing out to $0 by $150k); unused losses carry forward. On sale, claimed depreciation is recaptured at up to 25%, and gains may owe capital-gains tax (a 1031 exchange can defer both). Figures are a year-1 estimate at your 24.0% rate — not tax advice; consult a CPA.
Schools (NCES district)
- District
- Manatee
- NCES district ID
- 1201230
- Math proficiency
- 54% ▼ -6.00%
- Reading proficiency
- 50% ▼ -2.00%
- Median HH income
- $49,607
- Composite
- 44.43/100
- National rank
- #2806
- State rank
- #26 of 73 in FL
Livability — Bayshore Gardens
- Score
- 82/100
- State rank
- #72
- US rank
- #1180
Category grades
Schools grade is shown separately in the Schools card above.
Census & demographics
- Census place
- Bayshore Gardens, FL
- County
- Manatee County · 416,364 people
- City population
- 33,840
- Metro
- North Port-Sarasota-Bradenton, FL
- Population (ZIP)
- 34,081
- Household income
- $45,010
- Rent vs Own
- Severe rent burden
- 1474.0
Population outlook (Manatee County) Hauer SSP2
- Today (2025)
- 447,342 people
- By 2030
- 488,911 · +9.3%
- By 2040
- 567,934 · +27.0%
- By 2050
- 637,995 · +42.6%
- By 2075
- 781,970 · +74.8%
- By 2100
- 848,272 · +89.6%
Race, ethnicity, and origin ACS 2023
- Neighborhood character
- Diverse neighborhood (Simpson 0.57)
- Race & ethnicity
- White 58% Hispanic / Latino 29% Two or more races 13% Black 7%
- Hispanic origin (detail)
- Mexican 12% Puerto Rican 4% Cuban 3% Dominican 1%
- Common ancestry
- Lithuanian 3% Romanian 2% Slovak 2%
- Foreign-born
- 16% · Canada, Jamaica
- Languages at home
- 74% English-only · Spanish 22% Other Indo-European 1% French/Haitian/Cajun 1%
Political lean MEDSL · Manatee
- 2024 margin
- Strong R (+23.5) · D 37.9% · R 61.4%
- 2008→2024 swing
- -16.5pp toward R · 2008: -7.0pp · 2024: -23.5pp
- All cycles
- 2024: R+23.5 2020: R+16.1 2016: R+17.1 2012: R+12.5 2008: R+7.0
Not yet ingested
- Civics
- —
Market trends
- HPI YoY
- ▼ -305.32%
- Current HPI
- 369.9899
- Rent YoY
- ▼ -5.50%
- Metro
- North Port-Sarasota-Bradenton, FL
- State GDP YoY
- ▲ 3.28%
- F500 in state
- 36
Industry mix (Fortune 500 HQ in FL)
| Industry | F500 HQs | Revenue |
|---|---|---|
| Industrial Technology | 2 | $29B |
|
||
| Insurance | 2 | $17B |
|
||
| Retail | 1 | $60B |
|
||
| Technology Distribution | 1 | $58B |
|
||
| Homebuilding | 1 | $35B |
|
||
| Technology Manufacturing | 1 | $35B |
|
||
Price history
+113.2% since first listed5 events — show timeline
- 2025-01-27 Pending — Stellar MLS as Distributed by MLS Grid
- 2025-01-27 Listed $159,900 Stellar MLS as Distributed by MLS Grid
- 2002-07-08 Sold (Public Records) $129,400 Public Records
- 1996-12-09 Sold (Public Records) $85,000 Public Records
- 1994-09-23 Sold (Public Records) $75,000 Public Records
Property tax history
+2.9%/yrLatest (2025): $1,730 · +4.0% YoY. Source: county tax records.
Cash-flow waterfall
monthlySold comps — $/sqft
last 12 mo · ≤1 miLoading sold comps…