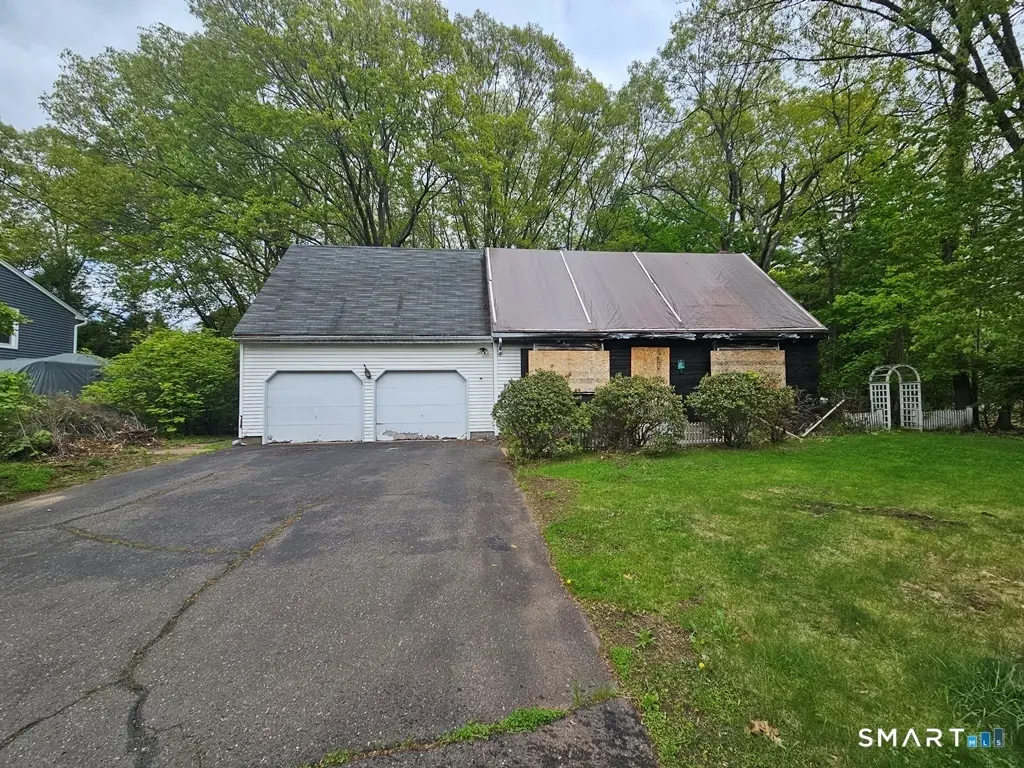
69 Fleming Rd · Manchester, CT
Flood risk 1/10 · Minimal
- FEMA flood zone
- X (unshaded)
- Chance of flooding over 30 yrs
- 0.0%
- Est. flood insurance / yr
- $473 – $860
Fire risk 1/10 · Minimal
- Est. fire insurance / yr
- $829 – $1,539
Heat risk 5/10 · Moderate
- Hot days now (above 96°F)
- 7 days/yr
- Hot days in 30 yrs
- 16 days/yr
Wind risk 6/10 · Moderate
- Chance of severe wind over 30 yrs
- 27.0%
Air-quality risk 3/10 · Minor
- Unhealthy air days now
- 3 days/yr
- Unhealthy air days in 30 yrs
- 4 days/yr
Risk factors via First Street. Map © Google.
Why this score? — see what drove the B- grade
The composite is a weighted blend of 9 inputs, each scored 0–100. Each bar is that input's sub-score; the figure is the points it added to the 100-point composite (weight × sub-score).
- Cash flow +30.0/30.0
- 1% rule +10.0/10.0
- DSCR +10.0/10.0
- ARV discount +7.5/15.0
- Livability +3.8/5.0
- Rent growth +3.7/5.0
- Schools +2.5/10.0
- Condition / age +2.5/5.0
- Appreciation +0.0/10.0
$128,000
🖨 Deal sheet 📄 Offer letter ✓ Due diligence
Listing remarks
Come see this charming Cape-Cod style home featuring two bedrooms, one and a half bathrooms, and 1648 square feet of living area. This property is situated on a flat lot within a residential community that is conveniently located near highway access and various amenities. Nearby attractions include Elicit Brewery, Buckland Hills Mall, and several dining options. Make this your new home today! Property to be sold as-is.
Key facts
- 0.32 acre lot
- 2 garage spots
- Built 1988
Property features AI
Finance
- Other: Nearby amenities include golf course, health club, park, private schools, public transportation and shopping/mall
- Financial info: Assessed value listed
Exterior
- Parking: Attached garage; Two garage spaces; Three total parking spaces (including driveway/off-street)
- Utilities: Public water connected; Public sewer connected
- Home design: Single-family home for sale
- Construction: Frame construction; Concrete foundation; White exterior color; Built with asphalt shingle roofing
- Exterior features: Level lot; Vinyl siding; Asphalt shingle roof; Private paved driveway; Paved off-street parking
Interior
- Bedrooms: Two bedrooms
- Bathrooms: One full bathroom; One half bathroom
- Heating & cooling: Hot water heating; Oil-fired heat; above-ground fuel tank; Domestic hot water
- Interior features: Six total rooms; One fireplace; Full basement with interior access, concrete floor and storage space
Neighborhood map
What this means for you Summary
Snapshot
- This is a 2-bed/1.5-bath single-family listed at $128k.
Deal economics
- At list price, monthly cash flow is $935 ($11k/yr) — positive.
- The deal already cash-flows at list — no discount required.
- Meets the 1% rule at list price ($2k rent vs $128k).
- Recommended offer: $126k (1.5% below list) — sets the bar for market timing.
- Cap rate 15.1% vs local median 3.8% in Manchester — top-decile yield for the area; either an underpriced asset or a hidden risk that comps aren't pricing in. Stress-test before assuming the spread holds.
Location & tenants
- Location reads 76/100 on livability (#59 in CT, #3,580 nationally) — a middle-class / working-renter tenant base. Strengths: housing A+, health & safety A+, cost of living A-; Watch: amenities D, commute F.
- Manchester School District (suburban): math 21% / reading 32% proficiency, ranked #130 of 153 in CT (top 85%) — low school quality limits family demand, transient renter base, plan for 1-2y turnover.
- Market conditions: Rents rising fast (+4.8%/yr); 57 active listings in the ZIP; 15 comparable units currently listed for rent nearby; rentals at typical pace (median 21d on market — plan ~3-4 weeks tenant-placement turnaround); 47% of comp listings sitting > 30 days — soft ceiling on asking rent; solid renter incomes; 1,867 units permitted in Capitol Planning Region in 2024 (1,399 in 5+ unit buildings).
- This rent runs 30% of the median local income ($92k/yr) — at the standard rent-burdened threshold; future hikes will face affordability resistance.
Forward outlook
- Local home prices are declining (-3.0%/yr); year-one equity from $885 of loan paydown is wiped out by about $4k of value loss. Plan a longer hold.
- At projected returns (-3.0% appreciation + 4.8% rent growth), your $36k cash investment doubles in ~4 years — after that, you're playing with house money.
Negotiation context
- It's been on market 27 days — a 2% lower offer ($126k) is reasonable based on typical stale-listing flexibility.
- 2 sale attempts since 4y ago with the ask held roughly flat each time — persistent listings suggest the price (not the market) is what's stuck; bring a comps-based counter.
Risks & watch-outs
- Climate carrying-cost: major wind risk, 27% chance of damaging wind over 30y; extreme-heat days projected 7→16/yr by 2055 (HVAC capex compounding) — expect insurance premiums to compound above CPI over the hold.
Questions for the listing agent
- Is there a deadline driving the sale (1031 exchange, divorce, estate, relocation)? That informs how much negotiation room exists.
- Schools are B-rated — typically a magnet for longer-tenancy family renters. What's the average tenant stay here, and is there a school-zone premium baked into asking?
- What's the average days-on-market for RENTAL listings here right now (not sales)? A rising rental-DOM trend means longer vacancies and softer asking-rent achievability than the comps imply.
- What's the recent tenant-quality profile in this submarket — average credit score on applications, eviction rate, late-payment / NSF rate, and stable-employment percentage? A property-management company in the area should have these aggregated.
- How much new for-sale + rental construction is in the pipeline within 1–3 miles? Heavy new supply typically softens prices + rents 12–24 months out; constrained supply supports both.
Investment metrics
- 1% rule
- 1.80% ✓
- Cap rate
- 15.06%
- Cash-on-cash
- 31.32%
- DSCR
- 2.39
- GRM
- 4.6
CMA / ARV
- ARV (on-the-fly)
- $359,264
- Comps found
- 12
Show comp detail 12 sales within ~0.75 mi
| Address | Dist | Beds/Ba | Sqft | Sold | Price | $/sf | Match |
|---|---|---|---|---|---|---|---|
| 94 BRENT Rd | 0.38mi | 3/1.0 (+1) | 1,524 (-8%) | 1mo | $320,000 | $210 | 62 |
| 76 Turnbull Rd | 0.33mi | 3/2.5 (+1) | 1,596 (-3%) | 14mo | $394,900 | $247 | 59 |
| 15 French Rd | 0.46mi | 3/2.0 (+1) | 1,629 (-1%) | 14mo | $355,000 | $218 | 58 |
| 92 Columbus St | 0.30mi | 3/2.0 (+1) | 1,546 (-6%) | 12mo | $325,000 | $210 | 58 |
| 333 Middle Tpke W | 0.57mi | 3/2.0 (+1) | 1,661 (+1%) | 9mo | $335,000 | $202 | 58 |
| 30 Duval St | 0.40mi | 3/2.0 (+1) | 1,527 (-7%) | 7mo | $340,000 | $223 | 56 |
| 83 Deerfield Dr | 0.71mi | 3/2.0 (+1) | 1,587 (-4%) | 2mo | $400,000 | $252 | 52 |
| 226 Hilliard St | 0.31mi | 3/1.5 (+1) | 1,428 (-13%) | 8mo | $380,000 | $266 | 52 |
| 162 Broad St | 0.43mi | 3/1.5 (+1) | 1,406 (-15%) | 13mo | $300,000 | $213 | 39 |
| 116 Woodhill Rd | 0.53mi | 3/1.5 (+1) | 1,410 (-14%) | 13mo | $325,000 | $230 | 36 |
| 100 Woodhill Rd | 0.51mi | 3/1.5 (+1) | 1,410 (-14%) | 14mo | $290,000 | $206 | 36 |
| 27 Homestead St | 0.63mi | 3/2.0 (+1) | 1,448 (-12%) | 11mo | $301,000 | $208 | 34 |
Match score weights: distance 35% · size 25% · config 20% · recency 20%. Top-matched comps best support the ARV.
Projected returns pro-forma
-3.0% appreciation · 4.8% rent growth · sell at horizon
- IRR
- 28.2%
- Equity multiple
- 2.20×
- Total profit
- $43,109
- Equity at exit
- $19,085
- IRR
- 36.7%
- Equity multiple
- 4.70×
- Total profit
- $132,463
- Equity at exit
- $11,067
Cash invested: $35,840 (down + closing). Projections, not guarantees.
Landlord ↔ Tenant lean methodology
- Overall (STATE)
- 27 Tenant-Leaning
- State Connecticut
- 27 Tenant-Leaning · D+7
- County
- — inherits STATE
- City
- — inherits STATE
ZIP-level market 06042
- Rents YoY
- 4.8%
- Active inventory
- 57
- Price-to-rent
- 4.6×
Monthly cashflow live
- Estimated rent
- $2,304 high interval (Pro) →
- Mortgage (P&I)
- −$671
- Tax est. 1.5%
- −$160 /mo · $1,920/yr
- Insurance
- −$53
- HOA
- −$0
- Vacancy / Maint / Mgmt
- −$484
- Net cashflow
- $935
Break-even live
UW: 25.0% down · 7.5% · 30yr · 1.5% tax · 5.0% vac · 8.0% maint · 8.0% mgmt
Financing live
Cash to close
- Down payment
- $32,000
- Closing costs
- $3,840
- Reserves months
- —
- Total cash needed
- —
Loan-product check · same deal, 3 products live
Conventional
25% down · 7.5% · 30yr
- Down + closing
- —
- Monthly P&I
- —
- Monthly cashflow
- —
- DSCR
- —
- Eligible?
- —
Personal DTI + credit; lowest rate.
DSCR
20% down · 8.5% · 30yr
- Down + closing
- —
- Monthly P&I
- —
- Monthly cashflow
- —
- DSCR
- —
- Eligible?
- —
No personal income docs; deal must DSCR.
Hard money
10% down · 12.0% · 12mo
- Down + closing
- —
- Monthly P&I
- —
- Monthly cashflow
- —
- DSCR
- —
- Eligible?
- —
Short-term bridge; refi at stabilization.
Rent comps 15 comps
| Address | Beds | Baths | Sqft | Rent | $/sqft | DOM | Units | Dist |
|---|---|---|---|---|---|---|---|---|
| 527 Hilliard St Unit A Manchester, CT | 2.0 | 1.5 | 1168 | $2,100 | $1.80 | 43d | 1 | 0.39mi |
| 68 Westerly St Manchester, CT | 3.0 | 1.5 | 1400 | $2,200 | $1.57 | 44d | 1 | 0.40mi |
| 6 Oak Forest Dr #3 Manchester, CT | 2.0 | 1.5 | 1150 | $2,450 | $2.13 | 21d | 1 | 0.57mi |
| 424 Middle Tpke W Manchester, CT | 1.0–2.0 | 1.0–1.5 | 997 | $2,150 | $2.16 | 1d | 7 | 0.60mi |
| 184 Main St Unit D Manchester, CT | 3.0 | 2.5 | 1860 | $2,900 | $1.56 | 3d | 1 | 0.73mi |
| 39 Buckland St Manchester, CT | 1.0–2.0 | 1.0–2.0 | 995 | $2,515 | $2.53 | 1d | 7 | 0.76mi |
| 1500 Horizon Way Manchester, CT | 2.0 | 1.0–2.0 | 1046 | $2,950 | $2.82 | 43d | 20 | 0.87mi |
| 1500 Horizon Way Manchester, CT | 2.0 | 1.0–2.0 | 1046 | $2,960 | $2.83 | 1d | 22 | 0.87mi |
| 30 Catherines Way Manchester, CT | 1.0–3.0 | 1.0–2.0 | 1102 | $2,504 | $2.27 | 1d | 5 | 0.98mi |
| 47 Bigelow St Manchester, CT | 3.0 | 1.0 | 1500 | $1,925 | $1.28 | 43d | 1 | 1.07mi |
| 11 Strant St Manchester, CT | 3.0 | 1.0 | 1982 | $2,200 | $1.11 | 43d | 1 | 1.15mi |
| 63 Ridge St Manchester, CT | 3.0 | 1.5 | 1590 | $2,050 | $1.29 | 43d | 1 | 1.26mi |
| 10 Short St Manchester, CT | 3.0 | 2.0 | 1400 | $2,400 | $1.71 | 43d | 1 | 1.45mi |
| 31 Nolan Cir #31 Manchester, CT | 2.0 | 1.5 | 1240 | $2,500 | $2.02 | 1d | 1 | 1.45mi |
| 167 E Center St Manchester, CT | 1.0–2.0 | 1.0–1.5 | 800 | $2,199 | $2.75 | 1d | 2 | 1.49mi |
Listing history 18 events
-
2026-06-17status $128,000 Under Contract 27 DOM
-
2026-06-17days on market $128,000 Under Contract - Continue to Show 27 DOM
-
2026-06-16days on market $128,000 Under Contract - Continue to Show 26 DOM
-
2026-06-15days on market $128,000 Under Contract - Continue to Show 25 DOM
-
2026-06-13days on market $128,000 Under Contract - Continue to Show 23 DOM
-
2026-06-10days on market $128,000 Under Contract - Continue to Show 20 DOM
-
2026-06-09days on market $128,000 Under Contract - Continue to Show 19 DOM
-
2026-06-08days on market $128,000 Under Contract - Continue to Show 18 DOM
-
2026-06-07days on market $128,000 Under Contract - Continue to Show 17 DOM
-
2026-06-03days on market $128,000 Under Contract - Continue to Show 13 DOM
-
2026-06-02days on market $128,000 Under Contract - Continue to Show 12 DOM
-
2026-06-01days on market $128,000 Under Contract - Continue to Show 11 DOM
-
2026-05-31days on market $128,000 Under Contract - Continue to Show 10 DOM
-
2026-05-21$128,000 Active
-
2023-01-27historical
-
2022-12-16historical Under Contract - Continue to Show
-
2022-11-08price $250,000
-
2022-11-01$278,000 Active
ⓘ Source: listings_history table (triggers on properties + properties_extension) + one-shot
backfill from property_details.listing_events for pre-trigger history.
Climate risk First Street
- Flood 1/10 Low FEMA zone X (unshaded) · 0% chance over 30 yrs
- Wildfire 1/10 Low
- Heat 5/10 Major 7 d/yr ≥96°F today · 16 d/yr by 30 yrs out
- Wind 6/10 Major 27% chance of damaging wind over 30 yrs
- Air quality 3/10 Moderate 3 unhealthy d/yr today · 4 by 30 yrs out
Nearby sold comps map
Loading sold comps map…
Walkable amenities ~0.75 mi
Loading nearby amenities…
Taxation est. · year 1
- Rental income
- $27,643
- − Mortgage interest
- −$7,170
- − Property taxes
- −$1,920
- − Insurance
- −$640
- − Repairs & maintenance
- −$2,211
- − Management
- −$2,211
- − Depreciation
- −$3,724
- Taxable income
- $9,767
- Est. tax owed @ 24.0%
- −$2,344
- After-tax cash flow
- $8,879/yr
For passive investors: Depreciation is non-cash, so a rental often shows a tax loss while cash-flowing — sheltering income. Rental losses are passive: they offset passive income freely, and up to $25,000/yr can offset ordinary (W-2) income if you actively participate and your MAGI is under $100k (phasing out to $0 by $150k); unused losses carry forward. On sale, claimed depreciation is recaptured at up to 25%, and gains may owe capital-gains tax (a 1031 exchange can defer both). Figures are a year-1 estimate at your 24.0% rate — not tax advice; consult a CPA.
Schools (NCES district)
- District
- Manchester School District
- NCES district ID
- 0902310
- Math proficiency
- 21% ▼ -8.00%
- Reading proficiency
- 32% ▼ -5.00%
- Median HH income
- $63,391
- Composite
- 24.54/100
- National rank
- #7643
- State rank
- #130 of 153 in CT
Livability — Manchester
- Score
- 76/100
- State rank
- #59
- US rank
- #3580
Category grades
Schools grade is shown separately in the Schools card above.
Census & demographics
- Census place
- Manchester, CT
- County
- Hartford County · 754,208 people
- City population
- 59,635
- Metro
- Hartford-East Hartford-Middletown, CT
- Population (ZIP)
- 23,822
- Household income
- $91,892
- Rent vs Own
- Severe rent burden
- 730.0
Population outlook (Capitol County) Hauer SSP2
- By 2040
- 1,063,519
Race, ethnicity, and origin ACS 2023
- Neighborhood character
- Diverse neighborhood (Simpson 0.63)
- Race & ethnicity
- White 56% Asian 14% Black 14% Hispanic / Latino 13% Two or more races 7%
- Hispanic origin (detail)
- Puerto Rican 8%
- Common ancestry
- Lithuanian 6% Romanian 6% Slovak 2%
- Foreign-born
- 20% · Canada, Vietnam, Jamaica
- Languages at home
- 72% English-only · Spanish 10% Other Indo-European 7% Other Asian/Pacific 3%
Political lean MEDSL · Capitol
- 2024 margin
- Strong D (+21.9) · D 60.1% · R 38.2% · Other 1.7%
- All cycles
- 2024: D+21.9
Not yet ingested
- Civics
- —
Market trends
- HPI YoY
- ▼ -112.15%
- Current HPI
- 196.8782
- Rent YoY
- ▲ 4.80%
- Metro
- Hartford-East Hartford-Middletown, CT
- State GDP YoY
- ▲ 1.06%
- F500 in state
- 38
Industry mix (Fortune 500 HQ in CT)
| Industry | F500 HQs | Revenue |
|---|---|---|
| Industrial Machinery | 4 | $38B |
|
||
| Insurance | 3 | $71B |
|
||
| Financial Services | 2 | $25B |
|
||
| Transportation / Logistics | 2 | $18B |
|
||
| Healthcare | 1 | $247B |
|
||
| Telecommunications | 1 | $55B |
|
||
Price history
-54.0% since first listed5 events — show timeline
- 2026-05-21 Listed $128,000 Smart MLS
- 2023-01-27 Listing Removed — Smart MLS
- 2022-12-16 Contingent — Smart MLS
- 2022-11-08 Price Changed $250,000 Smart MLS
- 2022-11-01 Listed $278,000 Smart MLS
Property tax history
+3.6%/yrLatest (2025): $7,884 · +2.9% YoY. Source: county tax records.
Cash-flow waterfall
monthlySold comps — $/sqft
last 12 mo · ≤1 miLoading sold comps…