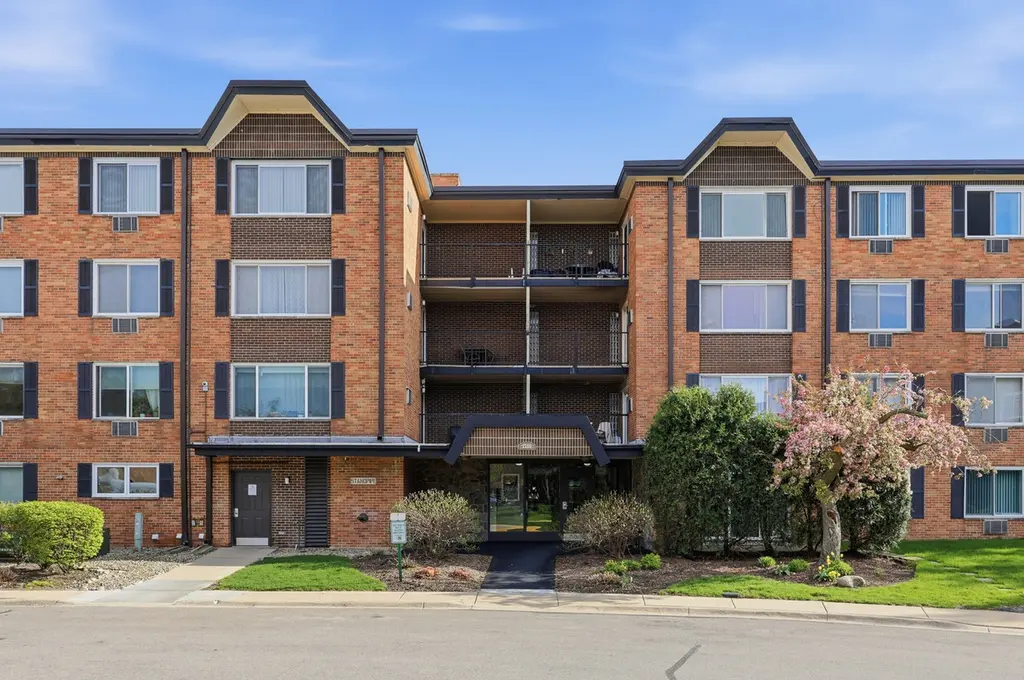
1216 S New Wilke Rd #307 · Arlington Heights, IL
Flood risk 9/10 · Severe
- FEMA flood zone
- X (unshaded)
- Chance of flooding over 30 yrs
- 0.99%
- Est. flood insurance / yr
- $507 – $1,088
Fire risk 1/10 · Minimal
- Est. fire insurance / yr
- $804 – $1,492
Heat risk 3/10 · Minor
- Hot days now (above 100°F)
- 7 days/yr
- Hot days in 30 yrs
- 14 days/yr
Wind risk 2/10 · Minimal
- Chance of severe wind over 30 yrs
- 0.0%
Air-quality risk 3/10 · Minor
- Unhealthy air days now
- 3 days/yr
- Unhealthy air days in 30 yrs
- 4 days/yr
Risk factors via First Street. Map © Google.
Why this score? — see what drove the D grade
The composite is a weighted blend of 9 inputs, each scored 0–100. Each bar is that input's sub-score; the figure is the points it added to the 100-point composite (weight × sub-score).
- Cash flow +13.2/30.0
- ARV discount +7.5/15.0
- 1% rule +7.2/10.0
- Livability +4.1/5.0
- DSCR +4.0/10.0
- Schools +3.9/10.0
- Condition / age +2.5/5.0
- Rent growth +1.3/5.0
- Appreciation +0.0/10.0
$179,900
🖨 Deal sheet (PDF) 📄 Offer letter ✓ Due diligence
Listing remarks
Spacious 2-bedroom, 2-bathroom condo located in the highly desirable Mallard Cove community! This unit offers a fantastic opportunity for buyers looking to add their personal touch. In need of updates and some tender loving care. This property is perfect for flippers, investors, or owner-occupants with a vision to build equity. Enjoy a functional layout with generous living space and great potential throughout. With the right improvements, this condo can truly shine. Mallard Cove offers wonderful amenities including a swimming pool, exercise room, and tennis courts-providing both convenience and an active lifestyle. Oh, and the golf course within walking distance is very beautiful. Great lo
Key facts
- Exercise room
- Swimming pool
- Tennis courts
Tags
Property features AI
Finance
- Other: Manager on-site; Some photos are virtually staged; Possession at closing or immediate
- HOA & community: Monthly association fee of $477; Association fee covers heat, water, gas, parking, insurance, clubhouse, exercise facilities, pool, exterior maintenance, lawn care, scavenger, and snow removal; Community amenities include bike room/trails, coin laundry, elevator(s), exercise room, storage, and pool; On-site manager available Monday through Friday; Pets allowed (cats OK)
Exterior
- Parking: 2 parking spaces; Parking provided (features listed as Other)
- Utilities: Public water; Public sewer
- Home design: Attached single condo; Entry level: 3; Located in a multi-unit building (39 units); Estimated living area; Built approximately 51–60 years ago; Located across from a golf course; near commuter and school bus routes
- Construction: Brick construction; Built before 1978
- Exterior features: Balcony; Landscaped grounds; Common lot area
Interior
- Kitchen: Double oven; Dishwasher; Refrigerator
- Bedrooms: Master bedroom on main level with full bath; Second bedroom on main level (12 x 13) with blinds and laminate flooring; Additional bedrooms present
- Flooring: Laminate flooring in living room, dining room, kitchen, master and bedroom; Laminate in living room (16 x 20), kitchen (9 x 8), dining room (9 x 8)
- Bathrooms: 2 full bathrooms
- Heating & cooling: Natural gas heating; Steam heating; Baseboard heating; Window unit(s) for cooling
- Interior features: Walk-in closet(s); 5 total rooms; Balcony/Porch/Lanai
- Laundry & utility: Common area laundry
Neighborhood map
What this means for you Summary
Snapshot
- This is a 2-bed/2.0-bath condo listed at $180k.
Deal economics
- At list price, monthly cash flow is $-68 ($-820/yr) — negative.
- To cash-flow at today's rent, offer at most $168k (6.7% below list).
- Meets the 1% rule at list price ($2k rent vs $180k).
- Recommended offer: $168k (6.7% below list) — sets the bar for cash-flow.
- Cap rate 6.3% vs local median 2.9% in Arlington Heights — top-decile yield for the area; either an underpriced asset or a hidden risk that comps aren't pricing in. Stress-test before assuming the spread holds.
Location & tenants
- Location reads 82/100 on livability (#60 in IL, #1,055 nationally) — a professional / high-income tenant draw. Strengths: crime A+, commute A+, employment A+; Watch: health & safety D+, amenities F, cost of living F.
- Township Hsd 214 (suburban): math 42% / reading 45% proficiency, ranked #103 of 620 in IL (top 17%) — families likely to look elsewhere, expect single-tenant / working-renter base with shorter leases.
- Zoned schools: Willow Bend Elem School (math 35% / reading 37%, grade F, #503 of 2,056 statewide, top 25%, 955 students, 0% FRL); Carl Sandburg Jr High School (math 24% / reading 25%, grade F, #332 of 665 statewide, top 55%, 470 students, 0% FRL); Rolling Meadows High School (math 35% / reading 39%, grade F, #107 of 693 statewide, top 17%, 2,044 students, 0% FRL).
- Market conditions: Rents falling (-5.0%/yr); 77 active listings in the ZIP; 13 comparable units currently listed for rent nearby; rentals leasing fast (median 12d on market — plan ~1-2 weeks tenant-placement turnaround); solid renter incomes; 6,272 units permitted in Cook County in 2024 (4,658 in 5+ unit buildings).
Forward outlook
- Local home prices are declining (-3.0%/yr); year-one equity from $1k of loan paydown is wiped out by about $5k of value loss. Plan a longer hold.
Negotiation context
- Only 10 days on market — expect competitive offers; lowballing is unlikely to land.
- 4 sale attempts since 16y ago with the ask held roughly flat each time — persistent listings suggest the price (not the market) is what's stuck; bring a comps-based counter.
Risks & watch-outs
- Watch-outs: flood insurance adds $66/mo; HOA is 22% of rent.
- Climate carrying-cost: severe flood risk — expect insurance premiums to compound above CPI over the hold.
Questions for the listing agent
- What do current leases actually rent for vs. the listed asking? Can we see a recent rent roll and the last 12 months of T-12 income?
- Built in 1971 — when were the roof, HVAC, electrical panel, plumbing, and water heater last replaced?
- What's the actual annual flood-insurance premium (NFIP or private), and is the property in a SFHA with mandatory coverage?
- What does the HOA fee cover, when was the last increase, and are there any pending special assessments or reserve-fund shortfalls?
- Any open or pending special assessments — roof, HVAC, plumbing, elevator, façade? What's the per-unit balance and payoff schedule, and is the seller paying it off at close or rolling it to the buyer?
- Is there a deadline driving the sale (1031 exchange, divorce, estate, relocation)? That informs how much negotiation room exists.
- Schools are A-rated — typically a magnet for longer-tenancy family renters. What's the average tenant stay here, and is there a school-zone premium baked into asking?
- The area grade is low — what's the realistic commute time and amenity access for the typical tenant pool here? Any planned neighborhood developments (good or bad) we should know about?
- What's the average days-on-market for RENTAL listings here right now (not sales)? A rising rental-DOM trend means longer vacancies and softer asking-rent achievability than the comps imply.
- What's the recent tenant-quality profile in this submarket — average credit score on applications, eviction rate, late-payment / NSF rate, and stable-employment percentage? A property-management company in the area should have these aggregated.
- How much new apartment / multifamily construction is in the pipeline within 1–3 miles? Heavy new supply (>2% of stock underway) typically softens rents 12–24 months out; light construction supports rent growth.
Investment metrics
- 1% rule
- 1.22% ✓
- Cap rate
- 6.28%
- Cash-on-cash
- -0.04%
- DSCR
- 1.00
- GRM
- 6.8
CMA / ARV
No comps found within radius.
Projected returns pro-forma
-3.0% appreciation · 0.0% rent growth · sell at horizon
- IRR
- -23.9%
- Equity multiple
- 0.21×
- Total profit
- $-39,573
- Equity at exit
- $26,824
- IRR
- -40.3%
- Equity multiple
- -0.26×
- Total profit
- $-63,444
- Equity at exit
- $15,554
Cash invested: $50,372 (down + closing). Projections, not guarantees.
Landlord ↔ Tenant lean methodology
- Overall (STATE)
- 43 Moderately Tenant-Leaning
- State Illinois
- 43 Moderately Tenant-Leaning · D+7
- County
- — inherits STATE
- City
- — inherits STATE
ZIP-level market 60005
- Rents YoY
- -5.0%
- Active inventory
- 77
- Price-to-rent
- 6.8×
Monthly cashflow live
- Estimated rent
- $2,201 high interval (Pro) →
- Mortgage (P&I)
- −$943
- Tax from tax record
- −$245 /mo · $2,939/yr
- Insurance
- −$75
- Flood insurance flood zone
- −$66 /mo · $798/yr
- HOA
- −$477
- Vacancy / Maint / Mgmt
- −$462
- Net cashflow
- $-68
Break-even live
Sensitivity live
| Price | -10% $34 | -5% $-17 | +0% $-68 | +5% $-119 | +10% $-170 |
|---|---|---|---|---|---|
| Rent | -10% $-242 | -5% $-155 | +0% $-68 | +5% $19 | +10% $106 |
| Rate | -1.0pp $22 | -0.5pp $-23 | base $-68 | +0.5pp $-115 | +1.0pp $-162 |
UW: 25.0% down · 7.5% · 30yr · 1.5% tax · 5.0% vac · 8.0% maint · 8.0% mgmt
Financing live
Cash to close
- Down payment
- $44,975
- Closing costs
- $5,397
- Reserves months
- —
- Total cash needed
- —
Loan-product check · same deal, 3 products live
Conventional
25% down · 7.5% · 30yr
- Down + closing
- —
- Monthly P&I
- —
- Monthly cashflow
- —
- DSCR
- —
- Eligible?
- —
Personal DTI + credit; lowest rate.
DSCR
20% down · 8.5% · 30yr
- Down + closing
- —
- Monthly P&I
- —
- Monthly cashflow
- —
- DSCR
- —
- Eligible?
- —
No personal income docs; deal must DSCR.
Hard money
10% down · 12.0% · 12mo
- Down + closing
- —
- Monthly P&I
- —
- Monthly cashflow
- —
- DSCR
- —
- Eligible?
- —
Short-term bridge; refi at stabilization.
Rent comps 13 comps
| Address | Beds | Baths | Sqft | Rent | $/sqft | DOM | Units | Dist |
|---|---|---|---|---|---|---|---|---|
| 2402 Birch Ln Rolling Meadows, IL | 3.0 | 1.0 | 1160 | $1,649 | $1.42 | 6d | 1 | 0.31mi |
| 2205 Fulle St Rolling Meadows, IL | 3.0 | 2.0 | 1340 | $2,400 | $1.79 | 26d | 1 | 0.40mi |
| 4730 Calvert Dr Unit C2 Rolling Meadows, IL | 2.0 | 1.0 | 1200 | $2,195 | $1.83 | 26d | 1 | 0.42mi |
| 5300 Carriageway Dr #107 Rolling Meadows, IL | 2.0 | 1.0 | 1100 | $2,175 | $1.98 | 26d | 1 | 0.50mi |
| 2850 Southampton Dr Rolling Meadows, IL | 1.0–3.0 | 1.0–2.0 | 1212 | $2,208 | $1.82 | 0d | 33 | 0.52mi |
| 829 S Dwyer Ave Unit D Arlington Heights, IL | 2.0 | 1.0 | 1000 | $1,800 | $1.80 | 8d | 1 | 0.70mi |
| 2606 Grouse Ln Rolling Meadows, IL | 3.0 | 1.0 | 1055 | $2,600 | $2.46 | 0d | 1 | 0.76mi |
| 1243 S Mitchell Ave Arlington Heights, IL | 3.0 | 2.0 | 1486 | $3,300 | $2.22 | 11d | 1 | 0.93mi |
| 1243 S Mitchell Ave Unit HSE Arlington Heights, IL | 3.0 | 2.0 | 1486 | $3,300 | $2.22 | 2d | 1 | 0.93mi |
| 814 S Evergreen Ave Arlington Heights, IL | 3.0 | 1.5 | 1281 | $3,950 | $3.08 | 11d | 1 | 1.29mi |
| 3609 Bobwhite Ln Rolling Meadows, IL | 3.0 | 1.0 | 1017 | $2,850 | $2.80 | 11d | 1 | 1.31mi |
| 4700 Arbor Dr Rolling Meadows, IL | 1.0–3.0 | 1.0–2.0 | 1050 | $1,938 | $1.85 | 3d | 20 | 1.36mi |
| 3265 Kirchoff Rd #215 Rolling Meadows, IL | 2.0 | 2.0 | 1000 | $2,000 | $2.00 | 19d | 1 | 1.40mi |
HOA detail condo
- Monthly dues
- $477 · $5,724/yr
- Likely covers
- pool
- Assessments
- None detected in remarks — confirm with the listing agent.
Listing history 10 events
-
2026-05-01status Pending
-
2026-04-21$179,900 Active
-
2017-07-28historical
-
2017-07-19price
-
2017-07-10status Reactivated
-
2017-06-12historical
-
2017-06-07price
-
2017-05-03New
-
2010-07-19historical
-
2010-03-03New
ⓘ Source: listings_history table (triggers on properties + properties_extension) + one-shot
backfill from property_details.listing_events for pre-trigger history.
Tax reassessment forecast IL · Partial reset (capped growth)
- Current annual tax
- $2,939 · $245/mo
- Projected year-2 tax
- $3,511 · $293/mo
- Expected delta
- +$572/yr (+$48/mo · 19.5%)
ⓘ Screening estimate from a state-policy table — verify with the county assessor before closing.
Climate risk First Street
- Flood 9/10 Extreme FEMA zone X (unshaded) · 99% chance over 30 yrs
- Wildfire 1/10 Low
- Heat 3/10 Moderate 7 d/yr ≥100°F today · 14 d/yr by 30 yrs out
- Wind 2/10 Low 0% chance of damaging wind over 30 yrs
- Air quality 3/10 Moderate 3 unhealthy d/yr today · 4 by 30 yrs out
Nearby sold comps map
Loading sold comps map…
Walkable amenities ~0.75 mi
Loading nearby amenities…
Taxation est. · year 1
- Rental income
- $26,406
- − Mortgage interest
- −$10,077
- − Property taxes
- −$2,939
- − Insurance
- −$1,697
- − Repairs & maintenance
- −$2,113
- − Management
- −$2,113
- − HOA
- −$5,724
- − Depreciation
- −$5,233
- Taxable loss
- −$3,489
- Est. tax savings @ 24.0%
- +$837
- After-tax cash flow
- $17/yr
For passive investors: Depreciation is non-cash, so a rental often shows a tax loss while cash-flowing — sheltering income. Rental losses are passive: they offset passive income freely, and up to $25,000/yr can offset ordinary (W-2) income if you actively participate and your MAGI is under $100k (phasing out to $0 by $150k); unused losses carry forward. On sale, claimed depreciation is recaptured at up to 25%, and gains may owe capital-gains tax (a 1031 exchange can defer both). Figures are a year-1 estimate at your 24.0% rate — not tax advice; consult a CPA.
Schools (NCES district)
- District
- Township Hsd 214
- NCES district ID
- 1704170
- Math proficiency
- 42% ▼ -10.00%
- Reading proficiency
- 45% ▼ -4.00%
- Median HH income
- $68,267
- Composite
- 39.13/100
- National rank
- #4035
- State rank
- #103 of 620 in IL
Livability — Arlington Heights
- Score
- 82/100
- State rank
- #60
- US rank
- #1055
Category grades
Schools grade is shown separately in the Schools card above.
Census & demographics
- Census place
- Arlington Heights, IL
- County
- Cook County · 4,486,803 people
- City population
- 80,678
- Metro
- Chicago-Naperville-Elgin, IL-IN-WI
- Population (ZIP)
- 28,843
- Household income
- $99,743
- Rent vs Own
- Severe rent burden
- 818.0
Population outlook (Cook County) Hauer SSP2
- Today (2025)
- 5,347,519 people
- By 2030
- 5,357,703 · +0.2%
- By 2040
- 5,324,924 · -0.4%
- By 2050
- 5,230,762 · -2.2%
- By 2075
- 4,785,735 · -10.5%
- By 2100
- 4,188,836 · -21.7%
Race, ethnicity, and origin ACS 2023
- Neighborhood character
- Predominantly White (71%)
- Race & ethnicity
- White 71% Hispanic / Latino 15% Two or more races 11% Asian 8% Black 3%
- Hispanic origin (detail)
- Mexican 6% Puerto Rican 5% Cuban 1%
- Common ancestry
- Romanian 13% French 3% Slovak 2%
- Foreign-born
- 26% · Canada, South Korea, China
- Languages at home
- 64% English-only · Russian/Polish/Slavic 13% Spanish 10% Other Indo-European 6%
Political lean MEDSL · Cook
- 2024 margin
- Solid D (+42.0) · D 70.4% · R 28.4% · Other 1.2%
- 2008→2024 swing
- -11.4pp toward R · 2008: 53.4pp · 2024: 42.0pp
- All cycles
- 2024: D+42.0 2020: D+50.3 2016: D+53.0 2012: D+49.4 2008: D+53.4
Not yet ingested
- Civics
- —
Market trends
- HPI YoY
- ▼ -301.88%
- Current HPI
- 209.777
- Rent YoY
- ▼ -4.96%
- Metro
- Chicago-Naperville-Elgin, IL-IN-WI
- State GDP YoY
- ▲ 1.59%
- F500 in state
- 60
Industry mix (Fortune 500 HQ in IL)
| Industry | F500 HQs | Revenue |
|---|---|---|
| Insurance | 4 | $201B |
|
||
| Consumer Goods | 4 | $87B |
|
||
| Industrial Machinery | 3 | $64B |
|
||
| Healthcare | 2 | $55B |
|
||
| Retail / Pharmacy | 1 | $148B |
|
||
| Agriculture / Food | 1 | $86B |
|
||
Price history
10 events — show timeline
- 2026-05-01 Pending — MRED as Distributed by MLS Grid
- 2026-04-21 Listed $179,900 MRED as Distributed by MLS Grid
- 2017-07-28 Listing Removed — MRED as Distributed by MLS Grid
- 2017-07-19 Price Changed — MRED as Distributed by MLS Grid
- 2017-07-10 Relisted — MRED as Distributed by MLS Grid
- 2017-06-12 Listing Removed — MRED as Distributed by MLS Grid
- 2017-06-07 Price Changed — MRED as Distributed by MLS Grid
- 2017-05-03 Listed — MRED as Distributed by MLS Grid
- 2010-07-19 Listing Removed — MRED as Distributed by MLS Grid
- 2010-03-03 Listed — MRED as Distributed by MLS Grid
Property tax history
+3.8%/yrLatest (2023): $2,939 · +5.4% YoY. Source: county tax records.
Cash-flow waterfall
monthlySold comps — $/sqft
last 12 mo · ≤1 miLoading sold comps…