 🏗️ New Construction
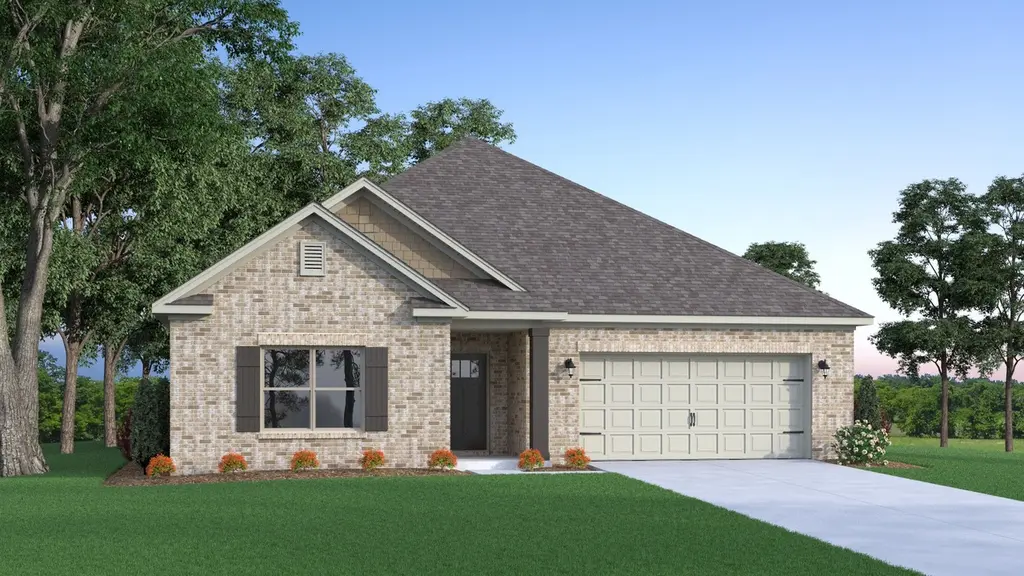
The Charleston Plan · Hazel Green, AL
Flood risk No data
- FEMA flood zone
- —
- Chance of flooding over 30 yrs
- —
- Est. flood insurance / yr
- —
Fire risk No data
- Est. fire insurance / yr
- —
Heat risk No data
- Hot days now (above threshold)
- —
- Hot days in 30 yrs
- —
Wind risk No data
- Chance of severe wind over 30 yrs
- —
Air-quality risk No data
- Unhealthy air days now
- —
- Unhealthy air days in 30 yrs
- —
Risk factors via First Street. Map © Google.
Why this score? — see what drove the F grade
The composite is a weighted blend of 9 inputs, each scored 0–100. Each bar is that input's sub-score; the figure is the points it added to the 100-point composite (weight × sub-score).
- Appreciation +10.0/10.0
- ARV discount +7.5/15.0
- Schools +3.7/10.0
- Livability +3.5/5.0
- Cash flow +3.3/30.0
- Rent growth +2.5/5.0
- Condition / age +2.5/5.0
- 1% rule +0.0/10.0
- DSCR +0.0/10.0
$299,900
🖨 Deal sheet (PDF) 📄 Offer letter ✓ Due diligence
Listing remarks MLS
The CHARLESTON provides great space for entertaining and relaxing inside and outside with an open concept floorplan and lots of natural light. With a flex room that provides options for formal dining, office, or an extra bedroom, this floorplan is the perfect fit for you. * Home specifications are subject to change based on product availability.
Key facts
- Natural light
- Flex room
- 2 garage spots
Tags
Neighborhood map
What this means for you Summary
Snapshot
- This is a 3-bed/2.0-bath single-family listed at $300k.
Deal economics
- At list price, monthly cash flow is $-1k ($-13k/yr) — negative.
- To cash-flow at today's rent, offer at most $195k (34.9% below list).
- To meet the 1% rule (rent ≥ 1% of price), the offer needs to be $171k (43.0% below list).
- Recommended offer: $171k (43.0% below list) — sets the bar for 1% rule.
- Cap rate 2.6% vs local median 3.9% in Hazel Green — below-typical yield; the buyer is paying a premium for something (appreciation thesis, condition, location) that the cap rate doesn't capture.
Location & tenants
- Location reads 69/100 on livability (#54 in AL) — a middle-class / working-renter tenant base. Strengths: cost of living A+, housing A+, crime A; Watch: amenities F, commute F, employment F.
- Madison County (rural): math 27% / reading 56% proficiency, ranked #19 of 129 in AL (top 15%) — families likely to look elsewhere, expect single-tenant / working-renter base with shorter leases.
- Zoned schools: Hazel Green Elementary School (math 23% / reading 58%, grade F, #238 of 627 statewide, top 38%, 738 students, 50% FRL); Moores Mill Intermediate School (math 42% / reading 66%, grade B-, #20 of 257 statewide, top 8%, 840 students, 46% FRL); Hazel Green High School (math 23% / reading 31%, grade F, #90 of 305 statewide, top 35%, 1,348 students, 42% FRL) — zoned schools average 46% FRL vs 29% district-wide (17 pts higher); higher-poverty schools than district average — tighter screening recommended.
- Market conditions: 260 active listings in the ZIP; 15 comparable units currently listed for rent nearby; rentals at typical pace (median 25d on market — plan ~3-4 weeks tenant-placement turnaround); 4,709 units permitted in Madison County in 2024 (1,186 in 5+ unit buildings).
Forward outlook
- In year one you build about $38k of equity ($2k loan paydown + $36k appreciation (10.0% local appreciation)).
- Madison County population projected at +18% by 2050 — long-run rental-demand tailwind backs the buy-and-hold thesis.
- By year 2, paydown + projected appreciation supports a ~$61k cash-out refi (75% LTV) — recoverable capital for the next deal without selling this one.
Negotiation context
- It's been on market 102 days — a 9% lower offer ($273k) is reasonable based on typical stale-listing flexibility.
Questions for the listing agent
- What do current leases actually rent for vs. the listed asking? Can we see a recent rent roll and the last 12 months of T-12 income?
- It's been on market 102 days. Have you received any prior offers? Is the seller open to a 43% concession, seller financing, or rate buy-down credit?
- Why hasn't it sold? Are there any deal-killer items the seller is aware of (foundation, flood, title, zoning, code violations)?
- Is there a deadline driving the sale (1031 exchange, divorce, estate, relocation)? That informs how much negotiation room exists.
- The area grade is low — what's the realistic commute time and amenity access for the typical tenant pool here? Any planned neighborhood developments (good or bad) we should know about?
- What's the average days-on-market for RENTAL listings here right now (not sales)? A rising rental-DOM trend means longer vacancies and softer asking-rent achievability than the comps imply.
- What's the recent tenant-quality profile in this submarket — average credit score on applications, eviction rate, late-payment / NSF rate, and stable-employment percentage? A property-management company in the area should have these aggregated.
- How much new for-sale + rental construction is in the pipeline within 1–3 miles? Heavy new supply typically softens prices + rents 12–24 months out; constrained supply supports both.
Investment metrics
- 1% rule
- 0.48% ✗
- Cap rate
- 2.56%
- Cash-on-cash
- -13.33%
- DSCR
- 0.41
- GRM
- 17.3
CMA / ARV
- ARV (median comp)
- $355,194
- List price
- $299,900
- Delta
- -15.57%
- Verdict
- UNDERPRICED
- Comps
- 20 within 1.0 mi
Show comp detail 12 sales within ~0.75 mi
| Address | Dist | Beds/Ba | Sqft | Sold | Price | $/sf | Match |
|---|---|---|---|---|---|---|---|
| 109 Huffman St | 0.11mi | 3/2.5 | 2,209 (-4%) | 3mo | $324,900 | $147 | 84 |
| 112 Huffman St | 0.14mi | 3/2.5 | 2,209 (-4%) | 8mo | $339,900 | $154 | 78 |
| 113 Huffman St | 0.13mi | 4/3.0 (+1) | 2,583 (+12%) | 2mo | $359,900 | $139 | 63 |
| 137 Sublett Dr | 0.19mi | 4/2.5 (+1) | 2,572 (+12%) | 2mo | $309,000 | $120 | 63 |
| 104 Whitner Dr | 0.25mi | 4/2.0 (+1) | 2,022 (-12%) | 13mo | $327,000 | $162 | 52 |
| 101 Oliver Ct | 0.45mi | 4/2.5 (+1) | 2,050 (-11%) | 6mo | $254,900 | $124 | 49 |
| 271 Shubert Dr | 0.33mi | 4/3.0 (+1) | 2,583 (+12%) | 12mo | $345,900 | $134 | 45 |
| 134 Twin Rivers Dr | 0.72mi | 3/2.0 | 2,106 (-9%) | 8mo | $399,900 | $190 | 45 |
| 299 Keller Dr | 0.55mi | 4/3.0 (+1) | 2,136 (-7%) | 12mo | $317,181 | $148 | 44 |
| 228 Cherry Laurel Dr | 0.62mi | 3/2.0 | 1,972 (-14%) | 10mo | $260,000 | $132 | 38 |
| 103 Covey Ln | 0.52mi | 3/3.0 | 2,645 (+15%) | 11mo | $440,000 | $166 | 38 |
| 297 Keller Dr | 0.55mi | 4/2.0 (+1) | 1,964 (-15%) | 11mo | $279,900 | $143 | 36 |
Match score weights: distance 35% · size 25% · config 20% · recency 20%. Top-matched comps best support the ARV.
Projected returns pro-forma
10.0% appreciation · 3.0% rent growth · sell at horizon
- IRR
- 15.0%
- Equity multiple
- 2.24×
- Total profit
- $123,120
- Equity at exit
- $319,987
- IRR
- 14.7%
- Equity multiple
- 5.20×
- Total profit
- $417,944
- Equity at exit
- $690,064
Cash invested: $99,454 (down + closing). Projections, not guarantees.
Landlord ↔ Tenant lean methodology
- Overall (STATE)
- 90 Strongly Landlord-Friendly
- State Alabama
- 90 Strongly Landlord-Friendly · R+15
- County
- — inherits STATE
- City
- — inherits STATE
ZIP-level market 35750
- Home prices YoY
- 8.2%
- Active inventory
- 260
- Price-to-rent
- 14.6×
Monthly cashflow live
- Estimated rent
- $1,709 high interval (Pro) →
- Mortgage (P&I)
- −$1,863
- Tax est. 1.5%
- −$444 /mo · $5,328/yr
- Insurance
- −$148
- HOA
- −$0
- Vacancy / Maint / Mgmt
- −$359
- Net cashflow
- $-1,105
Break-even live
Sensitivity live
| Price | -10% $-859 | -5% $-982 | +0% $-1,105 | +5% $-1,227 | +10% $-1,350 |
|---|---|---|---|---|---|
| Rent | -10% $-1,240 | -5% $-1,172 | +0% $-1,105 | +5% $-1,037 | +10% $-970 |
| Rate | -1.0pp $-926 | -0.5pp $-1,014 | base $-1,105 | +0.5pp $-1,197 | +1.0pp $-1,290 |
UW: 25.0% down · 7.5% · 30yr · 1.5% tax · 5.0% vac · 8.0% maint · 8.0% mgmt
Financing live
Cash to close
- Down payment
- $88,799
- Closing costs
- $10,656
- Reserves months
- —
- Total cash needed
- —
Loan-product check · same deal, 3 products live
Conventional
25% down · 7.5% · 30yr
- Down + closing
- —
- Monthly P&I
- —
- Monthly cashflow
- —
- DSCR
- —
- Eligible?
- —
Personal DTI + credit; lowest rate.
DSCR
20% down · 8.5% · 30yr
- Down + closing
- —
- Monthly P&I
- —
- Monthly cashflow
- —
- DSCR
- —
- Eligible?
- —
No personal income docs; deal must DSCR.
Hard money
10% down · 12.0% · 12mo
- Down + closing
- —
- Monthly P&I
- —
- Monthly cashflow
- —
- DSCR
- —
- Eligible?
- —
Short-term bridge; refi at stabilization.
Rent comps 15 comps
| Address | Beds | Baths | Sqft | Rent | $/sqft | DOM | Units | Dist |
|---|---|---|---|---|---|---|---|---|
| 147 Tobin Ln Hazel Green, AL | 4.0 | 2.0 | 1884 | $1,700 | $0.90 | 45d | 1 | 0.38mi |
| 143 Havner Dr Hazel Green, AL | 4.0 | 2.0 | 1667 | $1,775 | $1.06 | 15d | 1 | 0.39mi |
| 171 Keller Dr Hazel Green, AL | 3.0 | 2.0 | 1683 | $1,616 | $0.96 | 45d | 1 | 0.39mi |
| 108 Karenlee Cir Hazel Green, AL | 4.0 | 2.0 | 1666 | $1,685 | $1.01 | 25d | 1 | 0.44mi |
| 189 Tobin Ln Hazel Green, AL | 3.0 | 2.0 | 1685 | $1,775 | $1.05 | 15d | 1 | 0.48mi |
| 236 Cherry Laurel Dr Hazel Green, AL | 4.0 | 3.0 | 1964 | $1,750 | $0.89 | 25d | 1 | 0.58mi |
| 206 Hailey May Ct Hazel Green, AL | 4.0 | 2.5 | 1924 | $1,745 | $0.91 | 15d | 1 | 0.88mi |
| 202 Hailey May Ct Hazel Green, AL | 4.0 | 2.5 | 1727 | $1,645 | $0.95 | 25d | 1 | 0.90mi |
| 203 Hailey May Ct Hazel Green, AL | 4.0 | 2.0 | 1797 | $1,695 | $0.94 | 25d | 1 | 0.91mi |
| 127 London Calvin Way Hazel Green, AL | 4.0 | 2.5 | 1727 | $1,645 | $0.95 | 15d | 1 | 0.93mi |
| 104 London Calvin Way Hazel Green, AL | 4.0 | 2.5 | 1971 | $1,745 | $0.89 | 25d | 1 | 0.94mi |
| 106 London Calvin Way Hazel Green, AL | 4.0 | 2.0 | 1797 | $1,684 | $0.94 | 45d | 1 | 0.94mi |
| 119 London Calvin Way Hazel Green, AL | 4.0 | 2.5 | 1924 | $1,745 | $0.91 | 15d | 1 | 0.94mi |
| 102 London Calvin Way Hazel Green, AL | 4.0 | 2.5 | 1924 | $1,745 | $0.91 | 25d | 1 | 0.95mi |
| 115 London Calvin Way Hazel Green, AL | 4.0 | 2.5 | 1971 | $1,734 | $0.88 | 45d | 1 | 0.95mi |
Listing history 15 events
-
2026-06-22days on market $299,900 Active 102 DOM
-
2026-06-18days on market $299,900 Active 99 DOM
-
2026-06-17days on market $299,900 Active 98 DOM
-
2026-06-16days on market $299,900 Active 97 DOM
-
2026-06-15days on market $299,900 Active 96 DOM
-
2026-06-14days on market $299,900 Active 94 DOM
-
2026-06-10pricedays on market $299,900 Active 91 DOM
-
2026-06-09days on market $309,900 Active 90 DOM
-
2026-06-08days on market $309,900 Active 89 DOM
-
2026-06-07days on market $309,900 Active 88 DOM
-
2026-06-02pricedays on market $309,900 Active 83 DOM
-
2026-06-01days on market $314,900 Active 82 DOM
-
2026-05-31days on market $314,900 Active 81 DOM
-
2026-05-30days on market $314,900 Active 80 DOM
-
2026-03-12$314,900 Active 347-char remark
Show marketing remark (347 chars)
The CHARLESTON provides great space for entertaining and relaxing inside and outside with an open concept floorplan and lots of natural light. With a flex room that provides options for formal dining, office, or an extra bedroom, this floorplan is the perfect fit for you. * Home specifications are subject to change based on product availability.
ⓘ Source: listings_history table (triggers on properties + properties_extension) + one-shot
backfill from property_details.listing_events for pre-trigger history.
Nearby sold comps map
Loading sold comps map…
Walkable amenities ~0.75 mi
Loading nearby amenities…
Taxation est. · year 1
- Rental income
- $20,507
- − Mortgage interest
- −$19,896
- − Property taxes
- −$5,328
- − Insurance
- −$1,776
- − Repairs & maintenance
- −$1,641
- − Management
- −$1,641
- − Depreciation
- −$10,333
- Taxable loss
- −$20,107
- Est. tax savings @ 24.0%
- +$4,826
- After-tax cash flow
- $-8,430/yr
For passive investors: Depreciation is non-cash, so a rental often shows a tax loss while cash-flowing — sheltering income. Rental losses are passive: they offset passive income freely, and up to $25,000/yr can offset ordinary (W-2) income if you actively participate and your MAGI is under $100k (phasing out to $0 by $150k); unused losses carry forward. On sale, claimed depreciation is recaptured at up to 25%, and gains may owe capital-gains tax (a 1031 exchange can defer both). Figures are a year-1 estimate at your 24.0% rate — not tax advice; consult a CPA.
Schools (NCES district)
- District
- Madison County
- NCES district ID
- 0102220
- Math proficiency
- 27% ▼ -32.00%
- Reading proficiency
- 56% ▼ -1.00%
- Median HH income
- $66,058
- Composite
- 37.15/100
- National rank
- #4483
- State rank
- #19 of 129 in AL
Livability — Hazel Green
- Score
- 69/100
- State rank
- #54
- US rank
- #8575
Category grades
Schools grade is shown separately in the Schools card above.
Census & demographics
- Census place
- Hazel Green, AL
- County
- Madison County · 380,832 people
- City population
- 13,413
- Metro
- Huntsville, AL
- Population (ZIP)
- 13,413
- Household income
- $68,389
- Rent vs Own
- Severe rent burden
- 162.0
Population outlook (Madison County) Hauer SSP2
- Today (2025)
- 392,086 people
- By 2030
- 409,788 · +4.5%
- By 2040
- 440,557 · +12.4%
- By 2050
- 460,990 · +17.6%
- By 2075
- 502,872 · +28.3%
- By 2100
- 513,623 · +31.0%
Race, ethnicity, and origin ACS 2023
- Neighborhood character
- Predominantly White (71%)
- Race & ethnicity
- White 71% Black 19% Asian 5% Two or more races 3% Hispanic / Latino 2%
- Common ancestry
- Slovak 1% Serbian 1% Romanian 1%
- Foreign-born
- 3% · Canada
- Languages at home
- 95% English-only · Spanish 2% Chinese 1% Korean 1%
Political lean MEDSL · Madison
- 2024 margin
- Lean R (+9.0) · D 44.7% · R 53.7% · Other 1.6%
- 2008→2024 swing
- +6.0pp toward D · 2008: -14.9pp · 2024: -9.0pp
- All cycles
- 2024: R+9.0 2020: R+8.0 2016: R+16.8 2012: R+18.7 2008: R+14.9
Not yet ingested
- Civics
- —
Market trends
- HPI YoY
- ▲ 33.59%
- Current HPI
- 444.7418
- Rent YoY
- —
- Metro
- Huntsville, AL
- State GDP YoY
- ▲ 2.94%
- F500 in state
- 4
Industry mix (Fortune 500 HQ in AL)
| Industry | F500 HQs | Revenue |
|---|---|---|
| Financial Services | 1 | $8B |
|
||
| Healthcare | 1 | $5B |
|
||
Price history
1 event — show timeline
- 2026-03-12 Listed $314,900 Zillow
Cash-flow waterfall
monthlySold comps — $/sqft
last 12 mo · ≤1 miLoading sold comps…