18237 Pleasantview Blvd · Connerton, FL
Flood risk No data
- FEMA flood zone
- —
- Chance of flooding over 30 yrs
- —
- Est. flood insurance / yr
- —
Fire risk No data
- Est. fire insurance / yr
- —
Heat risk No data
- Hot days now (above threshold)
- —
- Hot days in 30 yrs
- —
Wind risk No data
- Chance of severe wind over 30 yrs
- —
Air-quality risk No data
- Unhealthy air days now
- —
- Unhealthy air days in 30 yrs
- —
Risk factors via First Street. Map © Google.
Why this score? — see what drove the D- grade
The composite is a weighted blend of 9 inputs, each scored 0–100. Each bar is that input's sub-score; the figure is the points it added to the 100-point composite (weight × sub-score).
- Cash flow +12.3/30.0
- ARV discount +7.5/15.0
- Schools +4.3/10.0
- DSCR +3.6/10.0
- 1% rule +3.5/10.0
- Livability +3.3/5.0
- Condition / age +2.5/5.0
- Rent growth +1.6/5.0
- Appreciation +0.0/10.0
$281,800
🖨 Deal sheet (PDF) 📄 Offer letter ✓ Due diligence
Listing remarks
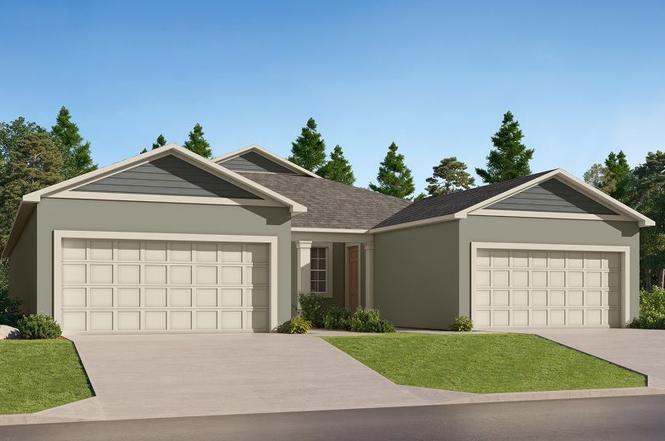
This new single-story villa optimizes space and prioritizes ease of living. An open-concept design includes the kitchen, dining room and family room, along with a covered lanai to provide outdoor space. Nearby is the cozy owner's suite with a private bathroom and spacious walk-in closet, while a cozy bedroom and versatile flex space are located down the hallway. A two-car garage completes the home.
Key facts
- Open-concept design
- Versatile flex space
- Covered lanai
Tags
Property features AI
Finance
- Other: Active listing (modified Jun 6, 2026)
- Financial info: List price $281,600
Exterior
- Parking: 2 covered garage spaces (2 total parking spaces)
- Home design: Single-family property (spec home); Malibu plan
- Exterior features: Property located at 18237 Pleasantview Blvd, Land O' Lakes, FL 34638
Interior
- Bedrooms: 3 bedrooms
- Bathrooms: 2 full bathrooms
- Interior features: Open living area of approximately 1486; Spec-built Malibu floor plan
Neighborhood map
What this means for you Summary
Snapshot
- This is a 3-bed/2.0-bath townhouse listed at $282k.
Deal economics
- At list price, monthly cash flow is $-53 ($-631/yr) — negative.
- To cash-flow at today's rent, offer at most $274k (2.7% below list).
- To meet the 1% rule (rent ≥ 1% of price), the offer needs to be $240k (14.9% below list).
- Recommended offer: $240k (14.9% below list) — sets the bar for 1% rule.
- Cap rate 6.1% vs local median 4.3% in Connerton — top-decile yield for the area; either an underpriced asset or a hidden risk that comps aren't pricing in. Stress-test before assuming the spread holds.
Location & tenants
- Location reads 66/100 on livability (#596 in FL) — a middle-class / working-renter tenant base. Strengths: crime A+, employment A+, housing A+; Watch: schools D+, amenities F, commute F.
- Pasco (suburban): math 50% / reading 52% proficiency, ranked #32 of 73 in FL (top 44%) — acceptable for families but not a draw, mixed tenant base, ~2y average lease.
- Market conditions: Rents falling (-3.8%/yr); 712 active listings in the ZIP; 27 comparable units currently listed for rent nearby; rentals at typical pace (median 25d on market — plan ~3-4 weeks tenant-placement turnaround); high-income renter base; 6,765 units permitted in Pasco County in 2024 (1,250 in 5+ unit buildings).
Forward outlook
- Local home prices are declining (-3.0%/yr); year-one equity from $2k of loan paydown is wiped out by about $8k of value loss. Plan a longer hold.
- Pasco County population projected at +29% by 2050 — long-run rental-demand tailwind backs the buy-and-hold thesis.
Negotiation context
- It's been on market 24 days — a 2% lower offer ($278k) is reasonable based on typical stale-listing flexibility.
Questions for the listing agent
- What do current leases actually rent for vs. the listed asking? Can we see a recent rent roll and the last 12 months of T-12 income?
- Is there a deadline driving the sale (1031 exchange, divorce, estate, relocation)? That informs how much negotiation room exists.
- Schools are D-rated, which usually means shorter tenancies and higher turnover. Who's the typical renter profile here, and what's been the actual vacancy rate?
- The area grade is low — what's the realistic commute time and amenity access for the typical tenant pool here? Any planned neighborhood developments (good or bad) we should know about?
- What's the average days-on-market for RENTAL listings here right now (not sales)? A rising rental-DOM trend means longer vacancies and softer asking-rent achievability than the comps imply.
- What's the recent tenant-quality profile in this submarket — average credit score on applications, eviction rate, late-payment / NSF rate, and stable-employment percentage? A property-management company in the area should have these aggregated.
- How much new for-sale + rental construction is in the pipeline within 1–3 miles? Heavy new supply typically softens prices + rents 12–24 months out; constrained supply supports both.
Investment metrics
- 1% rule
- 0.85% ✗
- Cap rate
- 6.07%
- Cash-on-cash
- -0.80%
- DSCR
- 0.96
- GRM
- 9.8
CMA / ARV
No comps found within radius.
Projected returns pro-forma
-3.0% appreciation · 0.0% rent growth · sell at horizon
- IRR
- -21.0%
- Equity multiple
- 0.29×
- Total profit
- $-56,005
- Equity at exit
- $42,017
- IRR
- -23.4%
- Equity multiple
- -0.02×
- Total profit
- $-80,098
- Equity at exit
- $24,365
Cash invested: $78,904 (down + closing). Projections, not guarantees.
Landlord ↔ Tenant lean methodology
- Overall (STATE)
- 87 Strongly Landlord-Friendly
- State Florida
- 87 Strongly Landlord-Friendly · R+3
- County
- — inherits STATE
- City
- — inherits STATE
ZIP-level market 34638
- Home prices YoY
- -16.0%
- Rents YoY
- -3.8%
- Active inventory
- 712
- Price-to-rent
- 9.8×
Monthly cashflow live
- Estimated rent
- $2,399 high interval (Pro) →
- Mortgage (P&I)
- −$1,478
- Tax est. 1.5%
- −$352 /mo · $4,227/yr
- Insurance
- −$117
- HOA
- −$0
- Vacancy / Maint / Mgmt
- −$504
- Net cashflow
- $-53
Break-even live
Sensitivity live
| Price | -10% $142 | -5% $45 | +0% $-53 | +5% $-150 | +10% $-247 |
|---|---|---|---|---|---|
| Rent | -10% $-242 | -5% $-147 | +0% $-53 | +5% $42 | +10% $137 |
| Rate | -1.0pp $89 | -0.5pp $19 | base $-53 | +0.5pp $-126 | +1.0pp $-200 |
UW: 25.0% down · 7.5% · 30yr · 1.5% tax · 5.0% vac · 8.0% maint · 8.0% mgmt
Financing live
Cash to close
- Down payment
- $70,450
- Closing costs
- $8,454
- Reserves months
- —
- Total cash needed
- —
Loan-product check · same deal, 3 products live
Conventional
25% down · 7.5% · 30yr
- Down + closing
- —
- Monthly P&I
- —
- Monthly cashflow
- —
- DSCR
- —
- Eligible?
- —
Personal DTI + credit; lowest rate.
DSCR
20% down · 8.5% · 30yr
- Down + closing
- —
- Monthly P&I
- —
- Monthly cashflow
- —
- DSCR
- —
- Eligible?
- —
No personal income docs; deal must DSCR.
Hard money
10% down · 12.0% · 12mo
- Down + closing
- —
- Monthly P&I
- —
- Monthly cashflow
- —
- DSCR
- —
- Eligible?
- —
Short-term bridge; refi at stabilization.
Rent comps 27 comps
| Address | Beds | Baths | Sqft | Rent | $/sqft | DOM | Units | Dist |
|---|---|---|---|---|---|---|---|---|
| 9896 Dancing Goat Pl Land O' Lakes, FL | 3.0 | 2.0 | 1486 | $2,175 | $1.46 | 25d | 1 | 0.04mi |
| 17761 Pleasantview Blvd Land O' Lakes, FL | 4.0 | 2.5 | 1870 | $2,600 | $1.39 | 21d | 1 | 0.38mi |
| 10179 Gliding Eagle Way Land O Lakes, FL | 3.0 | 2.0 | 1829 | $2,800 | $1.53 | 18d | 1 | 0.43mi |
| 17512 Shirewood Way Land O Lakes, FL | 3.0 | 2.0 | 1448 | $2,200 | $1.52 | 24d | 1 | 0.68mi |
| 10735 Hawks Landing Dr Land O Lakes, FL | 3.0 | 3.0 | 1848 | $2,495 | $1.35 | 15d | 1 | 0.74mi |
| 18846 Quarry Badger Rd Land O Lakes, FL | 4.0 | 2.0 | 1855 | $3,000 | $1.62 | 25d | 1 | 0.82mi |
| 9543 Maxson Dr Land O Lakes, FL | 4.0 | 2.5 | 1860 | $2,250 | $1.21 | 25d | 1 | 0.83mi |
| 10120 Perthshire Cir Land O Lakes, FL | 4.0 | 2.5 | 1872 | $1,200 | $0.64 | 25d | 1 | 0.87mi |
| 18916 Randall Pl Land O Lakes, FL | 3.0 | 2.5 | 1545 | $2,200 | $1.42 | 25d | 1 | 0.88mi |
| 17784 Turning Leaf Cir Land O Lakes, FL | 3.0 | 2.0 | 1532 | $2,450 | $1.60 | 25d | 1 | 0.90mi |
| 18276 Turning Leaf Cir Land O Lakes, FL | 3.0 | 2.0 | 1532 | $2,250 | $1.47 | 25d | 1 | 0.94mi |
| 18267 Turning Leaf Cir Land O Lakes, FL | 3.0 | 2.0 | 1516 | $2,095 | $1.38 | 25d | 1 | 0.97mi |
| 10567 Heron Hideaway Loop Land O Lakes, FL | 3.0 | 2.0 | 1532 | $2,050 | $1.34 | 13d | 1 | 0.98mi |
| 18039 Turning Leaf Cir Land O Lakes, FL | 3.0 | 2.0 | 1516 | $2,895 | $1.91 | 25d | 1 | 1.00mi |
| 18774 Grand Live Oak Blvd Land O' Lakes, FL | 3.0 | 2.0 | 1303 | $2,349 | $1.80 | 0d | 1 | 1.06mi |
| 18772 Grand Live Oak BLVD HOWEY IN HLS, FL | 1.0–3.0 | 1.0–3.0 | 1076 | $2,682 | $2.49 | 0d | 173 | 1.12mi |
| 10981 Wishing Cloud Rd Land O Lakes, FL | 3.0 | 2.5 | 1787 | $2,000 | $1.12 | 21d | 1 | 1.14mi |
| 11103 Wishing Cloud Rd Land O Lakes, FL | 3.0 | 2.5 | 1787 | $2,350 | $1.32 | 25d | 1 | 1.24mi |
| 11115 Wishing Cloud Rd Land O Lakes, FL | 3.0 | 2.5 | 1666 | $2,250 | $1.35 | 25d | 1 | 1.25mi |
| 11070 Crescent Deer Dr Land O Lakes, FL | 3.0 | 2.5 | 1673 | $1,950 | $1.17 | 25d | 1 | 1.27mi |
| 11028 Crescent Deer Dr Land O Lakes, FL | 3.0 | 2.5 | 1673 | $2,075 | $1.24 | 15d | 1 | 1.29mi |
| 11028 Crescent Deer Dr Land O Lakes, FL | 3.0 | 2.5 | 1673 | $2,075 | $1.24 | 25d | 1 | 1.29mi |
| 11071 Crescent Deer Dr Land O Lakes, FL | 3.0 | 2.5 | 1673 | $2,100 | $1.26 | 24d | 1 | 1.30mi |
| 11147 Crescent Deer Dr Land O Lakes, FL | 3.0 | 2.5 | 1673 | $1,995 | $1.19 | 25d | 1 | 1.34mi |
| 11236 Crescent Deer Dr Land O Lakes, FL | 3.0 | 2.5 | 1673 | $2,000 | $1.20 | 15d | 1 | 1.38mi |
| 11262 Crescent Deer Dr Land O Lakes, FL | 3.0 | 2.5 | 1673 | $2,195 | $1.31 | 5d | 1 | 1.40mi |
| 11450 Crescent Deer Dr Land O Lakes, FL | 3.0 | 2.5 | 1673 | $1,995 | $1.19 | 18d | 1 | 1.47mi |
Listing history 9 events
-
2026-06-18days on market $281,800 Active 24 DOM
-
2026-06-17days on market $281,800 Active 23 DOM
-
2026-06-16days on market $281,800 Active 22 DOM
-
2026-06-15days on market $281,800 Active 21 DOM
-
2026-06-13pricedays on market $281,800 Active 19 DOM
-
2026-06-09days on market $281,600 Active 15 DOM
-
2026-06-08days on market $281,600 Active 14 DOM
-
2026-06-07remarks 401-char remark
-
2026-06-07$281,600 Active 13 DOM
ⓘ Source: listings_history table (triggers on properties + properties_extension) + one-shot
backfill from property_details.listing_events for pre-trigger history.
Nearby sold comps map
Loading sold comps map…
Walkable amenities ~0.75 mi
Loading nearby amenities…
Taxation est. · year 1
- Rental income
- $28,783
- − Mortgage interest
- −$15,785
- − Property taxes
- −$4,227
- − Insurance
- −$1,409
- − Repairs & maintenance
- −$2,303
- − Management
- −$2,303
- − Depreciation
- −$8,198
- Taxable loss
- −$5,441
- Est. tax savings @ 24.0%
- +$1,306
- After-tax cash flow
- $675/yr
For passive investors: Depreciation is non-cash, so a rental often shows a tax loss while cash-flowing — sheltering income. Rental losses are passive: they offset passive income freely, and up to $25,000/yr can offset ordinary (W-2) income if you actively participate and your MAGI is under $100k (phasing out to $0 by $150k); unused losses carry forward. On sale, claimed depreciation is recaptured at up to 25%, and gains may owe capital-gains tax (a 1031 exchange can defer both). Figures are a year-1 estimate at your 24.0% rate — not tax advice; consult a CPA.
Schools (NCES district)
- District
- Pasco
- NCES district ID
- 1201530
- Math proficiency
- 50% ▼ -10.00%
- Reading proficiency
- 52% ▼ -5.00%
- Median HH income
- $45,039
- Composite
- 43.14/100
- National rank
- #3074
- State rank
- #32 of 73 in FL
Livability — Connerton
- Score
- 66/100
- State rank
- #596
- US rank
- #11437
Category grades
Schools grade is shown separately in the Schools card above.
Census & demographics
- County
- Pasco County · 524,098 people
- City population
- 11,398
- Metro
- Tampa-St. Petersburg-Clearwater, FL
- Population (ZIP)
- 37,644
- Household income
- $123,899
- Rent vs Own
- Severe rent burden
- 354.0
Population outlook (Pasco County) Hauer SSP2
- Today (2025)
- 570,045 people
- By 2030
- 605,844 · +6.3%
- By 2040
- 674,806 · +18.4%
- By 2050
- 736,022 · +29.1%
- By 2075
- 862,900 · +51.4%
- By 2100
- 906,364 · +59.0%
Race, ethnicity, and origin ACS 2023
- Neighborhood character
- Diverse neighborhood (Simpson 0.59)
- Race & ethnicity
- White 58% Hispanic / Latino 25% Two or more races 16% Black 6% Asian 4%
- Hispanic origin (detail)
- Mexican 1% Puerto Rican 6% Cuban 4% Dominican 3%
- Common ancestry
- Lithuanian 3% Romanian 3% Slovak 2%
- Foreign-born
- 17% · Canada, Jamaica
- Languages at home
- 76% English-only · Spanish 16% Other Indo-European 2% Arabic 2%
Political lean MEDSL · Pasco
- 2024 margin
- Strong R (+25.2) · D 36.9% · R 62.1% · Other 1.0%
- 2008→2024 swing
- -21.6pp toward R · 2008: -3.6pp · 2024: -25.2pp
- All cycles
- 2024: R+25.2 2020: R+20.1 2016: R+21.6 2012: R+6.7 2008: R+3.6
Not yet ingested
- Civics
- —
Market trends
- HPI YoY
- ▼ -57.02%
- Current HPI
- 299.2018
- Rent YoY
- ▼ -3.78%
- Metro
- Tampa-St. Petersburg-Clearwater, FL
- State GDP YoY
- ▲ 3.28%
- F500 in state
- 36
Industry mix (Fortune 500 HQ in FL)
| Industry | F500 HQs | Revenue |
|---|---|---|
| Industrial Technology | 2 | $29B |
|
||
| Insurance | 2 | $17B |
|
||
| Retail | 1 | $60B |
|
||
| Technology Distribution | 1 | $58B |
|
||
| Homebuilding | 1 | $35B |
|
||
| Technology Manufacturing | 1 | $35B |
|
||
Cash-flow waterfall
monthlySold comps — $/sqft
last 12 mo · ≤1 miLoading sold comps…