 6-Plex
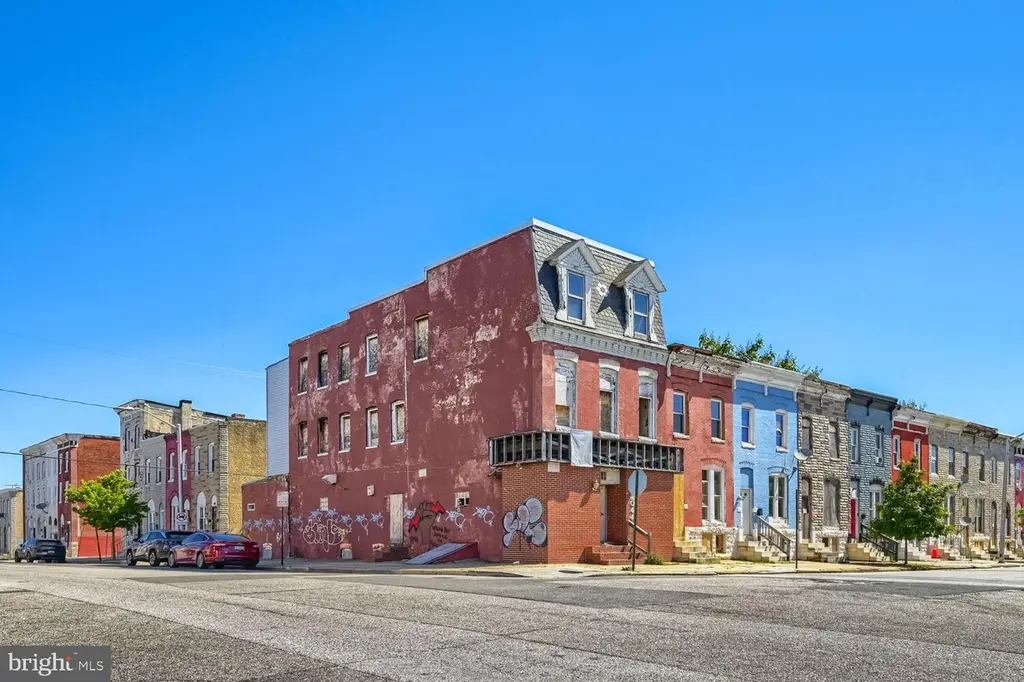
2044 Walbrook Ave · Baltimore, MD
Flood risk 1/10 · Minimal
- FEMA flood zone
- X (unshaded)
- Chance of flooding over 30 yrs
- 0.0%
- Est. flood insurance / yr
- $507 – $1,088
Fire risk 1/10 · Minimal
- Est. fire insurance / yr
- $755 – $1,403
Heat risk 7/10 · Major
- Hot days now (above 103°F)
- 7 days/yr
- Hot days in 30 yrs
- 15 days/yr
Wind risk 6/10 · Moderate
- Chance of severe wind over 30 yrs
- 27.0%
Air-quality risk 3/10 · Minor
- Unhealthy air days now
- 3 days/yr
- Unhealthy air days in 30 yrs
- 4 days/yr
Risk factors via First Street. Map © Google.
Why this score? — see what drove the D grade
The composite is a weighted blend of 9 inputs, each scored 0–100. Each bar is that input's sub-score; the figure is the points it added to the 100-point composite (weight × sub-score).
- Cash flow +15.0/30.0
- ARV discount +7.5/15.0
- 1% rule +5.0/10.0
- DSCR +5.0/10.0
- Rent growth +4.2/5.0
- Livability +3.8/5.0
- Condition / age +2.5/5.0
- Schools +1.0/10.0
- Appreciation +0.0/10.0
$75,000
🖨 Deal sheet (PDF) 📄 Offer letter ✓ Due diligence
Multi-family units
County records classify this as Multi-Family (2-4 Unit). Listing-text estimate: 6 units. estimate disagrees with records
Listing remarks
Approved 6-unit redevelopment opportunity. Estimated 3,700 sq. ft. three-level end-of-block building with approval for a 6-unit apartment building. Seller has invested over $60,000 and completed the difficult early-stage work, including full gut-out, new subfloors on the main, second, and third levels, a new roof, and new rear siding. This property was previously in shell condition — you could stand in the basement and see the sky — and it has now been stabilized and is ready for development. Seller has obtained the Mayor’s Office sign-off for the proposed 6-unit use. Approval letter and architectural drawings are available in the document section. Buyer to verify all perm
Key facts
- New rear siding
- New subfloors
- Full gut-out
Tags
Property features AI
Finance
- Other: Total below-grade area approximately 1,000; Above-grade finished area approximately 3,700; Unfinished below-grade area approximately 1,000
- Financial info: Improvement assessed at $18,000; Land assessed at $20,000; Ground rent ownership interest; Annual ground rent noted in income/expense list
Exterior
- Parking: Driveway
- Utilities: Public water; Public sewer
- Home design: End of row townhouse; Flat rubber roof
- Construction: Brick construction; Slab foundation; Major rehab needed; Year built per assessor
- Exterior features: Ground rent exists; semi-annual ground rent payment of $120; Above-grade and below-grade structures
Interior
- Bedrooms: Six one-bedroom units
- Interior features: Unfinished basement; Estimated living area
Neighborhood map
What this means for you Summary
Snapshot
- This is a 6 × 3-bed/1-bath units multifamily listed at $75k.
Deal economics
- At list price, monthly cash flow is $6k ($72k/yr) — positive. Per door: $995/mo.
- The deal already cash-flows at list — no discount required.
- Meets the 1% rule at list price ($8k rent vs $75k).
- Recommended offer: $74k (1.5% below list) — sets the bar for market timing.
- Cap rate 101.8% vs local median 6.0% in Baltimore — top-decile yield for the area; either an underpriced asset or a hidden risk that comps aren't pricing in. Stress-test before assuming the spread holds.
Location & tenants
- Location reads 76/100 on livability (#90 in MD, #3,396 nationally) — a middle-class / working-renter tenant base. Strengths: amenities A+, commute A+, housing A+; Watch: schools D, crime F.
- Baltimore City Public Schools (urban): math 7% / reading 16% proficiency, ranked #24 of 24 in MD (top 100%) — low school quality limits family demand, transient renter base, plan for 1-2y turnover; 79% free/reduced lunch — lower-income household profile, screen leases tightly.
- Market conditions: Rents rising fast (+6.6%/yr); 334 active listings in the ZIP; lower-income renter base — watch delinquency; 1,273 units permitted in Baltimore city in 2024 (1,104 in 5+ unit buildings).
- At $8,126/mo this rent would consume 254% of the median local household income ($38k/yr) (locally 2921% of renters already pay >50% of income on rent) — very limited rent-growth headroom before tenants either downsize or default.
Forward outlook
- Local home prices are declining (-3.0%/yr); year-one equity from $519 of loan paydown is wiped out by about $2k of value loss. Plan a longer hold.
- Baltimore County population projected to shrink 4% by 2050 — rents likely to lag national; underwrite the cash flow, not the appreciation.
- At projected returns (-3.0% appreciation + 6.6% rent growth), your $21k cash investment doubles in ~1 year — after that, you're playing with house money.
Negotiation context
- It's been on market 18 days — a 2% lower offer ($74k) is reasonable based on typical stale-listing flexibility.
- 6 sale attempts since 15y ago with the ask held roughly flat each time — persistent listings suggest the price (not the market) is what's stuck; bring a comps-based counter.
- Current owner paid $40k; list at $75k implies a 88% gain — meaningful room to come down on a strong offer.
Risks & watch-outs
- Watch-outs: built in 1920 — expect roof / HVAC / electrical / plumbing capex.
- Climate carrying-cost: major wind risk, 27% chance of damaging wind over 30y; extreme-heat days projected 7→15/yr by 2055 (HVAC capex compounding) — expect insurance premiums to compound above CPI over the hold.
Questions for the listing agent
- Can we see the unit-by-unit rent roll, current vacancy, and any below-market leases? What's the average tenancy length?
- What capital expenditures (roof, boiler, parking lot, exteriors) have been made in the last 5 years, and what's planned in the next 2?
- Built in 1920 — when were the roof, HVAC, electrical panel, plumbing, and water heater last replaced?
- Is there a deadline driving the sale (1031 exchange, divorce, estate, relocation)? That informs how much negotiation room exists.
- Schools are D-rated, which usually means shorter tenancies and higher turnover. Who's the typical renter profile here, and what's been the actual vacancy rate?
- Crime grade is F in this area — have there been break-ins, vandalism, or insurance claims at this property in the last 3 years? What carrier currently insures it and at what premium?
- The area grade is low — what's the realistic commute time and amenity access for the typical tenant pool here? Any planned neighborhood developments (good or bad) we should know about?
- What's the average days-on-market for RENTAL listings here right now (not sales)? A rising rental-DOM trend means longer vacancies and softer asking-rent achievability than the comps imply.
- What's the recent tenant-quality profile in this submarket — average credit score on applications, eviction rate, late-payment / NSF rate, and stable-employment percentage? A property-management company in the area should have these aggregated.
- How much new apartment / multifamily construction is in the pipeline within 1–3 miles? Heavy new supply (>2% of stock underway) typically softens rents 12–24 months out; light construction supports rent growth.
Investment metrics
- 1% rule
- 10.83% ✓
- Cap rate
- 101.81%
- Cash-on-cash
- 341.12%
- DSCR
- 16.18
- GRM
- 0.8
CMA / ARV
No comps found within radius.
Projected returns pro-forma
-3.0% appreciation · 6.63% rent growth · sell at horizon
- IRR
- —
- Equity multiple
- 19.99×
- Total profit
- $398,890
- Equity at exit
- $11,183
- IRR
- —
- Equity multiple
- 47.35×
- Total profit
- $973,270
- Equity at exit
- $6,485
Cash invested: $21,000 (down + closing). Projections, not guarantees.
Landlord ↔ Tenant lean methodology
- Overall (CITY)
- 12 Strongly Tenant-Friendly
- State Maryland
- 27 Tenant-Leaning · D+14
- County
- — inherits STATE
- City Baltimore
- 12 Strongly Tenant-Friendly · D+58
ZIP-level market 21217
- Rents YoY
- 6.6%
- Active inventory
- 334
- Price-to-rent
- 4.6×
Monthly cashflow live
- Estimated rent
- $8,126 high interval (Pro) →
- Mortgage (P&I)
- −$393
- Tax from tax record
- −$25 /mo · $305/yr
- Insurance
- −$31
- HOA
- −$0
- Vacancy / Maint / Mgmt
- −$1,706
- Net cashflow
- $5,970
Break-even live
Sensitivity live
| Price | -10% $6,012 | -5% $5,991 | +0% $5,970 | +5% $5,948 | +10% $5,927 |
|---|---|---|---|---|---|
| Rent | -10% $5,328 | -5% $5,649 | +0% $5,970 | +5% $6,291 | +10% $6,611 |
| Rate | -1.0pp $6,007 | -0.5pp $5,989 | base $5,970 | +0.5pp $5,950 | +1.0pp $5,930 |
6-unit breakdown (identical units grouped — click to expand)
| Units | Beds | Baths | Est. rent |
|---|---|---|---|
| 6× units | 3 | 1 | $8,124 |
| #1 | 3 | 1 | $1,354 |
| #2 | 3 | 1 | $1,354 |
| #3 | 3 | 1 | $1,354 |
| #4 | 3 | 1 | $1,354 |
| #5 | 3 | 1 | $1,354 |
| #6 | 3 | 1 | $1,354 |
| Total (6 units) | $8,126 | ||
UW: 25.0% down · 7.5% · 30yr · 1.5% tax · 5.0% vac · 8.0% maint · 8.0% mgmt
Financing live
Cash to close
- Down payment
- $18,750
- Closing costs
- $2,250
- Reserves months
- —
- Total cash needed
- —
Loan-product check · same deal, 3 products live
Conventional
25% down · 7.5% · 30yr
- Down + closing
- —
- Monthly P&I
- —
- Monthly cashflow
- —
- DSCR
- —
- Eligible?
- —
Personal DTI + credit; lowest rate.
DSCR
20% down · 8.5% · 30yr
- Down + closing
- —
- Monthly P&I
- —
- Monthly cashflow
- —
- DSCR
- —
- Eligible?
- —
No personal income docs; deal must DSCR.
Hard money
10% down · 12.0% · 12mo
- Down + closing
- —
- Monthly P&I
- —
- Monthly cashflow
- —
- DSCR
- —
- Eligible?
- —
Short-term bridge; refi at stabilization.
Listing history 11 events
-
2026-06-21days on market $75,000 Active 18 DOM
-
2026-06-18days on market $75,000 Active 15 DOM
-
2026-06-17days on market $75,000 Active 14 DOM
-
2026-06-16days on market $75,000 Active 13 DOM
-
2026-06-15days on market $75,000 Active 12 DOM
-
2026-06-13days on market $75,000 Active 10 DOM
-
2026-06-09days on market $75,000 Active 6 DOM
-
2026-06-08days on market $75,000 Active 5 DOM
-
2026-06-07days on market $75,000 Active 4 DOM
-
2026-06-04remarks 681-char remark
-
2026-06-04$75,000 Active 1 DOM
ⓘ Source: listings_history table (triggers on properties + properties_extension) + one-shot
backfill from property_details.listing_events for pre-trigger history.
Tax reassessment forecast MD · Partial reset (capped growth)
- Current annual tax
- $305 · $25/mo
- Projected year-2 tax
- $561 · $47/mo
- Expected delta
- +$256/yr (+$21/mo · 83.9%)
ⓘ Screening estimate from a state-policy table — verify with the county assessor before closing.
Climate risk First Street
- Flood 1/10 Low FEMA zone X (unshaded) · 0% chance over 30 yrs
- Wildfire 1/10 Low
- Heat 7/10 Severe 7 d/yr ≥103°F today · 15 d/yr by 30 yrs out
- Wind 6/10 Major 27% chance of damaging wind over 30 yrs
- Air quality 3/10 Moderate 3 unhealthy d/yr today · 4 by 30 yrs out
Nearby sold comps map
Loading sold comps map…
Walkable amenities ~0.75 mi
Loading nearby amenities…
Taxation est. · year 1
- Rental income
- $97,512
- − Mortgage interest
- −$4,201
- − Property taxes
- −$305
- − Insurance
- −$375
- − Repairs & maintenance
- −$7,801
- − Management
- −$7,801
- − Depreciation
- −$2,182
- Taxable income
- $74,847
- Est. tax owed @ 24.0%
- −$17,963
- After-tax cash flow
- $53,671/yr
For passive investors: Depreciation is non-cash, so a rental often shows a tax loss while cash-flowing — sheltering income. Rental losses are passive: they offset passive income freely, and up to $25,000/yr can offset ordinary (W-2) income if you actively participate and your MAGI is under $100k (phasing out to $0 by $150k); unused losses carry forward. On sale, claimed depreciation is recaptured at up to 25%, and gains may owe capital-gains tax (a 1031 exchange can defer both). Figures are a year-1 estimate at your 24.0% rate — not tax advice; consult a CPA.
Schools (NCES district)
- District
- Baltimore City Public Schools
- NCES district ID
- 2400090
- Math proficiency
- 7% ▼ -9.00%
- Reading proficiency
- 16% ▼ -5.00%
- Median HH income
- $42,108
- Composite
- 10.08/100
- National rank
- #9805
- State rank
- #24 of 24 in MD
Livability — Baltimore
- Score
- 76/100
- State rank
- #90
- US rank
- #3396
Category grades
Schools grade is shown separately in the Schools card above.
Census & demographics
- Census place
- Baltimore, MD
- County
- Baltimore City · 558,601 people
- City population
- 588,727
- Metro
- Baltimore-Columbia-Towson, MD
- Population (ZIP)
- 30,792
- Household income
- $38,409
- Rent vs Own
- Severe rent burden
- 2921.0
Population outlook (Baltimore County) Hauer SSP2
- Today (2025)
- 624,249 people
- By 2030
- 621,541 · -0.4%
- By 2040
- 609,756 · -2.3%
- By 2050
- 597,249 · -4.3%
- By 2075
- 552,236 · -11.5%
- By 2100
- 513,934 · -17.7%
Race, ethnicity, and origin ACS 2023
- Neighborhood character
- Predominantly Black (81%)
- Race & ethnicity
- Black 81% White 12% Two or more races 4% Hispanic / Latino 2% Asian 2%
- Common ancestry
- Romanian 1% Hispanic 1% Italian 1%
- Foreign-born
- 5% · Canada, China, South Korea
- Languages at home
- 94% English-only · Spanish 2% French/Haitian/Cajun 1% Chinese 1%
Political lean MEDSL · Baltimore
- 2024 margin
- Solid D (+73.0) · D 85.2% · R 12.2% · Other 2.6%
- 2008→2024 swing
- -2.5pp toward R · 2008: 75.5pp · 2024: 73.0pp
- All cycles
- 2024: D+73.0 2020: D+76.6 2016: D+74.6 2012: D+76.4 2008: D+75.5
Not yet ingested
- Civics
- —
Market trends
- HPI YoY
- ▼ -187.20%
- Current HPI
- 104.2102
- Rent YoY
- ▲ 6.63%
- Metro
- Baltimore-Columbia-Towson, MD
- State GDP YoY
- ▲ 2.97%
- F500 in state
- 12
Industry mix (Fortune 500 HQ in MD)
| Industry | F500 HQs | Revenue |
|---|---|---|
| Aerospace / Defense | 1 | $71B |
|
||
| Utilities | 1 | $25B |
|
||
| Hotels | 1 | $24B |
|
||
| Consumer Goods | 1 | $7B |
|
||
| Real Estate | 1 | $6B |
|
||
| Chemicals | 1 | $2B |
|
||
Price history
+87.5% since first listed14 events — show timeline
- 2026-06-03 Listed $75,000 BRIGHT MLS
- 2025-12-19 Listing Removed — BRIGHT MLS
- 2025-11-03 Relisted — BRIGHT MLS
- 2025-09-01 Contingent — BRIGHT MLS
- 2025-01-28 Listed $280,000 BRIGHT MLS
- 2024-12-29 Listing Removed — BRIGHT MLS
- 2024-12-19 Price Changed $289,000 BRIGHT MLS
- 2024-12-08 Listed $295,000 BRIGHT MLS
- 2012-02-17 Delisted — MRIS
- 2012-02-17 Listing Removed — BRIGHT MLS
- 2011-12-05 Price Changed — MRIS
- 2011-11-28 Listed — MRIS
- 2011-11-28 Listed $18,000 BRIGHT MLS
- 1995-11-28 Sold (Public Records) $40,000 Public Records
Property tax history
-2.6%/yrLatest (2025): $305 · +18.2% YoY. Source: county tax records.
Cash-flow waterfall
monthlySold comps — $/sqft
last 12 mo · ≤1 miLoading sold comps…