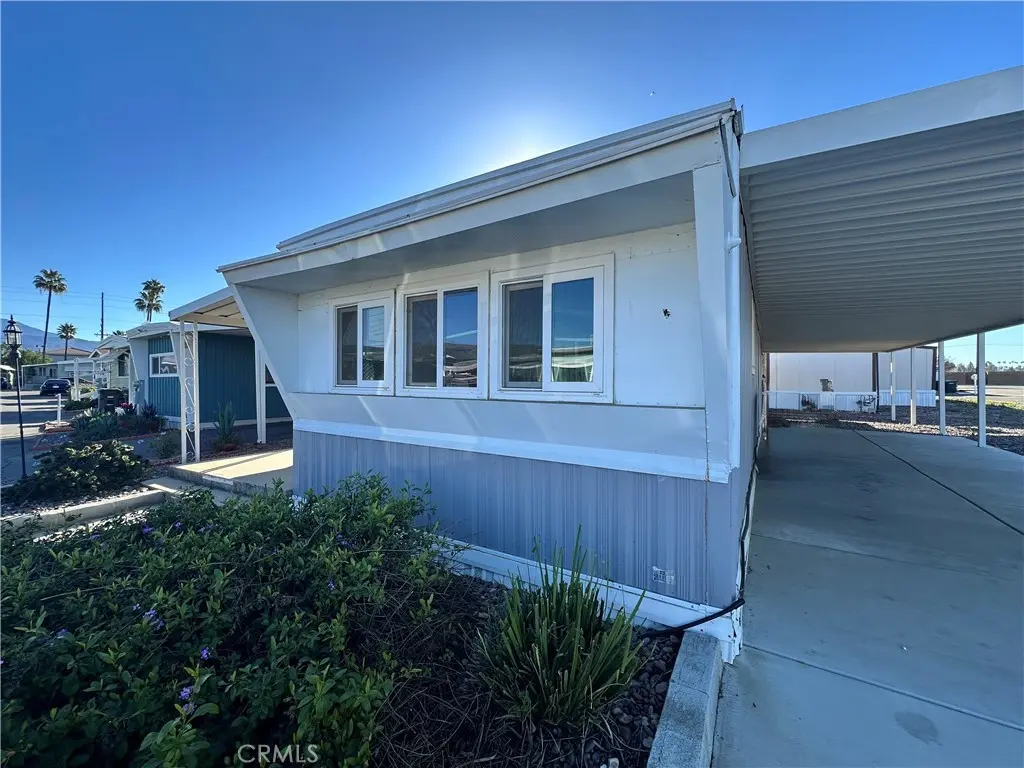
1600 S San Jacinto Ave #82 · San Jacinto, CA
Flood risk 1/10 · Minimal
- FEMA flood zone
- X (unshaded)
- Chance of flooding over 30 yrs
- 0.0%
- Est. flood insurance / yr
- $507 – $1,088
Fire risk 4/10 · Minor
- Est. fire insurance / yr
- $659 – $1,223
Heat risk 7/10 · Major
- Hot days now (above 104°F)
- 5 days/yr
- Hot days in 30 yrs
- 15 days/yr
Wind risk 1/10 · Minimal
- Chance of severe wind over 30 yrs
- —
Air-quality risk 6/10 · Moderate
- Unhealthy air days now
- 12 days/yr
- Unhealthy air days in 30 yrs
- 14 days/yr
Risk factors via First Street. Map © Google.
Why this score? — see what drove the B- grade
The composite is a weighted blend of 9 inputs, each scored 0–100. Each bar is that input's sub-score; the figure is the points it added to the 100-point composite (weight × sub-score).
- Cash flow +30.0/30.0
- 1% rule +10.0/10.0
- DSCR +10.0/10.0
- ARV discount +6.8/15.0
- Rent growth +3.2/5.0
- Livability +3.2/5.0
- Condition / age +2.5/5.0
- Schools +2.1/10.0
- Appreciation +0.0/10.0
$39,900
🖨 Deal sheet (PDF) 📄 Offer letter ✓ Due diligence
Listing remarks
All Age Community! Blue Fountain Park, This affordable and beautifully updated 1-bedroom, 1-bath home features new carpet, an upgraded kitchen with new cabinets, a new Tub/Shower Combo, Home has all new dual-pane windows. Enjoy resort-style amenities like a clubhouse, pool, spa, and picnic area—near Aldi, Walmart, as well as other shopping, and medical facilities and not far from Soboba Casino. Don’t miss this move-in ready gem, Schedule your tour today!
Key facts
- Community pool
- Built 1963
- Listed 12 days
Property features AI
Finance
- Other: Park name: Blue Fountain; Access via maintained, paved city streets; Walk score: 28
- Financial info: Monthly land lease of $724 (seller reported)
- HOA & community: Land lease community with monthly land lease; Community features include dog park and street lighting; Manager approval required for tenancy; contact park management for pet policy
Exterior
- Parking: Concrete driveway; Paved parking areas; Attached carport
- Security: Carbon monoxide and smoke detectors; Resident manager
- Utilities: Standard electricity; Natural gas connected; Public/district water connected; Public sewer connected
- Home design: Single-story/mobile setting; Mobile home remains (12' x 57'); Has a view; Estimated living area
- Construction: Metal construction materials
- Exterior features: Awning; Concrete patio; In-ground community pool (fenced); Shed on property
Interior
- Kitchen: Formica counters; Refrigerator; Gas range / Free standing range; Range/stove hood; Gas water heater (central water heater listed)
- Bedrooms: All bedrooms located on the main level
- Flooring: Vinyl flooring; Carpet
- Bathrooms: One full bathroom with bathtub and shower-in-tub; Formica counters in bathroom
- Heating & cooling: Forced air heating (natural gas); Central cooling
- Interior features: One-level home with ground-level entry; Updated/remodeled condition; Double-pane windows; Carbon monoxide and smoke detectors; Resident manager on site; In-ground heated spa
- Laundry & utility: Community laundry available
Neighborhood map
What this means for you Summary
Snapshot
- This is a 1-bed/1.0-bath manufactured listed at $40k.
Deal economics
- At list price, monthly cash flow is $675 ($8k/yr) — positive.
- The deal already cash-flows at list — no discount required.
- Meets the 1% rule at list price ($1k rent vs $40k).
- Cap rate 26.6% vs local median 3.8% in San Jacinto — top-decile yield for the area; either an underpriced asset or a hidden risk that comps aren't pricing in. Stress-test before assuming the spread holds.
Location & tenants
- Location reads 63/100 on livability (#467 in CA) — a middle-class / working-renter tenant base. Strengths: housing A+; Watch: employment D+, amenities F, cost of living F.
- San Jacinto Unified (suburban): math 13% / reading 36% proficiency, ranked #421 of 517 in CA (top 81%) — low school quality limits family demand, transient renter base, plan for 1-2y turnover; 68% free/reduced lunch — lower-income household profile, screen leases tightly.
- Zoned schools: Park Hill Elementary (890 students, 87% FRL); North Mountain Middle (math 24% / reading 24%, grade F, #277 of 498 statewide, top 73%, 844 students, 90% FRL); San Jacinto High (math 14% / reading 38%, grade F, #807 of 1,170 statewide, top 69%, 2,617 students, 85% FRL) — zoned schools average 87% FRL vs 68% district-wide (20 pts higher); higher-poverty schools than district average — tighter screening recommended.
- Market conditions: Rents rising (+2.6%/yr); 160 active listings in the ZIP; 15 comparable units currently listed for rent nearby; rentals at typical pace (median 27d on market — plan ~3-4 weeks tenant-placement turnaround); 9,195 units permitted in Riverside County in 2024 (1,512 in 5+ unit buildings).
Forward outlook
- Local home prices are declining (-3.0%/yr); year-one equity from $276 of loan paydown is wiped out by about $1k of value loss. Plan a longer hold.
- Riverside County population projected at +22% by 2050 — long-run rental-demand tailwind backs the buy-and-hold thesis.
- At projected returns (-3.0% appreciation + 2.6% rent growth), your $11k cash investment doubles in ~2 years — after that, you're playing with house money.
Negotiation context
- Only 12 days on market — expect competitive offers; lowballing is unlikely to land.
- 2 sale attempts with the ask held roughly flat each time — persistent listings suggest the price (not the market) is what's stuck; bring a comps-based counter.
Risks & watch-outs
- Climate carrying-cost: extreme-heat days projected 5→15/yr by 2055 (HVAC capex compounding) — expect insurance premiums to compound above CPI over the hold.
Questions for the listing agent
- Built in 1963 — when were the roof, HVAC, electrical panel, plumbing, and water heater last replaced?
- Is there a deadline driving the sale (1031 exchange, divorce, estate, relocation)? That informs how much negotiation room exists.
- Schools are D-rated, which usually means shorter tenancies and higher turnover. Who's the typical renter profile here, and what's been the actual vacancy rate?
- What's the average days-on-market for RENTAL listings here right now (not sales)? A rising rental-DOM trend means longer vacancies and softer asking-rent achievability than the comps imply.
- What's the recent tenant-quality profile in this submarket — average credit score on applications, eviction rate, late-payment / NSF rate, and stable-employment percentage? A property-management company in the area should have these aggregated.
- How much new for-sale + rental construction is in the pipeline within 1–3 miles? Heavy new supply typically softens prices + rents 12–24 months out; constrained supply supports both.
Investment metrics
- 1% rule
- 3.02% ✓
- Cap rate
- 26.60%
- Cash-on-cash
- 72.51%
- DSCR
- 4.23
- GRM
- 2.8
CMA / ARV
- ARV (median comp)
- $39,257
- List price
- $39,900
- Delta
- 9.28%
- Verdict
- FAIR
- Comps
- 20 within 1.0 mi
Show comp detail 10 sales within ~0.75 mi
| Address | Dist | Beds/Ba | Sqft | Sold | Price | $/sf | Match |
|---|---|---|---|---|---|---|---|
| 1600 S San Jacinto Ave #114 | 0.03mi | 1/1.0 | 660 (-4%) | 16mo | $8,000 | $12 | 80 |
| 1600-Spc 75 S San Jacinto Ave | 0.00mi | 2/1.0 (+1) | 738 (+8%) | 8mo | $40,000 | $54 | 76 |
| 1600 S San Jacinto Ave #66 | 0.00mi | 2/1.0 (+1) | 728 (+6%) | 13mo | $27,500 | $38 | 73 |
| 999 S Santa Fe #48 | 0.46mi | 1/1.0 | 624 (-9%) | 1mo | $20,500 | $33 | 63 |
| 1600 S San Jacinto Ave #138 | 0.15mi | 2/2.0 (+1) | 760 (+11%) | 3mo | $47,500 | $63 | 63 |
| 1600 S San Jacinto Ave #87 | 0.00mi | 2/2.0 (+1) | 760 (+11%) | 14mo | $55,000 | $72 | 61 |
| 999 S Santa Fe Ave #45 | 0.47mi | 2/1.0 (+1) | 720 (+5%) | 12mo | $16,500 | $23 | 55 |
| 999 S Santa Fe Ave #3 | 0.47mi | 1/1.0 | 756 (+10%) | 12mo | $13,000 | $17 | 51 |
| 999 S Santa Fe Ave #36 | 0.46mi | 1/1.0 | 624 (-9%) | 19mo | $38,000 | $61 | 48 |
| 999 S Santa Fe Ave #88 | 0.46mi | 2/1.0 (+1) | 768 (+12%) | 18mo | $36,000 | $47 | 38 |
Match score weights: distance 35% · size 25% · config 20% · recency 20%. Top-matched comps best support the ARV.
Projected returns pro-forma
-3.0% appreciation · 2.61% rent growth · sell at horizon
- IRR
- 71.8%
- Equity multiple
- 4.23×
- Total profit
- $36,078
- Equity at exit
- $5,949
- IRR
- 75.6%
- Equity multiple
- 8.60×
- Total profit
- $84,938
- Equity at exit
- $3,450
Cash invested: $11,172 (down + closing). Projections, not guarantees.
Landlord ↔ Tenant lean methodology
- Overall (STATE)
- 18 Strongly Tenant-Friendly
- State California
- 18 Strongly Tenant-Friendly · D+13
- County
- — inherits STATE
- City
- — inherits STATE
ZIP-level market 92583
- Home prices YoY
- -14.8%
- Rents YoY
- 2.6%
- Active inventory
- 160
- Price-to-rent
- 2.8×
Monthly cashflow live
- Estimated rent
- $1,204 high interval (Pro) →
- Mortgage (P&I)
- −$209
- Tax est. 1.5%
- −$50 /mo · $598/yr
- Insurance
- −$17
- HOA
- −$0
- Lot rent leased land?
- −$0
- Vacancy / Maint / Mgmt
- −$253
- Net cashflow
- $675
Break-even live
Sensitivity live
| Price | -10% $703 | -5% $689 | +0% $675 | +5% $661 | +10% $647 |
|---|---|---|---|---|---|
| Rent | -10% $580 | -5% $628 | +0% $675 | +5% $723 | +10% $770 |
| Rate | -1.0pp $695 | -0.5pp $685 | base $675 | +0.5pp $665 | +1.0pp $654 |
UW: 25.0% down · 7.5% · 30yr · 1.5% tax · 5.0% vac · 8.0% maint · 8.0% mgmt
Financing live
Cash to close
- Down payment
- $9,975
- Closing costs
- $1,197
- Reserves months
- —
- Total cash needed
- —
Loan-product check · same deal, 3 products live
Conventional
25% down · 7.5% · 30yr
- Down + closing
- —
- Monthly P&I
- —
- Monthly cashflow
- —
- DSCR
- —
- Eligible?
- —
Personal DTI + credit; lowest rate.
DSCR
20% down · 8.5% · 30yr
- Down + closing
- —
- Monthly P&I
- —
- Monthly cashflow
- —
- DSCR
- —
- Eligible?
- —
No personal income docs; deal must DSCR.
Hard money
10% down · 12.0% · 12mo
- Down + closing
- —
- Monthly P&I
- —
- Monthly cashflow
- —
- DSCR
- —
- Eligible?
- —
Short-term bridge; refi at stabilization.
Rent comps 15 comps
| Address | Beds | Baths | Sqft | Rent | $/sqft | DOM | Units | Dist |
|---|---|---|---|---|---|---|---|---|
| 811 E Menlo Ave Unit 02 Hemet, CA | 1.0 | 1.0 | 550 | $1,300 | $2.36 | 46d | 1 | 0.92mi |
| 811 E Menlo Ave Apt 12 Hemet, CA | 1.0 | 1.0 | 550 | $1,300 | $2.36 | 26d | 1 | 0.92mi |
| 320 S Pico Ave San Jacinto, CA | 2.0 | 1.0 | 650 | $1,500 | $2.31 | 46d | 1 | 0.92mi |
| 526 Greystone Ln Hemet, CA | 2.0 | 1.0 | 700 | $1,600 | $2.29 | 20d | 1 | 1.06mi |
| 526 Greystone Ln Hemet, CA | 2.0 | 1.0 | 700 | $1,600 | $2.29 | 46d | 1 | 1.06mi |
| 526 Greystone Ln Apt 3 Hemet, CA | 2.0 | 1.0 | 700 | $1,650 | $2.36 | 46d | 1 | 1.06mi |
| 560 E Oakland Ave Apt P Hemet, CA | 1.0 | 1.0 | 550 | $1,325 | $2.41 | 19d | 1 | 1.15mi |
| 700 E Main St Unit 08 San Jacinto, CA | 2.0 | 1.0 | 750 | $1,395 | $1.86 | 26d | 1 | 1.19mi |
| 1376 E Date St Unit 5 Hemet, CA | 2.0 | 1.0 | 650 | $1,500 | $2.31 | 19d | 1 | 1.23mi |
| 426 N Buena Vista St Hemet, CA | 2.0 | 1.0 | 680 | $1,550 | $2.28 | 6d | 1 | 1.24mi |
| 426 N Buena Vista St Apt 1 Hemet, CA | 2.0 | 1.0 | 680 | $1,550 | $2.28 | 10d | 1 | 1.24mi |
| 359 N Wateka St San Jacinto, CA | 1.0 | 1.0 | 440 | $1,425 | $3.24 | 1d | 1 | 1.41mi |
| 210 N Santa Fe St Hemet, CA | 1.0 | 1.0 | 600 | $1,300 | $2.17 | 6d | 1 | 1.46mi |
| 1955 E Devonshire Ave Hemet, CA | 1.0 | 1.0 | 500 | $1,350 | $2.70 | 26d | 1 | 1.49mi |
| 1955 E Devonshire Ave Hemet, CA | 1.0 | 1.0 | 500 | $1,450 | $2.90 | 46d | 1 | 1.49mi |
Listing history 12 events
-
2026-06-22days on market $39,900 Active 12 DOM
-
2026-06-21days on market $39,900 Active 11 DOM
-
2026-06-18days on market $39,900 Active 8 DOM
-
2026-06-17days on market $39,900 Active 7 DOM
-
2026-06-16days on market $39,900 Active 6 DOM
-
2026-06-15days on market $39,900 Active 5 DOM
-
2026-06-13days on market $39,900 Active 3 DOM
-
2026-06-13pricedays on market $39,900 Active 2 DOM
-
2026-05-31days on market $42,900 Active 491 DOM
-
2025-12-20price $42,900 470-char remark
-
2025-07-18price $44,000 470-char remark
-
2025-01-25$49,000 Active 470-char remark
ⓘ Source: listings_history table (triggers on properties + properties_extension) + one-shot
backfill from property_details.listing_events for pre-trigger history.
Climate risk First Street
- Flood 1/10 Low FEMA zone X (unshaded) · 0% chance over 30 yrs
- Wildfire 4/10 Moderate
- Heat 7/10 Severe 5 d/yr ≥104°F today · 15 d/yr by 30 yrs out
- Wind 1/10 Low
- Air quality 6/10 Major 12 unhealthy d/yr today · 14 by 30 yrs out
Nearby sold comps map
Loading sold comps map…
Walkable amenities ~0.75 mi
Loading nearby amenities…
Taxation est. · year 1
- Rental income
- $14,443
- − Mortgage interest
- −$2,235
- − Property taxes
- −$598
- − Insurance
- −$200
- − Repairs & maintenance
- −$1,155
- − Management
- −$1,155
- − Depreciation
- −$1,161
- Taxable income
- $7,938
- Est. tax owed @ 24.0%
- −$1,905
- After-tax cash flow
- $6,196/yr
For passive investors: Depreciation is non-cash, so a rental often shows a tax loss while cash-flowing — sheltering income. Rental losses are passive: they offset passive income freely, and up to $25,000/yr can offset ordinary (W-2) income if you actively participate and your MAGI is under $100k (phasing out to $0 by $150k); unused losses carry forward. On sale, claimed depreciation is recaptured at up to 25%, and gains may owe capital-gains tax (a 1031 exchange can defer both). Figures are a year-1 estimate at your 24.0% rate — not tax advice; consult a CPA.
Schools (NCES district)
- District
- San Jacinto Unified
- NCES district ID
- 0634440
- Math proficiency
- 13% ▼ -9.00%
- Reading proficiency
- 36% ▬ 0.00%
- Median HH income
- $43,560
- Composite
- 20.94/100
- National rank
- #8478
- State rank
- #421 of 517 in CA
Livability — San Jacinto
- Score
- 63/100
- State rank
- #467
- US rank
- #15889
Category grades
Schools grade is shown separately in the Schools card above.
Census & demographics
- Census place
- San Jacinto, CA
- County
- Riverside County · 2,287,001 people
- City population
- 33,778
- Metro
- Riverside-San Bernardino-Ontario, CA
- Population (ZIP)
- 33,778
- Household income
- $68,351
- Rent vs Own
- Severe rent burden
- 747.0
Population outlook (Riverside County) Hauer SSP2
- Today (2025)
- 2,664,475 people
- By 2030
- 2,802,692 · +5.2%
- By 2040
- 3,050,904 · +14.5%
- By 2050
- 3,256,783 · +22.2%
- By 2075
- 3,655,058 · +37.2%
- By 2100
- 3,766,594 · +41.4%
Race, ethnicity, and origin ACS 2023
- Neighborhood character
- Diverse neighborhood (Simpson 0.57)
- Race & ethnicity
- Hispanic / Latino 60% White 26% Two or more races 23% Black 5% Asian 3% Native American 3%
- Hispanic origin (detail)
- Mexican 52%
- Common ancestry
- Lithuanian 1% Iranian 1% Portuguese 1%
- Foreign-born
- 20% · Canada
- Languages at home
- 56% English-only · Spanish 40% Tagalog/Filipino 2% Other Asian/Pacific 1%
Political lean MEDSL · Riverside
- 2024 margin
- Toss-up / Even · D 48.0% · R 49.3% · Other 2.6%
- 2008→2024 swing
- -3.6pp toward R · 2008: 2.3pp · 2024: -1.3pp
- All cycles
- 2024: R+1.3 2020: D+8.0 2016: D+4.3 2012: R+0.4 2008: D+2.3
Not yet ingested
- Civics
- —
Market trends
- HPI YoY
- ▼ -71.15%
- Current HPI
- 407.8584
- Rent YoY
- ▲ 2.61%
- Metro
- Riverside-San Bernardino-Ontario, CA
- State GDP YoY
- ▲ 3.21%
- F500 in state
- 116
Industry mix (Fortune 500 HQ in CA)
| Industry | F500 HQs | Revenue |
|---|---|---|
| Technology | 27 | $1,492B |
|
||
| Financial Services | 3 | $174B |
|
||
| Retail | 3 | $44B |
|
||
| Insurance | 3 | $26B |
|
||
| Media / Entertainment | 2 | $115B |
|
||
| Pharmaceuticals / Biotech | 2 | $62B |
|
||
Price history
-18.6% since first listed5 events — show timeline
- 2026-06-10 Listed $39,900 CRMLS
- 2026-05-31 Listing Removed — CRMLS
- 2025-12-20 Price Changed $42,900 CRMLS
- 2025-07-18 Price Changed $44,000 CRMLS
- 2025-01-25 Listed $49,000 CRMLS
Cash-flow waterfall
monthlySold comps — $/sqft
last 12 mo · ≤1 miLoading sold comps…