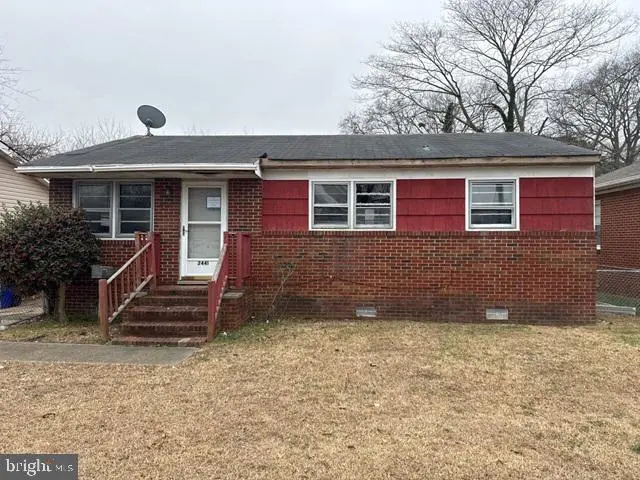
2441 Alder St · Norfolk, VA
Flood risk 1/10 · Minimal
- FEMA flood zone
- X (unshaded)
- Chance of flooding over 30 yrs
- 0.0%
- Est. flood insurance / yr
- $507 – $1,088
Fire risk 1/10 · Minimal
- Est. fire insurance / yr
- $666 – $1,236
Heat risk 9/10 · Severe
- Hot days now (above 105°F)
- 7 days/yr
- Hot days in 30 yrs
- 16 days/yr
Wind risk 8/10 · Major
- Chance of severe wind over 30 yrs
- 80.0%
Air-quality risk 3/10 · Minor
- Unhealthy air days now
- 2 days/yr
- Unhealthy air days in 30 yrs
- 3 days/yr
Risk factors via First Street. Map © Google.
Why this score? — see what drove the B- grade
The composite is a weighted blend of 9 inputs, each scored 0–100. Each bar is that input's sub-score; the figure is the points it added to the 100-point composite (weight × sub-score).
- Cash flow +23.7/30.0
- ARV discount +15.0/15.0
- DSCR +7.6/10.0
- 1% rule +6.4/10.0
- Livability +4.2/5.0
- Schools +3.5/10.0
- Rent growth +3.4/5.0
- Condition / age +2.5/5.0
- Appreciation +0.0/10.0
$148,100
🖨 Deal sheet 📄 Offer letter ✓ Due diligence
Listing remarks MLS
Opportunity awaits in this three bedroom, one bath home. Some work/refreshing is required to make this home move in ready but could be worth the effort. Whether you decide to customize this home for yourself or rent it out, this house could be a great option. RESERVE AUCTION PROPERTY- Property sold “AS-IS” without contingencies, repairs, warranties, guarantees or representation as to listing accuracy, property information, photo or other depiction included or described herein. Inspect before bidding.
Key facts
- 5,314 sq ft lot
- Garage
- Built 1966
Neighborhood map
What this means for you Summary
Snapshot
- This is a 3-bed/1.0-bath single-family listed at $148k.
Deal economics
- At list price, monthly cash flow is $283 ($3k/yr) — positive.
- The deal already cash-flows at list — no discount required.
- Meets the 1% rule at list price ($2k rent vs $148k).
- Recommended offer: $139k (6.0% below list) — sets the bar for market timing.
- Cap rate 8.6% vs local median 4.0% in Norfolk — top-decile yield for the area; either an underpriced asset or a hidden risk that comps aren't pricing in. Stress-test before assuming the spread holds.
Location & tenants
- Location reads 83/100 on livability (#43 in VA, #1,026 nationally) — a professional / high-income tenant draw. Strengths: amenities A+, commute A+, health & safety A+; Watch: employment C-, crime F.
- Norfolk City Public School District (urban): math 27% / reading 56% proficiency, ranked #118 of 131 in VA (top 90%) — families likely to look elsewhere, expect single-tenant / working-renter base with shorter leases.
- Market conditions: Rents rising (+3.4%/yr); 132 active listings in the ZIP; 40 comparable units currently listed for rent nearby; rentals at typical pace (median 21d on market — plan ~3-4 weeks tenant-placement turnaround); 438 units permitted in Norfolk city in 2024 (273 in 5+ unit buildings).
Forward outlook
- Local home prices are declining (-3.0%/yr); year-one equity from $1k of loan paydown is wiped out by about $4k of value loss. Plan a longer hold.
Negotiation context
- It's been on market 70 days — a 6% lower offer ($139k) is reasonable based on typical stale-listing flexibility.
- Current owner paid $95k; list at $148k implies a 56% gain — meaningful room to come down on a strong offer.
Risks & watch-outs
- Climate carrying-cost: severe wind risk, 80% chance of damaging wind over 30y; extreme-heat days projected 7→16/yr by 2055 (HVAC capex compounding) — expect insurance premiums to compound above CPI over the hold.
Questions for the listing agent
- It's been on market 70 days. Have you received any prior offers? Is the seller open to a 6% concession, seller financing, or rate buy-down credit?
- Built in 1966 — when were the roof, HVAC, electrical panel, plumbing, and water heater last replaced?
- Why hasn't it sold? Are there any deal-killer items the seller is aware of (foundation, flood, title, zoning, code violations)?
- Is there a deadline driving the sale (1031 exchange, divorce, estate, relocation)? That informs how much negotiation room exists.
- Schools are A-rated — typically a magnet for longer-tenancy family renters. What's the average tenant stay here, and is there a school-zone premium baked into asking?
- Crime grade is F in this area — have there been break-ins, vandalism, or insurance claims at this property in the last 3 years? What carrier currently insures it and at what premium?
- What's the average days-on-market for RENTAL listings here right now (not sales)? A rising rental-DOM trend means longer vacancies and softer asking-rent achievability than the comps imply.
- What's the recent tenant-quality profile in this submarket — average credit score on applications, eviction rate, late-payment / NSF rate, and stable-employment percentage? A property-management company in the area should have these aggregated.
- How much new for-sale + rental construction is in the pipeline within 1–3 miles? Heavy new supply typically softens prices + rents 12–24 months out; constrained supply supports both.
Investment metrics
- 1% rule
- 1.14% ✓
- Cap rate
- 8.58%
- Cash-on-cash
- 8.18%
- DSCR
- 1.36
- GRM
- 7.3
CMA / ARV
- ARV (median comp)
- $274,364
- List price
- $148,100
- Delta
- -46.02%
- Verdict
- UNDERPRICED
- Comps
- 20 within 1.0 mi
Show comp detail 12 sales within ~0.75 mi
| Address | Dist | Beds/Ba | Sqft | Sold | Price | $/sf | Match |
|---|---|---|---|---|---|---|---|
| 2420 Juniper St | 0.13mi | 3/1.0 | 1,069 (+3%) | 1mo | $149,999 | $140 | 89 |
| 2413 Hemlock St | 0.16mi | 3/1.5 | 1,092 (+5%) | 1mo | $295,000 | $270 | 81 |
| 4741 Krick St | 0.34mi | 3/1.5 | 1,050 (+1%) | 0mo | $185,000 | $176 | 80 |
| 3760 Larkin St | 0.35mi | 3/2.0 | 1,068 (+3%) | 2mo | $305,000 | $286 | 73 |
| 2404 Nevada Ave | 0.48mi | 3/2.0 | 1,013 (-3%) | 2mo | $319,999 | $316 | 68 |
| 2719 Overbrook Ave | 0.45mi | 3/2.0 | 1,100 (+6%) | 2mo | $290,000 | $264 | 64 |
| 2429 Wyoming Ave | 0.55mi | 3/1.0 | 1,088 (+5%) | 3mo | $143,000 | $131 | 64 |
| 3708 Tait Ter | 0.44mi | 3/2.0 | 1,158 (+11%) | 0mo | $285,000 | $246 | 56 |
| 3753 Davis St | 0.38mi | 2/1.0 (-1) | 912 (-12%) | 3mo | $250,000 | $274 | 54 |
| 1558 Norcova Ave | 0.47mi | 3/2.0 | 1,184 (+14%) | 1mo | $245,000 | $207 | 50 |
| 3705 Nottaway St | 0.67mi | 2/1.0 (-1) | 917 (-12%) | 2mo | $246,000 | $268 | 42 |
| 4885 Beamon Rd | 0.71mi | 4/2.0 (+1) | 1,177 (+13%) | 0mo | $315,000 | $268 | 36 |
Match score weights: distance 35% · size 25% · config 20% · recency 20%. Top-matched comps best support the ARV.
Projected returns pro-forma
-3.0% appreciation · 3.42% rent growth · sell at horizon
- IRR
- -3.4%
- Equity multiple
- 0.87×
- Total profit
- $-5,242
- Equity at exit
- $22,082
- IRR
- 6.8%
- Equity multiple
- 1.52×
- Total profit
- $21,748
- Equity at exit
- $12,805
Cash invested: $41,468 (down + closing). Projections, not guarantees.
Landlord ↔ Tenant lean methodology
- Overall (STATE)
- 55 Moderately Landlord-Leaning
- State Virginia
- 55 Moderately Landlord-Leaning · D+2
- County
- — inherits STATE
- City
- — inherits STATE
ZIP-level market 23513
- Home prices YoY
- -9.3%
- Rents YoY
- 3.4%
- Active inventory
- 132
- Price-to-rent
- 7.3×
Monthly cashflow live
- Estimated rent
- $1,689 high interval (Pro) →
- Mortgage (P&I)
- −$777
- Tax from tax record
- −$213 /mo · $2,557/yr
- Insurance
- −$62
- HOA
- −$0
- Vacancy / Maint / Mgmt
- −$355
- Net cashflow
- $283
Break-even live
UW: 25.0% down · 7.5% · 30yr · 1.5% tax · 5.0% vac · 8.0% maint · 8.0% mgmt
Financing live
Cash to close
- Down payment
- $37,025
- Closing costs
- $4,443
- Reserves months
- —
- Total cash needed
- —
Loan-product check · same deal, 3 products live
Conventional
25% down · 7.5% · 30yr
- Down + closing
- —
- Monthly P&I
- —
- Monthly cashflow
- —
- DSCR
- —
- Eligible?
- —
Personal DTI + credit; lowest rate.
DSCR
20% down · 8.5% · 30yr
- Down + closing
- —
- Monthly P&I
- —
- Monthly cashflow
- —
- DSCR
- —
- Eligible?
- —
No personal income docs; deal must DSCR.
Hard money
10% down · 12.0% · 12mo
- Down + closing
- —
- Monthly P&I
- —
- Monthly cashflow
- —
- DSCR
- —
- Eligible?
- —
Short-term bridge; refi at stabilization.
Rent comps 40 comps
| Address | Beds | Baths | Sqft | Rent | $/sqft | DOM | Units | Dist |
|---|---|---|---|---|---|---|---|---|
| 4505 Cape Henry Ave Norfolk, VA | 2.0 | 1.0 | 720 | $1,000 | $1.39 | 43d | 1 | 0.23mi |
| 1531 Spruce St Unit B Norfolk, VA | 3.0 | 2.0 | 1304 | $1,600 | $1.23 | 43d | 1 | 0.30mi |
| 1531 Spruce St Unit B Norfolk, VA | 3.0 | 2.0 | 1304 | $1,600 | $1.23 | 23d | 1 | 0.30mi |
| 2412 Azalea Garden Rd Unit 105 Norfolk, VA | 2.0 | 1.0 | 950 | $1,325 | $1.39 | 23d | 1 | 0.36mi |
| 2412 Azalea Garden Rd Apt 210 Norfolk, VA | 2.0 | 1.0 | 950 | $1,325 | $1.39 | 43d | 1 | 0.36mi |
| 4670 Kincaid Ave Apt E Norfolk, VA | 2.0 | 1.0 | 800 | $1,250 | $1.56 | 3d | 1 | 0.37mi |
| 4745 Lind St Unit B Norfolk, VA | 2.0 | 1.0 | 752 | $1,350 | $1.80 | 2d | 1 | 0.41mi |
| 4745 Lind St Unit A Norfolk, VA | 2.0 | 1.0 | 1000 | $1,600 | $1.60 | 43d | 1 | 0.41mi |
| 1562 Norcova Ave Norfolk, VA | 3.0 | 1.0 | 1288 | $2,000 | $1.55 | 17d | 1 | 0.47mi |
| 3477 E Bonner Dr Norfolk, VA | 3.0 | 1.0 | 1304 | $2,000 | $1.53 | 23d | 1 | 0.52mi |
| 3507 Cape Henry Ave Unit A Norfolk, VA | 2.0 | 1.0 | 755 | $1,200 | $1.59 | 21d | 1 | 0.55mi |
| 2640 Azalea Garden Rd Norfolk, VA | 3.0 | 1.5 | 1100 | $2,150 | $1.95 | 4d | 1 | 0.56mi |
| 1525 Nevada Ave Unit B Norfolk, VA | 2.0 | 1.5 | 1134 | $1,445 | $1.27 | 43d | 1 | 0.57mi |
| 3044 Sewells Point Rd Norfolk, VA | 2.0 | 1.0 | 830 | $1,134 | $1.37 | 1d | 1 | 0.57mi |
| 1445 Norcova Ave Apt E Norfolk, VA | 2.0 | 1.0 | 750 | $1,125 | $1.50 | 43d | 1 | 0.59mi |
| 2421 Arkansas Ave Unit A Norfolk, VA | 2.0 | 1.0 | 870 | $1,225 | $1.41 | 14d | 1 | 0.60mi |
| 3640 Robin Hood Rd Norfolk, VA | 4.0 | 2.5 | 1400 | $2,999 | $2.14 | 17d | 1 | 0.74mi |
| 3400 Lafayette Blvd #2 Norfolk, VA | 2.0 | 1.0 | 800 | $1,350 | $1.69 | 3d | 1 | 0.76mi |
| 1371 E Norcova Dr Norfolk, VA | 2.0 | 1.0 | 967 | $1,750 | $1.81 | 7d | 1 | 0.77mi |
| 1323 W Norcova Dr Norfolk, VA | 3.0 | 1.0 | 1410 | $2,500 | $1.77 | 43d | 1 | 0.81mi |
| 2721 Grandy Ave Norfolk, VA | 2.0 | 1.0 | 900 | $1,150 | $1.28 | 23d | 1 | 0.82mi |
| 3305 Herbert St Norfolk, VA | 2.0 | 1.0 | 1215 | $1,750 | $1.44 | 12d | 1 | 0.89mi |
| 2400 Ballentine Blvd Unit A Norfolk, VA | 2.0 | 1.0 | 879 | $1,550 | $1.76 | 43d | 1 | 0.92mi |
| 2815 Keller Ave Norfolk, VA | 3.0 | 2.0 | 1210 | $2,250 | $1.86 | 4d | 1 | 0.98mi |
| 4566 Hampshire Ave Unit A Norfolk, VA | 2.0 | 1.0 | 870 | $1,350 | $1.55 | 43d | 1 | 0.98mi |
| 4802 Norvella Ave Unit 1 Norfolk, VA | 2.0 | 1.0 | 800 | $1,050 | $1.31 | 7d | 1 | 1.03mi |
| 2949 Verdun Ave Norfolk, VA | 3.0 | 2.0 | 950 | $3,000 | $3.16 | 43d | 1 | 1.11mi |
| 2900 Verdun Ave Norfolk, VA | 3.0 | 1.0 | 867 | $1,800 | $2.08 | 43d | 1 | 1.12mi |
| 3801 Chatham Cir Unit 2 Norfolk, VA | 2.0 | 1.0 | 1100 | $1,350 | $1.23 | 7d | 1 | 1.23mi |
| 3820 Essex Cir Unit A Norfolk, VA | 2.0 | 1.0 | 1000 | $2,200 | $2.20 | 21d | 1 | 1.24mi |
| 3820 Essex Cir Unit B 1 Norfolk, VA | 2.0 | 1.0 | 900 | $1,700 | $1.89 | 21d | 1 | 1.24mi |
| 3820 Essex Cir #1 Norfolk, VA | 2.0 | 1.0 | 1000 | $2,250 | $2.25 | 17d | 1 | 1.24mi |
| 3819 Pamlico Cir Norfolk, VA | 3.0 | 1.0 | 1250 | $2,000 | $1.60 | 12d | 1 | 1.24mi |
| 2405 Lafayette Blvd Unit A Norfolk, VA | 3.0 | 2.0 | 1000 | $2,200 | $2.20 | 14d | 1 | 1.27mi |
| 2660 Chesapeake Blvd Norfolk, VA | 3.0 | 2.0 | 1375 | $2,100 | $1.53 | 17d | 1 | 1.27mi |
| 3521 Brest Ave Norfolk, VA | 3.0 | 2.0 | 1234 | $2,300 | $1.86 | 43d | 1 | 1.28mi |
| 1232 Norview Ave Unit NOR1232R-EA Norfolk, VA | 3.0 | 2.0 | 1106 | $1,600 | $1.45 | 43d | 1 | 1.30mi |
| 3541 Mangrove Ave Unit 8 Norfolk, VA | 2.0 | 1.0 | 900 | $1,350 | $1.50 | 23d | 1 | 1.33mi |
| 2201 Pershing Ave Norfolk, VA | 3.0 | 2.5 | 1455 | $2,250 | $1.55 | 4d | 1 | 1.37mi |
| 2111 Bellevue Ave Unit 1 Norfolk, VA | 2.0 | 1.0 | 950 | $1,300 | $1.37 | 43d | 1 | 1.40mi |
Listing history 4 events
-
2026-05-05status Pending 517-char remark
Show marketing remark (517 chars)
Opportunity awaits in this three bedroom, one bath home. Some work/refreshing is required to make this home move in ready but could be worth the effort. Whether you decide to customize this home for yourself or rent it out, this house could be a great option. RESERVE AUCTION PROPERTY- Property sold “AS-IS” without contingencies, repairs, warranties, guarantees or representation as to listing accuracy, property information, photo or other depiction included or described herein. Inspect before bidding.
-
2026-04-01price $148,100 517-char remark
Show marketing remark (517 chars)
Opportunity awaits in this three bedroom, one bath home. Some work/refreshing is required to make this home move in ready but could be worth the effort. Whether you decide to customize this home for yourself or rent it out, this house could be a great option. RESERVE AUCTION PROPERTY- Property sold “AS-IS” without contingencies, repairs, warranties, guarantees or representation as to listing accuracy, property information, photo or other depiction included or described herein. Inspect before bidding.
-
2026-02-24$155,820 Active 517-char remark
Show marketing remark (517 chars)
Opportunity awaits in this three bedroom, one bath home. Some work/refreshing is required to make this home move in ready but could be worth the effort. Whether you decide to customize this home for yourself or rent it out, this house could be a great option. RESERVE AUCTION PROPERTY- Property sold “AS-IS” without contingencies, repairs, warranties, guarantees or representation as to listing accuracy, property information, photo or other depiction included or described herein. Inspect before bidding.
-
2006-11-27soldstatus $95,000
ⓘ Source: listings_history table (triggers on properties + properties_extension) + one-shot
backfill from property_details.listing_events for pre-trigger history.
Tax reassessment forecast VA · Resets to sale price
- Current annual tax
- $2,557 · $213/mo
- Projected year-2 tax
- $2,557 · $213/mo
- Expected delta
- $0/yr ($0/mo · 0.0%)
ⓘ Screening estimate from a state-policy table — verify with the county assessor before closing.
Climate risk First Street
- Flood 1/10 Low FEMA zone X (unshaded) · 0% chance over 30 yrs
- Wildfire 1/10 Low
- Heat 9/10 Extreme 7 d/yr ≥105°F today · 16 d/yr by 30 yrs out
- Wind 8/10 Severe 80% chance of damaging wind over 30 yrs
- Air quality 3/10 Moderate 2 unhealthy d/yr today · 3 by 30 yrs out
Nearby sold comps map
Loading sold comps map…
Walkable amenities ~0.75 mi
Loading nearby amenities…
Taxation est. · year 1
- Rental income
- $20,264
- − Mortgage interest
- −$8,296
- − Property taxes
- −$2,557
- − Insurance
- −$740
- − Repairs & maintenance
- −$1,621
- − Management
- −$1,621
- − Depreciation
- −$4,308
- Taxable income
- $1,120
- Est. tax owed @ 24.0%
- −$269
- After-tax cash flow
- $3,122/yr
For passive investors: Depreciation is non-cash, so a rental often shows a tax loss while cash-flowing — sheltering income. Rental losses are passive: they offset passive income freely, and up to $25,000/yr can offset ordinary (W-2) income if you actively participate and your MAGI is under $100k (phasing out to $0 by $150k); unused losses carry forward. On sale, claimed depreciation is recaptured at up to 25%, and gains may owe capital-gains tax (a 1031 exchange can defer both). Figures are a year-1 estimate at your 24.0% rate — not tax advice; consult a CPA.
Schools (NCES district)
- District
- Norfolk City Public School District
- NCES district ID
- 5102670
- Math proficiency
- 27% ▼ -44.00%
- Reading proficiency
- 56% ▼ -10.00%
- Median HH income
- $44,358
- Composite
- 35.08/100
- National rank
- #5026
- State rank
- #118 of 131 in VA
Livability — Norfolk
- Score
- 83/100
- State rank
- #43
- US rank
- #1026
Category grades
Schools grade is shown separately in the Schools card above.
Census & demographics
- Census place
- Norfolk, VA
- County
- Norfolk City · 214,042 people
- City population
- 214,042
- Metro
- Virginia Beach-Norfolk-Newport News, VA-NC
- Population (ZIP)
- 28,628
- Household income
- $68,380
- Rent vs Own
- Severe rent burden
- 1342.0
Population outlook (Norfolk County) Hauer SSP2
- Today (2025)
- 249,032 people
- By 2030
- 252,347 · +1.3%
- By 2040
- 253,644 · +1.9%
- By 2050
- 251,913 · +1.2%
- By 2075
- 245,281 · -1.5%
- By 2100
- 219,548 · -11.8%
Race, ethnicity, and origin ACS 2023
- Neighborhood character
- Diverse neighborhood (Simpson 0.63)
- Race & ethnicity
- Black 55% White 23% Hispanic / Latino 11% Two or more races 7% Asian 5%
- Hispanic origin (detail)
- Mexican 4% Puerto Rican 3%
- Common ancestry
- Romanian 1% Slovak 1% Lithuanian 0%
- Foreign-born
- 10% · Canada
- Languages at home
- 87% English-only · Spanish 6% Tagalog/Filipino 4% French/Haitian/Cajun 1%
Political lean MEDSL · Norfolk
- 2024 margin
- Solid D (+41.5) · D 70.0% · R 28.5% · Other 1.6%
- 2008→2024 swing
- -1.4pp toward R · 2008: 43.0pp · 2024: 41.5pp
- All cycles
- 2024: D+41.5 2020: D+45.6 2016: D+42.0 2012: D+44.0 2008: D+43.0
Not yet ingested
- Civics
- —
Market trends
- HPI YoY
- ▼ -33.67%
- Current HPI
- 329.2241
- Rent YoY
- ▲ 3.42%
- Metro
- Virginia Beach-Norfolk-Newport News, VA-NC
- State GDP YoY
- ▲ 2.40%
- F500 in state
- 50
Industry mix (Fortune 500 HQ in VA)
| Industry | F500 HQs | Revenue |
|---|---|---|
| Aerospace / Defense | 4 | $236B |
|
||
| Technology / Defense | 3 | $32B |
|
||
| Financial Services | 2 | $176B |
|
||
| Utilities | 2 | $27B |
|
||
| Insurance | 2 | $25B |
|
||
| Technology | 2 | $15B |
|
||
Price history
+55.9% since first listed4 events — show timeline
- 2026-05-05 Pending — BRIGHT MLS
- 2026-04-01 Price Changed $148,100 BRIGHT MLS
- 2026-02-24 Listed $155,820 BRIGHT MLS
- 2006-11-27 Sold (Public Records) $95,000 Public Records
Property tax history
+4.3%/yrLatest (2025): $2,557 · +7.8% YoY. Source: county tax records.
Cash-flow waterfall
monthlySold comps — $/sqft
last 12 mo · ≤1 miLoading sold comps…