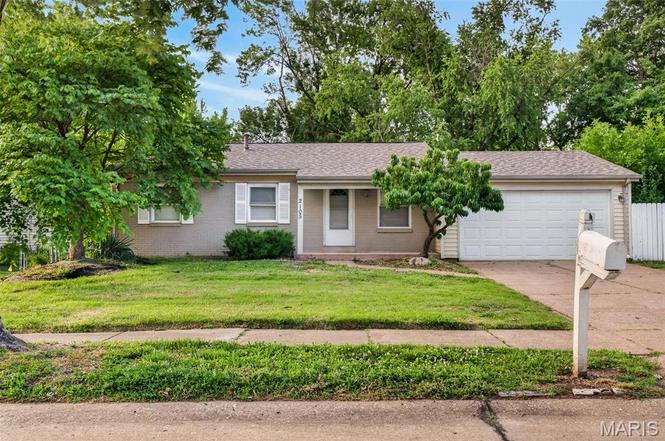
2105 Avon Dr · Florissant, MO
Flood risk 1/10 · Minimal
- FEMA flood zone
- X (unshaded)
- Chance of flooding over 30 yrs
- 0.0%
- Est. flood insurance / yr
- $473 – $860
Fire risk 1/10 · Minimal
- Est. fire insurance / yr
- $1,054 – $1,958
Heat risk 5/10 · Moderate
- Hot days now (above 105°F)
- 7 days/yr
- Hot days in 30 yrs
- 21 days/yr
Wind risk 2/10 · Minimal
- Chance of severe wind over 30 yrs
- 1.0%
Air-quality risk 3/10 · Minor
- Unhealthy air days now
- 3 days/yr
- Unhealthy air days in 30 yrs
- 5 days/yr
Risk factors via First Street. Map © Google.
Why this score? — see what drove the C+ grade
The composite is a weighted blend of 9 inputs, each scored 0–100. Each bar is that input's sub-score; the figure is the points it added to the 100-point composite (weight × sub-score).
- Cash flow +19.2/30.0
- Appreciation +10.0/10.0
- ARV discount +9.3/15.0
- DSCR +6.1/10.0
- 1% rule +4.7/10.0
- Rent growth +4.4/5.0
- Livability +3.7/5.0
- Condition / age +2.5/5.0
- Schools +1.2/10.0
$161,900
🖨 Deal sheet 📄 Offer letter ✓ Due diligence
Listing remarks MLS
Great Investment Opportunity in "As Is" Condition. Current tenant is responsible and reliable with monthly rent payments. This nice home offers 3 bedrooms, 1 full bath, dining room which could also be used as a family room, kitchen, 2 Car Garage and a full walk out basement. The large fenced backyard has a great deck perfect for relaxing or entertaining connecting to the above ground pool which is being offered in “As Is” condition. Some improvements are, a new back entry door to the garage, a new mailbox, repaired panels on the wood fencing, added mulch in the front yard and the outside of the home has been recently power washed. You will notice that the wood fence, garage door, shutters and mailbox post have all been recently painted giving this home a fresh new look! The owner is offering an HSA Home warranty. Please take a look you won’t be disappointed!!
Key facts
- 9,626 sq ft lot
- 2 garage spots
- Built 1968
Property features AI
Exterior
- Parking: 2-car garage
- Utilities: Public water; Public sewer; Electric service by Ameren; Electricity available
- Home design: Single-family residence; One level
- Construction: Frame construction with vinyl siding
- Exterior features: Back yard; Level lot
Interior
- Bedrooms: 3 bedrooms on the main level
- Bathrooms: 1 full bathroom on the main level
- Heating & cooling: Forced air heating; Central air conditioning; Ceiling fans
- Interior features: Partially finished full basement with 8 ft+ poured concrete; Ceiling fans; Forced air heating; Central air conditioning
Neighborhood map
What this means for you Summary
Snapshot
- This is a 3-bed/1.0-bath single-family listed at $162k.
Deal economics
- At list price, monthly cash flow is $174 ($2k/yr) — positive.
- The deal already cash-flows at list — no discount required.
- To meet the 1% rule (rent ≥ 1% of price), the offer needs to be $157k (2.8% below list).
- Recommended offer: $157k (2.8% below list) — sets the bar for 1% rule.
Location & tenants
- Location reads 73/100 on livability (#82 in MO) — a middle-class / working-renter tenant base. Strengths: cost of living A+, housing A+, health & safety B+; Watch: crime C-, amenities D+, commute F.
- Ferguson-Florissant R-II (suburban): math 7% / reading 20% proficiency, ranked #311 of 324 in MO (top 96%) — low school quality limits family demand, transient renter base, plan for 1-2y turnover; 70% free/reduced lunch — lower-income household profile, screen leases tightly.
- Zoned schools: Mccluer North High (math 5% / reading 28%, grade F, #487 of 521 statewide, top 93%, 1,136 students, 100% FRL) — zoned schools average 100% FRL vs 70% district-wide (30 pts higher); higher-poverty schools than district average — tighter screening recommended.
- Market conditions: Rents rising fast (+7.5%/yr); 218 active listings in the ZIP; 20 comparable units currently listed for rent nearby; rentals at typical pace (median 15d on market — plan ~3-4 weeks tenant-placement turnaround); 920 units permitted in St. Louis County in 2024 (250 in 5+ unit buildings).
Forward outlook
- In year one you build about $17k of equity ($1k loan paydown + $16k appreciation (10.0% local appreciation)).
- At projected returns (10.0% appreciation + 7.5% rent growth), your $45k cash investment doubles in ~3 years — after that, you're playing with house money.
- By year 3, paydown + projected appreciation supports a ~$44k cash-out refi (75% LTV) — recoverable capital for the next deal without selling this one.
Negotiation context
- Only 8 days on market — expect competitive offers; lowballing is unlikely to land.
- 4 sale attempts since 10y ago with the ask held roughly flat each time — persistent listings suggest the price (not the market) is what's stuck; bring a comps-based counter.
- Current owner paid $58k; list at $162k implies a 179% gain — meaningful room to come down on a strong offer.
Risks & watch-outs
- Climate carrying-cost: extreme-heat days projected 7→21/yr by 2055 (HVAC capex compounding) — expect insurance premiums to compound above CPI over the hold.
Questions for the listing agent
- Built in 1968 — when were the roof, HVAC, electrical panel, plumbing, and water heater last replaced?
- Is there a deadline driving the sale (1031 exchange, divorce, estate, relocation)? That informs how much negotiation room exists.
- Schools are D-rated, which usually means shorter tenancies and higher turnover. Who's the typical renter profile here, and what's been the actual vacancy rate?
- What's the average days-on-market for RENTAL listings here right now (not sales)? A rising rental-DOM trend means longer vacancies and softer asking-rent achievability than the comps imply.
- What's the recent tenant-quality profile in this submarket — average credit score on applications, eviction rate, late-payment / NSF rate, and stable-employment percentage? A property-management company in the area should have these aggregated.
- How much new for-sale + rental construction is in the pipeline within 1–3 miles? Heavy new supply typically softens prices + rents 12–24 months out; constrained supply supports both.
Investment metrics
- 1% rule
- 0.97% ✗
- Cap rate
- 7.58%
- Cash-on-cash
- 4.61%
- DSCR
- 1.21
- GRM
- 8.6
CMA / ARV
- ARV (on-the-fly)
- $168,502
- Comps found
- 12
Show comp detail 12 sales within ~0.75 mi
| Address | Dist | Beds/Ba | Sqft | Sold | Price | $/sf | Match |
|---|---|---|---|---|---|---|---|
| 2370 Indiancup Dr | 0.14mi | 3/2.0 | 960 (-1%) | 3mo | $149,900 | $156 | 84 |
| 2345 Hummingbird Dr | 0.31mi | 3/1.0 | 988 (+1%) | 2mo | $175,000 | $177 | 81 |
| 340 Patterson Ln | 0.46mi | 3/1.0 | 988 (+1%) | 2mo | $160,000 | $162 | 75 |
| 1710 Kay Dr | 0.59mi | 3/1.0 | 960 (-1%) | 2mo | $135,000 | $141 | 69 |
| 390 Versailles Dr | 0.46mi | 3/1.5 | 1,040 (+7%) | 0mo | $174,900 | $168 | 65 |
| 2310 Orleans Ln | 0.49mi | 3/2.0 | 1,025 (+5%) | 1mo | $198,900 | $194 | 64 |
| 1770 Beverly Dr | 0.50mi | 3/1.5 | 1,040 (+7%) | 1mo | $200,000 | $192 | 62 |
| 2960 Devonshire Dr | 0.19mi | 3/2.0 | 1,118 (+15%) | 0mo | $120,000 | $107 | 62 |
| 2265 Briarcrest Dr | 0.17mi | 4/2.0 (+1) | 1,092 (+12%) | 3mo | $200,000 | $183 | 61 |
| 460 Wren Dr | 0.65mi | 3/1.0 | 1,025 (+5%) | 2mo | $177,000 | $173 | 59 |
| 2190 Glenoro Dr | 0.20mi | 4/2.5 (+1) | 1,083 (+11%) | 3mo | $225,999 | $209 | 59 |
| 2750 Robert Dr | 0.57mi | 3/1.5 | 1,064 (+9%) | 2mo | $169,000 | $159 | 54 |
Match score weights: distance 35% · size 25% · config 20% · recency 20%. Top-matched comps best support the ARV.
Projected returns pro-forma
10.0% appreciation · 7.51% rent growth · sell at horizon
- IRR
- 29.3%
- Equity multiple
- 3.35×
- Total profit
- $106,736
- Equity at exit
- $145,852
- IRR
- 26.8%
- Equity multiple
- 8.14×
- Total profit
- $323,731
- Equity at exit
- $314,536
Cash invested: $45,332 (down + closing). Projections, not guarantees.
Landlord ↔ Tenant lean methodology
- Overall (STATE)
- 81 Strongly Landlord-Friendly
- State Missouri
- 81 Strongly Landlord-Friendly · R+10
- County
- — inherits STATE
- City
- — inherits STATE
ZIP-level market 63033
- Home prices YoY
- 2.5%
- Rents YoY
- 7.5%
- Active inventory
- 218
- Price-to-rent
- 8.6×
Monthly cashflow live
- Estimated rent
- $1,574 high interval (Pro) →
- Mortgage (P&I)
- −$849
- Tax from tax record
- −$153 /mo · $1,835/yr
- Insurance
- −$67
- HOA
- −$0
- Vacancy / Maint / Mgmt
- −$331
- Net cashflow
- $174
Break-even live
UW: 25.0% down · 7.5% · 30yr · 1.5% tax · 5.0% vac · 8.0% maint · 8.0% mgmt
Financing live
Cash to close
- Down payment
- $40,475
- Closing costs
- $4,857
- Reserves months
- —
- Total cash needed
- —
Loan-product check · same deal, 3 products live
Conventional
25% down · 7.5% · 30yr
- Down + closing
- —
- Monthly P&I
- —
- Monthly cashflow
- —
- DSCR
- —
- Eligible?
- —
Personal DTI + credit; lowest rate.
DSCR
20% down · 8.5% · 30yr
- Down + closing
- —
- Monthly P&I
- —
- Monthly cashflow
- —
- DSCR
- —
- Eligible?
- —
No personal income docs; deal must DSCR.
Hard money
10% down · 12.0% · 12mo
- Down + closing
- —
- Monthly P&I
- —
- Monthly cashflow
- —
- DSCR
- —
- Eligible?
- —
Short-term bridge; refi at stabilization.
Rent comps 20 comps
| Address | Beds | Baths | Sqft | Rent | $/sqft | DOM | Units | Dist |
|---|---|---|---|---|---|---|---|---|
| 1983 Greenheath Dr Florissant, MO | 3.0 | 2.0 | 1040 | $1,331 | $1.28 | 3d | 1 | 0.17mi |
| 330 Moule Dr Florissant, MO | 3.0 | 1.0 | 1014 | $1,575 | $1.55 | 43d | 1 | 0.38mi |
| 1710 Kay Dr Florissant, MO | 3.0 | 1.0 | 960 | $1,500 | $1.56 | 2d | 1 | 0.59mi |
| 775 Sherwood Dr Florissant, MO | 3.0 | 1.0 | 1023 | $1,690 | $1.65 | 43d | 1 | 0.80mi |
| 3144 Sunswept Pk Ct Florissant, MO | 1.0–3.0 | 1.0–2.0 | 818 | $1,250 | $1.53 | 1d | 12 | 0.82mi |
| 840 Dawnview Ct Florissant, MO | 3.0 | 1.5 | 750 | $900 | $1.20 | 23d | 1 | 0.90mi |
| 3209 Cross Keys Dr Florissant, MO | 1.0–2.0 | 1.0 | 700 | $1,100 | $1.57 | 1d | 1 | 0.93mi |
| 9 Saint Celeste Dr Florissant, MO | 3.0 | 1.0 | 992 | $1,450 | $1.46 | 43d | 1 | 0.93mi |
| 2990 Santiago Dr Florissant, MO | 2.0 | 2.0 | 984 | $1,200 | $1.22 | 43d | 1 | 0.93mi |
| 3 Champlain Ct Florissant, MO | 3.0 | 1.0 | 1100 | $1,600 | $1.45 | 43d | 1 | 0.94mi |
| 10 Saint Celeste Dr Florissant, MO | 2.0 | 1.0 | 716 | $1,290 | $1.80 | 12d | 1 | 0.95mi |
| 2942 Chance Dr Florissant, MO | 3.0 | 1.0 | 912 | $1,700 | $1.86 | 12d | 1 | 0.97mi |
| 470 Hundley Dr Florissant, MO | 3.0 | 2.0 | 962 | $1,595 | $1.66 | 43d | 1 | 1.02mi |
| 2857 Dawnview Dr Florissant, MO | 3.0 | 1.0 | 890 | $1,325 | $1.49 | 7d | 1 | 1.12mi |
| 1045 N New Florissant Rd Florissant, MO | 2.0 | 1.0 | 783 | $1,250 | $1.60 | 14d | 1 | 1.17mi |
| 1004 N New Florissant Rd Florissant, MO | 2.0 | 1.0 | 719 | $1,375 | $1.91 | 23d | 1 | 1.20mi |
| 1095 Humes Ln Florissant, MO | 3.0 | 1.5 | 1100 | $1,650 | $1.50 | 4d | 1 | 1.20mi |
| 4 Sharon Ct Florissant, MO | 3.0 | 2.0 | 1108 | $1,800 | $1.62 | 2d | 1 | 1.26mi |
| 855 Daniel Boone Dr Florissant, MO | 3.0 | 1.0 | 964 | $1,400 | $1.45 | 43d | 1 | 1.33mi |
| 765 Babler Dr Florissant, MO | 3.0 | 2.0 | 888 | $1,700 | $1.91 | 7d | 1 | 1.33mi |
Listing history 7 events
-
2026-06-18days on market $161,900 Active 8 DOM
-
2026-06-17days on market $161,900 Active 7 DOM
-
2026-06-16days on market $161,900 Active 6 DOM
-
2026-06-15days on market $161,900 Active 5 DOM
-
2026-06-13days on market $161,900 Active 3 DOM
-
2026-06-13remarks 699-char remark
-
2026-06-13$161,900 Active 2 DOM
ⓘ Source: listings_history table (triggers on properties + properties_extension) + one-shot
backfill from property_details.listing_events for pre-trigger history.
Tax reassessment forecast MO · Resets to sale price
- Current annual tax
- $1,835 · $153/mo
- Projected year-2 tax
- $1,835 · $153/mo
- Expected delta
- $0/yr ($0/mo · 0.0%)
ⓘ Screening estimate from a state-policy table — verify with the county assessor before closing.
Climate risk First Street
- Flood 1/10 Low FEMA zone X (unshaded) · 0% chance over 30 yrs
- Wildfire 1/10 Low
- Heat 5/10 Major 7 d/yr ≥105°F today · 21 d/yr by 30 yrs out
- Wind 2/10 Low 100% chance of damaging wind over 30 yrs
- Air quality 3/10 Moderate 3 unhealthy d/yr today · 5 by 30 yrs out
Nearby sold comps map
Loading sold comps map…
Walkable amenities ~0.75 mi
Loading nearby amenities…
Taxation est. · year 1
- Rental income
- $18,891
- − Mortgage interest
- −$9,069
- − Property taxes
- −$1,835
- − Insurance
- −$810
- − Repairs & maintenance
- −$1,511
- − Management
- −$1,511
- − Depreciation
- −$4,710
- Taxable loss
- −$555
- Est. tax savings @ 24.0%
- +$133
- After-tax cash flow
- $2,224/yr
For passive investors: Depreciation is non-cash, so a rental often shows a tax loss while cash-flowing — sheltering income. Rental losses are passive: they offset passive income freely, and up to $25,000/yr can offset ordinary (W-2) income if you actively participate and your MAGI is under $100k (phasing out to $0 by $150k); unused losses carry forward. On sale, claimed depreciation is recaptured at up to 25%, and gains may owe capital-gains tax (a 1031 exchange can defer both). Figures are a year-1 estimate at your 24.0% rate — not tax advice; consult a CPA.
Schools (NCES district)
- District
- Ferguson-Florissant R-II
- NCES district ID
- 2912010
- Math proficiency
- 7% ▼ -9.00%
- Reading proficiency
- 20% ▼ -6.00%
- Median HH income
- $44,610
- Composite
- 11.96/100
- National rank
- #9666
- State rank
- #311 of 324 in MO
Livability — Florissant
- Score
- 73/100
- State rank
- #82
- US rank
- #5406
Category grades
Schools grade is shown separately in the Schools card above.
Census & demographics
- County
- Saint Louis County · 888,823 people
- City population
- 69,104
- Metro
- St. Louis, MO-IL
- Population (ZIP)
- 43,056
- Household income
- $66,776
- Rent vs Own
- Severe rent burden
- 1429.0
Population outlook (St. Louis County) Hauer SSP2
- Today (2025)
- 1,025,227 people
- By 2030
- 1,028,023 · +0.3%
- By 2040
- 1,020,940 · -0.4%
- By 2050
- 1,007,280 · -1.8%
- By 2075
- 987,277 · -3.7%
- By 2100
- 921,984 · -10.1%
Race, ethnicity, and origin ACS 2023
- Neighborhood character
- Predominantly Black (71%)
- Race & ethnicity
- Black 71% White 23% Two or more races 4% Hispanic / Latino 1%
- Common ancestry
- Romanian 1% Lithuanian 1% Italian 1%
- Foreign-born
- 3% · Canada, Vietnam
- Languages at home
- 95% English-only · Spanish 1% French/Haitian/Cajun 1%
Political lean MEDSL · St. Louis
- 2024 margin
- Strong D (+23.4) · D 60.8% · R 37.4% · Other 1.7%
- 2008→2024 swing
- +3.5pp toward D · 2008: 19.9pp · 2024: 23.4pp
- All cycles
- 2024: D+23.4 2020: D+24.0 2016: D+16.2 2012: D+13.7 2008: D+19.9
Not yet ingested
- Civics
- —
Market trends
- HPI YoY
- ▲ 13.78%
- Current HPI
- 570.6
- Rent YoY
- ▲ 7.51%
- Metro
- St. Louis, MO-IL
- State GDP YoY
- ▲ 1.84%
- F500 in state
- 20
Industry mix (Fortune 500 HQ in MO)
| Industry | F500 HQs | Revenue |
|---|---|---|
| Healthcare | 1 | $163B |
|
||
| Insurance | 1 | $21B |
|
||
| Industrial Technology | 1 | $17B |
|
||
| Retail | 1 | $16B |
|
||
| Industrial Distribution | 1 | $10B |
|
||
| Utilities | 1 | $9B |
|
||
Price history
+252.0% since first listed14 events — show timeline
- 2026-06-10 Listed $161,900 MARIS as Distributed by MLS Grid
- 2024-04-06 Rental Removed $1,525 RENTLY
- 2024-03-06 Listed for Rent $1,525 RENTLY
- 2020-01-29 Sold (Public Records) — Public Records
- 2017-03-16 Sold (Public Records) $58,000 Public Records
- 2017-03-15 Sold (MLS) — MARIS as Distributed by MLS Grid
- 2017-02-23 Pending — MARIS as Distributed by MLS Grid
- 2017-02-13 Contingent — MARIS as Distributed by MLS Grid
- 2017-02-07 Price Changed $59,500 MARIS as Distributed by MLS Grid
- 2017-02-06 Relisted — MARIS as Distributed by MLS Grid
- 2017-01-27 Pending — MARIS as Distributed by MLS Grid
- 2016-12-31 Listed $72,000 MARIS as Distributed by MLS Grid
- 1996-08-15 Sold (Public Records) $68,900 Public Records
- 1983-01-01 Sold (Public Records) $46,000 Public Records
Property tax history
-0.2%/yrLatest (2022): $1,835 · +0.3% YoY. Source: county tax records.
Cash-flow waterfall
monthlySold comps — $/sqft
last 12 mo · ≤1 miLoading sold comps…