 12-Plex
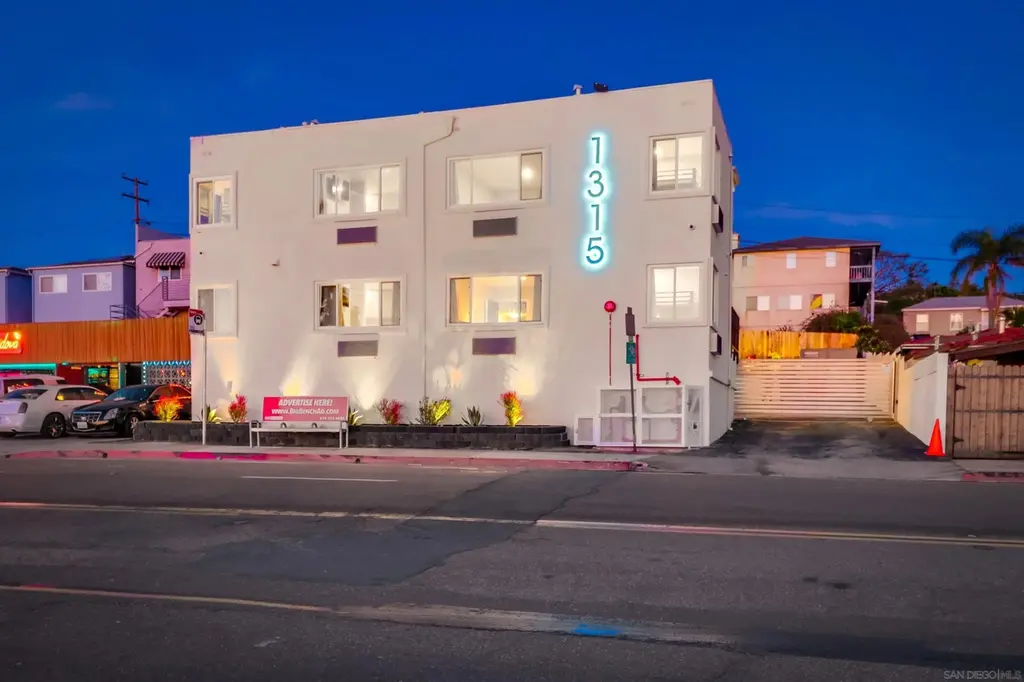
1315 Morena Blvd · San Diego, CA
Flood risk No data
- FEMA flood zone
- —
- Chance of flooding over 30 yrs
- —
- Est. flood insurance / yr
- —
Fire risk No data
- Est. fire insurance / yr
- —
Heat risk No data
- Hot days now (above threshold)
- —
- Hot days in 30 yrs
- —
Wind risk No data
- Chance of severe wind over 30 yrs
- —
Air-quality risk No data
- Unhealthy air days now
- —
- Unhealthy air days in 30 yrs
- —
Risk factors via First Street. Map © Google.
Why this score? — see what drove the C+ grade
The composite is a weighted blend of 9 inputs, each scored 0–100. Each bar is that input's sub-score; the figure is the points it added to the 100-point composite (weight × sub-score).
- Cash flow +26.8/30.0
- DSCR +9.2/10.0
- ARV discount +7.5/15.0
- 1% rule +7.2/10.0
- Condition / age +4.0/5.0
- Livability +3.8/5.0
- Rent growth +2.6/5.0
- Schools +2.2/10.0
- Appreciation +0.0/10.0
$3,390,000
🖨 Deal sheet (PDF) 📄 Offer letter ✓ Due diligence
Multi-family units
County records classify this as Multi-Family (5+ Unit). Listing-text estimate: 12 units. confirmed
5+ unit building — per-unit beds/baths from public records are typically unavailable; the breakdown below (if shown) is an estimate from the listing text.
Listing remarks
Lowest Coastal Price Per Unit! Introducing a fully renovated 12-unit apartment community in the heart of Bay Park, one of San Diego’s most walkable coastal neighborhoods. Located just blocks from Mission Bay and within walking distance to restaurants and bars, the property offers strong tenant appeal and everyday convenience. The unit mix includes 3 studios, 8 one-bedroom/one-bath units, and 1 two-bedroom/two-bath unit, all renovated through a city-permitted down-to-the-studs remodel. Improvements include a new fire sprinkler system, all-new plumbing and electrical, new drywall and insulation, secured gated access, and off-street parking. Each unit features modern interiors, upgraded
Key facts
- Fully renovated
- Secured gated access
- Off-street parking
Tags
Property features AI
Exterior
- Home design: Residential income property (Commercial-Residential Income subtype)
- Construction: About 4,101 square feet (building size)
- Exterior features: Lot approximately 0.15 acres
Interior
- Bathrooms: 13 full bathrooms
- Interior features: UnBranded virtual tour available
Neighborhood map
What this means for you Summary
Snapshot
- This is a 12 × 10-bed/?-bath units multifamily listed at $3.39M. Condition is rated good.
Deal economics
- At list price, monthly cash flow is $9k ($112k/yr) — positive. Per door: $776/mo.
- The deal already cash-flows at list — no discount required.
- Meets the 1% rule at list price ($41k rent vs $3.39M).
- Recommended offer: $3.08M (9.0% below list) — sets the bar for market timing.
- Cap rate 9.6% vs local median 2.0% in San Diego — top-decile yield for the area; either an underpriced asset or a hidden risk that comps aren't pricing in. Stress-test before assuming the spread holds.
Location & tenants
- Location reads 75/100 on livability (#123 in CA, #4,206 nationally) — a middle-class / working-renter tenant base. Strengths: amenities A+, commute A+, employment A+; Watch: health & safety C-, crime D+, cost of living F.
- San Diego Unified (urban): math 19% / reading 29% proficiency, ranked #393 of 517 in CA (top 76%) — low school quality limits family demand, transient renter base, plan for 1-2y turnover.
- Market conditions: Rents flat; 127 active listings in the ZIP; high-income renter base; 11,759 units permitted in San Diego County in 2024 (7,244 in 5+ unit buildings).
- At $41,439/mo this rent would consume 449% of the median local household income ($111k/yr) (locally 1894% of renters already pay >50% of income on rent) — very limited rent-growth headroom before tenants either downsize or default.
Forward outlook
- Local home prices are declining (-3.0%/yr); year-one equity from $23k of loan paydown is wiped out by about $102k of value loss. Plan a longer hold.
- San Diego County population projected at +20% by 2050 — long-run rental-demand tailwind backs the buy-and-hold thesis.
Negotiation context
- It's been on market 91 days — a 9% lower offer ($3.08M) is reasonable based on typical stale-listing flexibility.
- 3 sale attempts since 3y ago with the ask held roughly flat each time — persistent listings suggest the price (not the market) is what's stuck; bring a comps-based counter.
Questions for the listing agent
- It's been on market 91 days. Have you received any prior offers? Is the seller open to a 9% concession, seller financing, or rate buy-down credit?
- Can we see the unit-by-unit rent roll, current vacancy, and any below-market leases? What's the average tenancy length?
- What capital expenditures (roof, boiler, parking lot, exteriors) have been made in the last 5 years, and what's planned in the next 2?
- Why hasn't it sold? Are there any deal-killer items the seller is aware of (foundation, flood, title, zoning, code violations)?
- Is there a deadline driving the sale (1031 exchange, divorce, estate, relocation)? That informs how much negotiation room exists.
- Schools are B-rated — typically a magnet for longer-tenancy family renters. What's the average tenant stay here, and is there a school-zone premium baked into asking?
- Crime grade is D in this area — have there been break-ins, vandalism, or insurance claims at this property in the last 3 years? What carrier currently insures it and at what premium?
- What's the average days-on-market for RENTAL listings here right now (not sales)? A rising rental-DOM trend means longer vacancies and softer asking-rent achievability than the comps imply.
- What's the recent tenant-quality profile in this submarket — average credit score on applications, eviction rate, late-payment / NSF rate, and stable-employment percentage? A property-management company in the area should have these aggregated.
- How much new apartment / multifamily construction is in the pipeline within 1–3 miles? Heavy new supply (>2% of stock underway) typically softens rents 12–24 months out; light construction supports rent growth.
Investment metrics
- 1% rule
- 1.22% ✓
- Cap rate
- 9.59%
- Cash-on-cash
- 11.77%
- DSCR
- 1.52
- GRM
- 6.8
CMA / ARV
No comps found within radius.
Projected returns pro-forma
-3.0% appreciation · 0.36% rent growth · sell at horizon
- IRR
- -1.8%
- Equity multiple
- 0.93×
- Total profit
- $-63,035
- Equity at exit
- $505,460
- IRR
- 4.8%
- Equity multiple
- 1.31×
- Total profit
- $293,693
- Equity at exit
- $293,105
Cash invested: $949,200 (down + closing). Projections, not guarantees.
Landlord ↔ Tenant lean methodology
- Overall (STATE)
- 18 Strongly Tenant-Friendly
- State California
- 18 Strongly Tenant-Friendly · D+13
- County
- — inherits STATE
- City
- — inherits STATE
ZIP-level market 92110
- Rents YoY
- 0.4%
- Active inventory
- 127
- Price-to-rent
- 81.8×
Monthly cashflow live
- Estimated rent
- $41,439 medium interval (Pro) →
- Mortgage (P&I)
- −$17,778
- Tax est. 1.5%
- −$4,238 /mo · $50,850/yr
- Insurance
- −$1,412
- HOA
- −$0
- Vacancy / Maint / Mgmt
- −$8,702
- Net cashflow
- $9,309
Break-even live
Sensitivity live
| Price | -10% $11,652 | -5% $10,481 | +0% $9,309 | +5% $8,138 | +10% $6,967 |
|---|---|---|---|---|---|
| Rent | -10% $6,036 | -5% $7,672 | +0% $9,309 | +5% $10,946 | +10% $12,583 |
| Rate | -1.0pp $11,016 | -0.5pp $10,171 | base $9,309 | +0.5pp $8,431 | +1.0pp $7,537 |
12-unit breakdown (identical units grouped — click to expand)
| Units | Beds | Baths | Est. rent |
|---|---|---|---|
| 12× units | 10 | — | $41,436 |
| #1 | 10 | — | $3,453 |
| #2 | 10 | — | $3,453 |
| #3 | 10 | — | $3,453 |
| #4 | 10 | — | $3,453 |
| #5 | 10 | — | $3,453 |
| #6 | 10 | — | $3,453 |
| #7 | 10 | — | $3,453 |
| #8 | 10 | — | $3,453 |
| #9 | 10 | — | $3,453 |
| #10 | 10 | — | $3,453 |
| #11 | 10 | — | $3,453 |
| #12 | 10 | — | $3,453 |
| Total (12 units) | $41,439 | ||
UW: 25.0% down · 7.5% · 30yr · 1.5% tax · 5.0% vac · 8.0% maint · 8.0% mgmt
Financing live
Cash to close
- Down payment
- $847,500
- Closing costs
- $101,700
- Reserves months
- —
- Total cash needed
- —
Loan-product check · same deal, 3 products live
Conventional
25% down · 7.5% · 30yr
- Down + closing
- —
- Monthly P&I
- —
- Monthly cashflow
- —
- DSCR
- —
- Eligible?
- —
Personal DTI + credit; lowest rate.
DSCR
20% down · 8.5% · 30yr
- Down + closing
- —
- Monthly P&I
- —
- Monthly cashflow
- —
- DSCR
- —
- Eligible?
- —
No personal income docs; deal must DSCR.
Hard money
10% down · 12.0% · 12mo
- Down + closing
- —
- Monthly P&I
- —
- Monthly cashflow
- —
- DSCR
- —
- Eligible?
- —
Short-term bridge; refi at stabilization.
Listing history 23 events
-
2026-06-18days on market $3,390,000 Active 91 DOM
-
2026-06-17days on market $3,390,000 Active 90 DOM
-
2026-06-16days on market $3,390,000 Active 89 DOM
-
2026-06-15days on market $3,390,000 Active 88 DOM
-
2026-06-13days on market $3,390,000 Active 86 DOM
-
2026-06-09days on market $3,390,000 Active 82 DOM
-
2026-06-08days on market $3,390,000 Active 81 DOM
-
2026-06-07days on market $3,390,000 Active 80 DOM
-
2026-06-04days on market $3,390,000 Active 77 DOM
-
2026-06-03days on market $3,390,000 Active 76 DOM
-
2026-06-02days on market $3,390,000 Active 75 DOM
-
2026-06-01days on market $3,390,000 Active 74 DOM
-
2026-05-31days on market $3,390,000 Active 73 DOM
-
2026-04-24historical
-
2026-04-23price $3,394,000
-
2026-04-16price $3,398,000
-
2026-03-19$3,399,000 Active
-
2026-03-17$3,399,000 Active
-
2024-01-13historical $1,799
-
2024-01-07price $1,799
-
2023-12-30price $1,999
-
2023-12-24price $1,899
-
2023-12-15$1,999
ⓘ Source: listings_history table (triggers on properties + properties_extension) + one-shot
backfill from property_details.listing_events for pre-trigger history.
Nearby sold comps map
Loading sold comps map…
Walkable amenities ~0.75 mi
Loading nearby amenities…
Taxation est. · year 1
- Rental income
- $497,268
- − Mortgage interest
- −$189,893
- − Property taxes
- −$50,850
- − Insurance
- −$16,950
- − Repairs & maintenance
- −$39,781
- − Management
- −$39,781
- − Depreciation
- −$98,618
- Taxable income
- $61,394
- Est. tax owed @ 24.0%
- −$14,735
- After-tax cash flow
- $96,977/yr
For passive investors: Depreciation is non-cash, so a rental often shows a tax loss while cash-flowing — sheltering income. Rental losses are passive: they offset passive income freely, and up to $25,000/yr can offset ordinary (W-2) income if you actively participate and your MAGI is under $100k (phasing out to $0 by $150k); unused losses carry forward. On sale, claimed depreciation is recaptured at up to 25%, and gains may owe capital-gains tax (a 1031 exchange can defer both). Figures are a year-1 estimate at your 24.0% rate — not tax advice; consult a CPA.
Condition & rehab AI · 6 photos
This fully renovated 12-unit apartment community in Bay Park is in excellent condition with no visible repairs needed. It offers strong tenant appeal and everyday convenience, making it a great investment opportunity.
Value-add opportunities
- Both Landscaping improvements — Enhances curb appeal and adds value for both resale and rental.
- Both Painting exterior and interior — Fresh paint can improve the home's appearance and increase its value.
- Both Upgrading common areas — Modernizing common areas can attract more tenants and buyers, increasing both resale and rental value.
Renovation cost estimate screening
Value-add ROI direction
- Both Landscaping improvements — Enhances curb appeal and adds value for both resale and rental. ↑
- Both Painting exterior and interior — Fresh paint can improve the home's appearance and increase its value. ↑
- Both Upgrading common areas — Modernizing common areas can attract more tenants and buyers, increasing both resale and rental value. ↑
ⓘ Cost ranges are severity-bucket heuristics (US national rule-of-thumb). Get contractor quotes + a written scope before underwriting a rehab budget.
Schools (NCES district)
- District
- San Diego Unified
- NCES district ID
- 0634320
- Math proficiency
- 19% ▼ -29.00%
- Reading proficiency
- 29% ▼ -28.00%
- Median HH income
- $61,673
- Composite
- 22.31/100
- National rank
- #8135
- State rank
- #393 of 517 in CA
Livability — San Diego
- Score
- 75/100
- State rank
- #123
- US rank
- #4206
Category grades
Schools grade is shown separately in the Schools card above.
Census & demographics
- Census place
- San Diego, CA
- County
- San Diego County · 3,178,799 people
- City population
- 1,397,612
- Metro
- San Diego-Chula Vista-Carlsbad, CA
- Population (ZIP)
- 30,902
- Household income
- $110,790
- Rent vs Own
- Severe rent burden
- 1894.0
Population outlook (San Diego County) Hauer SSP2
- Today (2025)
- 3,678,185 people
- By 2030
- 3,856,546 · +4.8%
- By 2040
- 4,171,407 · +13.4%
- By 2050
- 4,421,607 · +20.2%
- By 2075
- 4,831,599 · +31.4%
- By 2100
- 4,832,502 · +31.4%
Race, ethnicity, and origin ACS 2023
- Neighborhood character
- Diverse neighborhood (Simpson 0.61)
- Race & ethnicity
- White 59% Hispanic / Latino 18% Two or more races 16% Asian 7% Black 5% Native American 1%
- Hispanic origin (detail)
- Mexican 13% Puerto Rican 1%
- Common ancestry
- Italian 3% Romanian 2% Lithuanian 2%
- Foreign-born
- 13% · Canada, China, South Korea
- Languages at home
- 77% English-only · Spanish 10% Other Indo-European 4% Chinese 2%
Political lean MEDSL · San Diego
- 2024 margin
- D (+16.8) · D 56.9% · R 40.1% · Other 2.9%
- 2008→2024 swing
- +6.6pp toward D · 2008: 10.2pp · 2024: 16.8pp
- All cycles
- 2024: D+16.8 2020: D+22.8 2016: D+17.8 2012: D+5.1 2008: D+10.2
Not yet ingested
- Civics
- —
Market trends
- HPI YoY
- ▼ -670.72%
- Current HPI
- 414.3971
- Rent YoY
- ▲ 0.36%
- Metro
- San Diego-Chula Vista-Carlsbad, CA
- State GDP YoY
- ▲ 3.21%
- F500 in state
- 116
Industry mix (Fortune 500 HQ in CA)
| Industry | F500 HQs | Revenue |
|---|---|---|
| Technology | 27 | $1,492B |
|
||
| Financial Services | 3 | $174B |
|
||
| Retail | 3 | $44B |
|
||
| Insurance | 3 | $26B |
|
||
| Media / Entertainment | 2 | $115B |
|
||
| Pharmaceuticals / Biotech | 2 | $62B |
|
||
Price history
+169684.9% since first listed10 events — show timeline
- 2026-04-24 Listing Removed — SDMLS
- 2026-04-23 Price Changed $3,394,000 SDMLS
- 2026-04-16 Price Changed $3,398,000 SDMLS
- 2026-03-19 Listed $3,399,000 SDMLS
- 2026-03-17 Listed $3,399,000 SDMLS
- 2024-01-13 Rental Removed $1,799 APPFOLIO
- 2024-01-07 Price Changed $1,799 APPFOLIO
- 2023-12-30 Price Changed $1,999 APPFOLIO
- 2023-12-24 Price Changed $1,899 APPFOLIO
- 2023-12-15 Listed for Rent $1,999 APPFOLIO
Cash-flow waterfall
monthlySold comps — $/sqft
last 12 mo · ≤1 miLoading sold comps…