 🏗️ New Construction
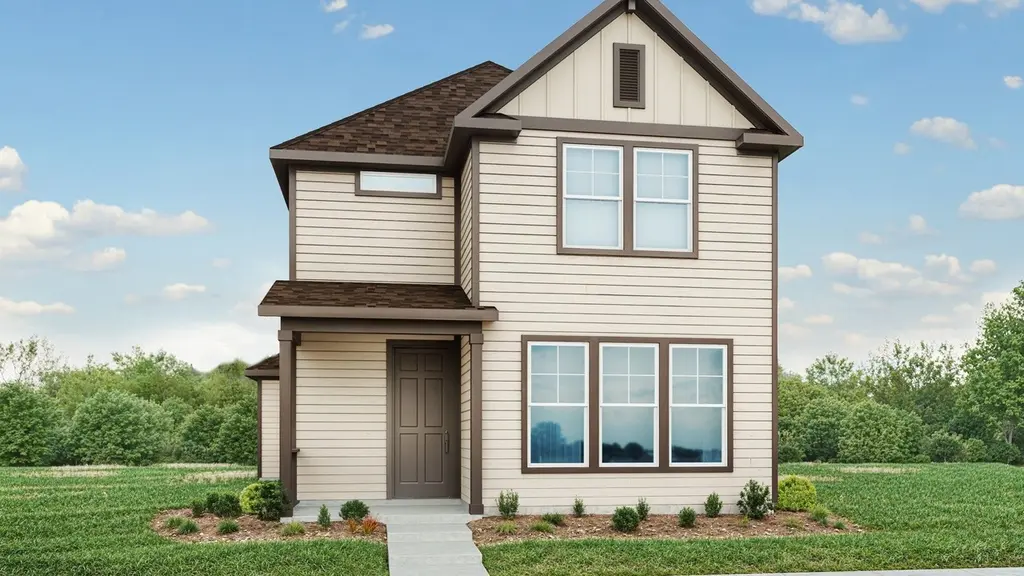
Joyce III Plan · Elgin, TX
Flood risk No data
- FEMA flood zone
- —
- Chance of flooding over 30 yrs
- —
- Est. flood insurance / yr
- —
Fire risk No data
- Est. fire insurance / yr
- —
Heat risk No data
- Hot days now (above threshold)
- —
- Hot days in 30 yrs
- —
Wind risk No data
- Chance of severe wind over 30 yrs
- —
Air-quality risk No data
- Unhealthy air days now
- —
- Unhealthy air days in 30 yrs
- —
Risk factors via First Street. Map © Google.
Why this score? — see what drove the D- grade
The composite is a weighted blend of 9 inputs, each scored 0–100. Each bar is that input's sub-score; the figure is the points it added to the 100-point composite (weight × sub-score).
- Appreciation +10.0/10.0
- ARV discount +7.5/15.0
- Cash flow +6.7/30.0
- Condition / age +4.0/5.0
- Livability +3.7/5.0
- Rent growth +3.3/5.0
- Schools +2.0/10.0
- 1% rule +1.9/10.0
- DSCR +0.9/10.0
$279,990
🖨 Deal sheet 📄 Offer letter ✓ Due diligence
Listing remarks MLS
The Joyce III floorplan offers elegance, versatility, and room to grow. Featuring 3-4 bedrooms and 3-4 bathrooms, this thoughtfully designed home adapts to your lifestyle. Open living spaces create a natural flow for gathering and entertaining, while spacious bedrooms provide comfort and privacy. An optional above-garage suite expands the possibilities with its own kitchen, living area, and bathroom-perfect for multigenerational living, a private guest retreat, or even a home studio. With its blend of style and flexibility, the Joyce III is designed to fit the way you live today and tomorrow.
Key facts
- Open living spaces
- Spacious bedrooms
- Above garage suite
Tags
Neighborhood map
What this means for you Summary
Snapshot
- This is a 3-bed/3.0-bath single-family listed at $280k. Condition is rated good.
Deal economics
- At list price, monthly cash flow is $-522 ($-6k/yr) — negative.
- To cash-flow at today's rent, offer at most $248k (11.3% below list).
- To meet the 1% rule (rent ≥ 1% of price), the offer needs to be $222k (20.6% below list).
- Recommended offer: $222k (20.6% below list) — sets the bar for 1% rule.
Location & tenants
- Location reads 74/100 on livability (#167 in TX, #4,404 nationally) — a middle-class / working-renter tenant base. Strengths: cost of living A+, housing A+, health & safety A+; Watch: schools F, amenities F, commute F.
- Elgin ISD (rural): math 17% / reading 26% proficiency, ranked #741 of 826 in TX (top 90%) — low school quality limits family demand, transient renter base, plan for 1-2y turnover; 67% free/reduced lunch — lower-income household profile, screen leases tightly.
- Market conditions: Rents rising (+3.1%/yr); 807 active listings in the ZIP; 27 comparable units currently listed for rent nearby; rentals at typical pace (median 18d on market — plan ~3-4 weeks tenant-placement turnaround); solid renter incomes; 17,121 units permitted in Travis County in 2024 (11,963 in 5+ unit buildings).
Forward outlook
- In year one you build about $35k of equity ($2k loan paydown + $32k appreciation (10.0% local appreciation)).
- Travis County population projected at +60% by 2050 — long-run rental-demand tailwind backs the buy-and-hold thesis.
- By year 2, paydown + projected appreciation supports a ~$56k cash-out refi (75% LTV) — recoverable capital for the next deal without selling this one.
Negotiation context
- It's been on market 115 days — a 9% lower offer ($255k) is reasonable based on typical stale-listing flexibility.
Questions for the listing agent
- What do current leases actually rent for vs. the listed asking? Can we see a recent rent roll and the last 12 months of T-12 income?
- It's been on market 115 days. Have you received any prior offers? Is the seller open to a 21% concession, seller financing, or rate buy-down credit?
- What does the HOA fee cover, when was the last increase, and are there any pending special assessments or reserve-fund shortfalls?
- Why hasn't it sold? Are there any deal-killer items the seller is aware of (foundation, flood, title, zoning, code violations)?
- Is there a deadline driving the sale (1031 exchange, divorce, estate, relocation)? That informs how much negotiation room exists.
- Schools are F-rated, which usually means shorter tenancies and higher turnover. Who's the typical renter profile here, and what's been the actual vacancy rate?
- The area grade is low — what's the realistic commute time and amenity access for the typical tenant pool here? Any planned neighborhood developments (good or bad) we should know about?
- What's the average days-on-market for RENTAL listings here right now (not sales)? A rising rental-DOM trend means longer vacancies and softer asking-rent achievability than the comps imply.
- What's the recent tenant-quality profile in this submarket — average credit score on applications, eviction rate, late-payment / NSF rate, and stable-employment percentage? A property-management company in the area should have these aggregated.
- How much new for-sale + rental construction is in the pipeline within 1–3 miles? Heavy new supply typically softens prices + rents 12–24 months out; constrained supply supports both.
Investment metrics
- 1% rule
- 0.69% ✗
- Cap rate
- 4.36%
- Cash-on-cash
- -6.91%
- DSCR
- 0.69
- GRM
- 12.1
CMA / ARV
- ARV (median comp)
- $323,885
- List price
- $279,990
- Delta
- -13.55%
- Verdict
- UNDERPRICED
- Comps
- 20 within 1.0 mi
Show comp detail 12 sales within ~0.75 mi
| Address | Dist | Beds/Ba | Sqft | Sold | Price | $/sf | Match |
|---|---|---|---|---|---|---|---|
| 13504 Muny Pkwy | 0.18mi | 3/3.0 | 2,160 (0%) | 1mo | $299,990 | $139 | 91 |
| 13505 Muny Pkwy | 0.16mi | 3/2.0 | 2,140 (-1%) | 8mo | $329,890 | $154 | 80 |
| 13444 Barn Chime St | 0.13mi | 4/2.0 (+1) | 2,257 (+4%) | 3mo | $314,990 | $140 | 75 |
| 13509 Barn Chime St | 0.17mi | 4/2.0 (+1) | 2,086 (-3%) | 3mo | $319,990 | $153 | 75 |
| 13405 Barn Chime St | 0.05mi | 4/2.0 (+1) | 1,977 (-8%) | 6mo | $339,990 | $172 | 70 |
| 18400 Sun Haven Cv | 0.22mi | 4/3.0 (+1) | 2,343 (+8%) | 4mo | $273,900 | $117 | 68 |
| 18354 Basket Flower Bnd | 0.49mi | 3/2.5 | 2,103 (-3%) | 8mo | $298,000 | $142 | 64 |
| 17816 Honey Locust Ln | 0.64mi | 4/3.0 (+1) | 2,146 (-1%) | 2mo | $199,999 | $93 | 62 |
| 13524 Wandering Rhett Dr | 0.63mi | 4/3.0 (+1) | 2,168 (+0%) | 9mo | $359,990 | $166 | 58 |
| 18436 Windtree Ln | 0.36mi | 4/3.0 (+1) | 2,420 (+12%) | 3mo | $282,000 | $117 | 56 |
| 13605 Hamilton Hart Dr | 0.70mi | 4/3.0 (+1) | 2,211 (+2%) | 6mo | $374,990 | $170 | 53 |
| 13601 Hamilton Hart Dr | 0.70mi | 3/2.0 | 1,840 (-15%) | 1mo | $329,890 | $179 | 38 |
Match score weights: distance 35% · size 25% · config 20% · recency 20%. Top-matched comps best support the ARV.
Projected returns pro-forma
10.0% appreciation · 3.12% rent growth · sell at horizon
- IRR
- 19.4%
- Equity multiple
- 2.58×
- Total profit
- $143,471
- Equity at exit
- $291,781
- IRR
- 17.9%
- Equity multiple
- 5.95×
- Total profit
- $449,313
- Equity at exit
- $629,237
Cash invested: $90,688 (down + closing). Projections, not guarantees.
Landlord ↔ Tenant lean methodology
- Overall (STATE)
- 87 Strongly Landlord-Friendly
- State Texas
- 87 Strongly Landlord-Friendly · R+5
- County
- — inherits STATE
- City
- — inherits STATE
ZIP-level market 78621
- Home prices YoY
- 7.6%
- Rents YoY
- 3.1%
- Active inventory
- 807
- Price-to-rent
- 10.5×
Monthly cashflow live
- Estimated rent
- $2,224 high interval (Pro) →
- Mortgage (P&I)
- −$1,698
- Tax est. 1.5%
- −$405 /mo · $4,858/yr
- Insurance
- −$135
- HOA
- −$41
- Vacancy / Maint / Mgmt
- −$467
- Net cashflow
- $-522
Break-even live
UW: 25.0% down · 7.5% · 30yr · 1.5% tax · 5.0% vac · 8.0% maint · 8.0% mgmt
Financing live
Cash to close
- Down payment
- $80,971
- Closing costs
- $9,717
- Reserves months
- —
- Total cash needed
- —
Loan-product check · same deal, 3 products live
Conventional
25% down · 7.5% · 30yr
- Down + closing
- —
- Monthly P&I
- —
- Monthly cashflow
- —
- DSCR
- —
- Eligible?
- —
Personal DTI + credit; lowest rate.
DSCR
20% down · 8.5% · 30yr
- Down + closing
- —
- Monthly P&I
- —
- Monthly cashflow
- —
- DSCR
- —
- Eligible?
- —
No personal income docs; deal must DSCR.
Hard money
10% down · 12.0% · 12mo
- Down + closing
- —
- Monthly P&I
- —
- Monthly cashflow
- —
- DSCR
- —
- Eligible?
- —
Short-term bridge; refi at stabilization.
Rent comps 27 comps
| Address | Beds | Baths | Sqft | Rent | $/sqft | DOM | Units | Dist |
|---|---|---|---|---|---|---|---|---|
| 13501 Sierra Wind Ln Elgin, TX | 4.0 | 2.5 | 2066 | $2,500 | $1.21 | 20d | 1 | 0.09mi |
| 14129 Tordillo Dr Unit NA Elgin, TX | 4.0 | 2.5 | 1874 | $2,595 | $1.38 | 4d | 1 | 0.28mi |
| 14129 Tordillo Dr Elgin, TX | 4.0 | 2.5 | 1874 | $2,675 | $1.43 | 23d | 1 | 0.28mi |
| 13804 Knights Branch Dr Elgin, TX | 3.0 | 2.5 | 1427 | $1,900 | $1.33 | 4d | 1 | 0.43mi |
| 18436 Weatherby Ln Elgin, TX | 4.0 | 2.5 | 2095 | $2,000 | $0.95 | 4d | 1 | 0.44mi |
| 13121 Blackeyed Susan Trl Elgin, TX | 4.0 | 2.0 | 1586 | $1,800 | $1.13 | 17d | 1 | 0.45mi |
| 13725 Knights Branch Dr Elgin, TX | 4.0 | 2.5 | 1800 | $2,100 | $1.17 | 23d | 1 | 0.45mi |
| 13604 Menard Way Elgin, TX | 3.0 | 2.0 | 1474 | $1,875 | $1.27 | 23d | 1 | 0.52mi |
| 13520 Knights Branch Dr Elgin, TX | 3.0 | 2.5 | 1600 | $1,850 | $1.16 | 2d | 1 | 0.55mi |
| 13501 Mussel Run Elgin, TX | 4.0 | 2.0 | 1667 | $1,800 | $1.08 | 16d | 1 | 0.66mi |
| 13124 Maidenhair Trl Elgin, TX | 4.0 | 2.0 | 1448 | $1,775 | $1.23 | 23d | 1 | 0.67mi |
| 13124 Maidenhair Trl Elgin, TX | 4.0 | 2.0 | 1448 | $1,775 | $1.23 | 16d | 1 | 0.67mi |
| 13305 Banquete St Elgin, TX | 4.0 | 2.0 | 1707 | $1,995 | $1.17 | 43d | 1 | 0.68mi |
| 17812 Prairie Verbena Ln Elgin, TX | 3.0 | 2.5 | 2049 | $2,199 | $1.07 | 43d | 1 | 0.78mi |
| 101 Bandara Woods Blvd Elgin, TX | 3.0 | 2.0 | 1499 | $1,769 | $1.18 | 14d | 1 | 1.07mi |
| 102 Blanco Woods Blvd Elgin, TX | 3.0 | 2.5 | 2450 | $1,800 | $0.73 | 43d | 1 | 1.10mi |
| 401 Bandara Woods Blvd Elgin, TX | 3.0 | 2.0 | 1665 | $1,875 | $1.13 | 43d | 1 | 1.18mi |
| 23408 Tiny Moons Way Elgin, TX | 4.0 | 2.5 | 2000 | $1,960 | $0.98 | 20d | 1 | 1.38mi |
| 18505 Quiet Range Dr Elgin, TX | 4.0 | 2.0 | 1794 | $1,950 | $1.09 | 23d | 1 | 1.41mi |
| 18505 Quiet Range Dr Unit 18505 Elgin, TX | 4.0 | 2.0 | 1794 | $1,785 | $0.99 | 4d | 1 | 1.41mi |
| 722 Lavaca Loop Elgin, TX | 4.0 | 2.5 | 2075 | $1,895 | $0.91 | 17d | 1 | 1.41mi |
| 13249 Illumination Rd Unit R2 Elgin, TX | 4.0 | 3.0 | 2000 | $600 | $0.30 | 17d | 1 | 1.43mi |
| 13249 Illumination Rd Unit R3 Elgin, TX | 4.0 | 3.0 | 2000 | $560 | $0.28 | 21d | 1 | 1.43mi |
| 19017 Romano Dr Elgin, TX | 4.0 | 3.0 | 2473 | $2,198 | $0.89 | 4d | 1 | 1.44mi |
| 18525 Quiet Range Dr Elgin, TX | 4.0 | 2.0 | 1794 | $1,725 | $0.96 | 17d | 1 | 1.44mi |
| 18721 Quiet Range Dr Elgin, TX | 3.0–5.0 | 2.0–3.5 | 1773 | $2,085 | $1.18 | 1d | 1 | 1.48mi |
| 13249 Illumination Rd Unit R4 Elgin, TX | 4.0 | 3.0 | 2000 | $589 | $0.29 | 43d | 1 | 1.50mi |
HOA detail
- Monthly dues
- $41 · $492/yr
Listing history 15 events
-
2026-06-18days on market $279,990 Active 115 DOM
-
2026-06-17days on market $279,990 Active 114 DOM
-
2026-06-16days on market $279,990 Active 113 DOM
-
2026-06-15days on market $279,990 Active 112 DOM
-
2026-06-13days on market $279,990 Active 110 DOM
-
2026-06-09days on market $279,990 Active 106 DOM
-
2026-06-08days on market $279,990 Active 105 DOM
-
2026-06-07days on market $279,990 Active 104 DOM
-
2026-06-04days on market $279,990 Active 101 DOM
-
2026-06-03days on market $279,990 Active 100 DOM
-
2026-06-02days on market $279,990 Active 99 DOM
-
2026-06-01days on market $279,990 Active 98 DOM
-
2026-05-31days on market $279,990 Active 97 DOM
-
2026-03-29price $294,990 599-char remark
Show marketing remark (599 chars)
The Joyce III floorplan offers elegance, versatility, and room to grow. Featuring 3-4 bedrooms and 3-4 bathrooms, this thoughtfully designed home adapts to your lifestyle. Open living spaces create a natural flow for gathering and entertaining, while spacious bedrooms provide comfort and privacy. An optional above-garage suite expands the possibilities with its own kitchen, living area, and bathroom-perfect for multigenerational living, a private guest retreat, or even a home studio. With its blend of style and flexibility, the Joyce III is designed to fit the way you live today and tomorrow.
-
2026-02-23$299,990 Active 599-char remark
Show marketing remark (599 chars)
The Joyce III floorplan offers elegance, versatility, and room to grow. Featuring 3-4 bedrooms and 3-4 bathrooms, this thoughtfully designed home adapts to your lifestyle. Open living spaces create a natural flow for gathering and entertaining, while spacious bedrooms provide comfort and privacy. An optional above-garage suite expands the possibilities with its own kitchen, living area, and bathroom-perfect for multigenerational living, a private guest retreat, or even a home studio. With its blend of style and flexibility, the Joyce III is designed to fit the way you live today and tomorrow.
ⓘ Source: listings_history table (triggers on properties + properties_extension) + one-shot
backfill from property_details.listing_events for pre-trigger history.
Nearby sold comps map
Loading sold comps map…
Walkable amenities ~0.75 mi
Loading nearby amenities…
Taxation est. · year 1
- Rental income
- $26,691
- − Mortgage interest
- −$18,143
- − Property taxes
- −$4,858
- − Insurance
- −$1,619
- − Repairs & maintenance
- −$2,135
- − Management
- −$2,135
- − HOA
- −$492
- − Depreciation
- −$9,422
- Taxable loss
- −$12,114
- Est. tax savings @ 24.0%
- +$2,907
- After-tax cash flow
- $-3,358/yr
For passive investors: Depreciation is non-cash, so a rental often shows a tax loss while cash-flowing — sheltering income. Rental losses are passive: they offset passive income freely, and up to $25,000/yr can offset ordinary (W-2) income if you actively participate and your MAGI is under $100k (phasing out to $0 by $150k); unused losses carry forward. On sale, claimed depreciation is recaptured at up to 25%, and gains may owe capital-gains tax (a 1031 exchange can defer both). Figures are a year-1 estimate at your 24.0% rate — not tax advice; consult a CPA.
Condition & rehab AI · 6 photos
The Joyce III is a well-maintained single-family home with good exterior and interior conditions. It offers a good investment opportunity with potential for minor updates to enhance its resale and rental value.
Value-add opportunities
- Both Painting the exterior — Fresh paint can enhance curb appeal and property value.
- Both Landscaping improvements — Enhanced landscaping can improve curb appeal and attract potential buyers.
- Resale Interior updates (paint, minor repairs) — Fresh paint and minor repairs can make the interior more appealing to potential buyers.
Renovation cost estimate screening
Value-add ROI direction
- Both Painting the exterior — Fresh paint can enhance curb appeal and property value. ↑
- Both Landscaping improvements — Enhanced landscaping can improve curb appeal and attract potential buyers. ↑
- Resale Interior updates (paint, minor repairs) — Fresh paint and minor repairs can make the interior more appealing to potential buyers. ↑
ⓘ Cost ranges are severity-bucket heuristics (US national rule-of-thumb). Get contractor quotes + a written scope before underwriting a rehab budget.
Schools (NCES district)
- District
- Elgin ISD
- NCES district ID
- 4818360
- Math proficiency
- 17% ▼ -9.00%
- Reading proficiency
- 26% ▼ -5.00%
- Median HH income
- $55,176
- Composite
- 19.62/100
- National rank
- #8749
- State rank
- #741 of 826 in TX
Livability — Elgin
- Score
- 74/100
- State rank
- #167
- US rank
- #4404
Category grades
Schools grade is shown separately in the Schools card above.
Census & demographics
- Census place
- Elgin, TX
- County
- Bastrop County · 68,601 people
- City population
- 27,860
- Metro
- Austin-Round Rock-Georgetown, TX
- Population (ZIP)
- 30,411
- Household income
- $98,534
- Rent vs Own
- Severe rent burden
- 235.0
Population outlook (Travis County) Hauer SSP2
- Today (2025)
- 1,545,133 people
- By 2030
- 1,729,269 · +11.9%
- By 2040
- 2,097,596 · +35.8%
- By 2050
- 2,463,890 · +59.5%
- By 2075
- 3,249,374 · +110.3%
- By 2100
- 3,801,868 · +146.1%
Race, ethnicity, and origin ACS 2023
- Neighborhood character
- Diverse neighborhood (Simpson 0.64)
- Race & ethnicity
- Hispanic / Latino 46% White 38% Two or more races 19% Black 11% Native American 1%
- Hispanic origin (detail)
- Mexican 38%
- Common ancestry
- Slovak 2% Italian 2% Romanian 1%
- Foreign-born
- 17% · Canada, Vietnam
- Languages at home
- 63% English-only · Spanish 36%
Political lean MEDSL · Travis
- 2024 margin
- Solid D (+39.3) · D 68.8% · R 29.4% · Other 1.8%
- 2008→2024 swing
- +9.9pp toward D · 2008: 29.4pp · 2024: 39.3pp
- All cycles
- 2024: D+39.3 2020: D+45.0 2016: D+38.9 2012: D+23.9 2008: D+29.4
Not yet ingested
- Civics
- —
Market trends
- HPI YoY
- ▲ 29.47%
- Current HPI
- 416.87
- Rent YoY
- ▲ 3.12%
- Metro
- Austin-Round Rock-Georgetown, TX
- State GDP YoY
- ▲ 3.95%
- F500 in state
- 110
Industry mix (Fortune 500 HQ in TX)
| Industry | F500 HQs | Revenue |
|---|---|---|
| Energy | 16 | $1,198B |
|
||
| Technology | 5 | $198B |
|
||
| Engineering / Construction | 4 | $72B |
|
||
| Energy Services | 3 | $60B |
|
||
| Utilities | 3 | $41B |
|
||
| Healthcare | 2 | $330B |
|
||
Price history
-1.7% since first listed2 events — show timeline
- 2026-03-29 Price Changed $294,990 Zillow
- 2026-02-23 Listed $299,990 Zillow
Cash-flow waterfall
monthlySold comps — $/sqft
last 12 mo · ≤1 miLoading sold comps…