213 N Fred Height #18 Dr · Smith River, CA
Flood risk 9/10 · Severe
- FEMA flood zone
- X (unshaded)
- Chance of flooding over 30 yrs
- 0.99%
- Est. flood insurance / yr
- $507 – $1,088
Fire risk 4/10 · Minor
- Est. fire insurance / yr
- $659 – $1,223
Heat risk 3/10 · Minor
- Hot days now (above 76°F)
- 10 days/yr
- Hot days in 30 yrs
- 31 days/yr
Wind risk 1/10 · Minimal
- Chance of severe wind over 30 yrs
- —
Air-quality risk 8/10 · Major
- Unhealthy air days now
- 13 days/yr
- Unhealthy air days in 30 yrs
- 13 days/yr
Risk factors via First Street. Map © Google.
Why this score? — see what drove the B- grade
The composite is a weighted blend of 9 inputs, each scored 0–100. Each bar is that input's sub-score; the figure is the points it added to the 100-point composite (weight × sub-score).
- Cash flow +27.1/30.0
- DSCR +9.4/10.0
- ARV discount +7.5/15.0
- 1% rule +7.3/10.0
- Appreciation +5.2/10.0
- Livability +3.0/5.0
- Schools +2.8/10.0
- Rent growth +2.5/5.0
- Condition / age +2.2/5.0
$82,500
🖨 Deal sheet 📄 Offer letter ✓ Due diligence
Listing remarks MLS
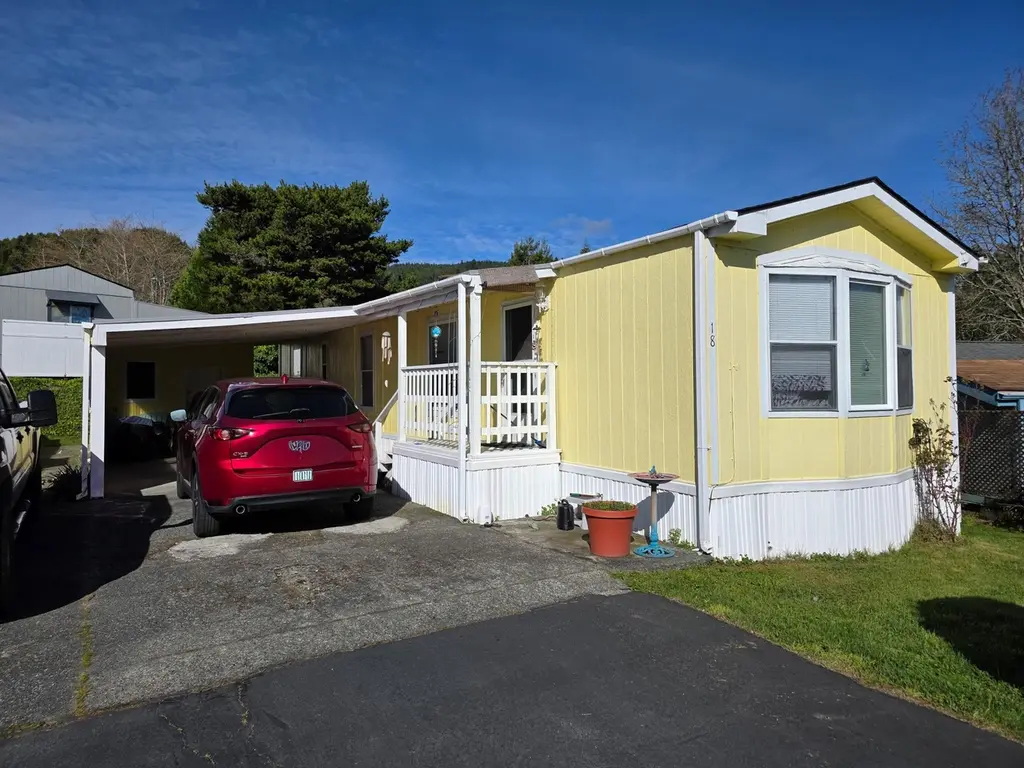
Located in the beautiful Rowdy Creek Mobile Home Park is this sweet singlewide mobile home, just waiting for you! The open floor plan features a sunny kitchen that's open to the living room, 2 bedrooms, and 1 bathroom. Outside, there's a covered carport and a nice enclosed storage room. The roof is only about 3 years old, and there's a monitor heater to keep you warm. The mobile home park itself is an adult park and sits right on Rowdy Creek. It features a spacious patio with picnic tables and views of the creek, where you can watch the salmon and steelhead runs each year. The space rent is only $500.00 a month and includes water, sewer, and trash. This would make a great getaway or full-time living! Close to Lucky 7 casino and gas station and the House of Howonquet Restaurand. Don't miss out, call for your private showing today! For more info on this beautiful mobile home park check out https://www. rowdycreekmobilepark.com/ Interior photos to follow so check back!
Key facts
- Open floor plan
- Covered carport
- Spacious patio
Tags
Neighborhood map
What this means for you Summary
Snapshot
- This is a 2-bed/1.0-bath manufactured listed at $82k. Condition is rated fair.
Deal economics
- At list price, monthly cash flow is $168 ($2k/yr) — positive.
- The deal already cash-flows at list — no discount required.
- Meets the 1% rule at list price ($1k rent vs $82k).
- Recommended offer: $75k (9.0% below list) — sets the bar for market timing.
Location & tenants
- Location reads 59/100 on livability (#640 in CA) — a working-class tenant base; expect higher turnover. Strengths: employment A+, housing A+; Watch: health & safety C-, schools F, crime F.
- Del Norte County Unified (town): math 25% / reading 36% proficiency, ranked #1,047 of 1,400 in CA (top 75%) — families likely to look elsewhere, expect single-tenant / working-renter base with shorter leases.
- Market conditions: 45 active listings in the ZIP; 55 units permitted in Del Norte County in 2024 (22 in 5+ unit buildings).
Forward outlook
- In year one you build about $882 of equity ($570 loan paydown + $312 appreciation (0.4% local appreciation)).
- Del Norte County population projected at -14% by 2050 — secular population decline; favor cash flow + early exit over multi-decade hold.
- At projected returns (0.4% appreciation + 3.0% rent growth), your $23k cash investment doubles in ~7 years — after that, you're playing with house money.
Negotiation context
- It's been on market 100 days — a 9% lower offer ($75k) is reasonable based on typical stale-listing flexibility.
Risks & watch-outs
- Watch-outs: flood insurance adds $66/mo.
- Climate carrying-cost: severe flood risk — expect insurance premiums to compound above CPI over the hold.
Questions for the listing agent
- It's been on market 100 days. Have you received any prior offers? Is the seller open to a 9% concession, seller financing, or rate buy-down credit?
- Have any recent inspections been done? Can we get a copy of the seller's disclosures and any deferred-maintenance estimates?
- What's the actual annual flood-insurance premium (NFIP or private), and is the property in a SFHA with mandatory coverage?
- Why hasn't it sold? Are there any deal-killer items the seller is aware of (foundation, flood, title, zoning, code violations)?
- Is there a deadline driving the sale (1031 exchange, divorce, estate, relocation)? That informs how much negotiation room exists.
- Schools are F-rated, which usually means shorter tenancies and higher turnover. Who's the typical renter profile here, and what's been the actual vacancy rate?
- Crime grade is F in this area — have there been break-ins, vandalism, or insurance claims at this property in the last 3 years? What carrier currently insures it and at what premium?
- What's the average days-on-market for RENTAL listings here right now (not sales)? A rising rental-DOM trend means longer vacancies and softer asking-rent achievability than the comps imply.
- What's the recent tenant-quality profile in this submarket — average credit score on applications, eviction rate, late-payment / NSF rate, and stable-employment percentage? A property-management company in the area should have these aggregated.
- How much new for-sale + rental construction is in the pipeline within 1–3 miles? Heavy new supply typically softens prices + rents 12–24 months out; constrained supply supports both.
Investment metrics
- 1% rule
- 1.23% ✓
- Cap rate
- 9.70%
- Cash-on-cash
- 12.18%
- DSCR
- 1.54
- GRM
- 6.8
CMA / ARV
No comps found within radius.
Projected returns pro-forma
0.38% appreciation · 3.0% rent growth · sell at horizon
- IRR
- 8.7%
- Equity multiple
- 1.42×
- Total profit
- $9,816
- Equity at exit
- $25,527
- IRR
- 13.3%
- Equity multiple
- 2.52×
- Total profit
- $35,067
- Equity at exit
- $31,969
Cash invested: $23,100 (down + closing). Projections, not guarantees.
Landlord ↔ Tenant lean methodology
- Overall (STATE)
- 18 Strongly Tenant-Friendly
- State California
- 18 Strongly Tenant-Friendly · D+13
- County
- — inherits STATE
- City
- — inherits STATE
ZIP-level market 95567
- Home prices YoY
- 0.3%
- Active inventory
- 45
- Price-to-rent
- 6.8×
Monthly cashflow live
- Estimated rent
- $1,018 medium interval (Pro) →
- Mortgage (P&I)
- −$433
- Tax est. 1.5%
- −$103 /mo · $1,238/yr
- Insurance
- −$34
- Flood insurance flood zone
- −$66 /mo · $798/yr
- HOA
- −$0
- Vacancy / Maint / Mgmt
- −$214
- Net cashflow
- $168
Break-even live
UW: 25.0% down · 7.5% · 30yr · 1.5% tax · 5.0% vac · 8.0% maint · 8.0% mgmt
Financing live
Cash to close
- Down payment
- $20,625
- Closing costs
- $2,475
- Reserves months
- —
- Total cash needed
- —
Loan-product check · same deal, 3 products live
Conventional
25% down · 7.5% · 30yr
- Down + closing
- —
- Monthly P&I
- —
- Monthly cashflow
- —
- DSCR
- —
- Eligible?
- —
Personal DTI + credit; lowest rate.
DSCR
20% down · 8.5% · 30yr
- Down + closing
- —
- Monthly P&I
- —
- Monthly cashflow
- —
- DSCR
- —
- Eligible?
- —
No personal income docs; deal must DSCR.
Hard money
10% down · 12.0% · 12mo
- Down + closing
- —
- Monthly P&I
- —
- Monthly cashflow
- —
- DSCR
- —
- Eligible?
- —
Short-term bridge; refi at stabilization.
Listing history 17 events
-
2026-06-19days on market $82,500 Active 100 DOM
-
2026-06-18days on market $82,500 Active 99 DOM
-
2026-06-17days on market $82,500 Active 98 DOM
-
2026-06-16days on market $82,500 Active 97 DOM
-
2026-06-15days on market $82,500 Active 96 DOM
-
2026-06-14days on market $82,500 Active 94 DOM
-
2026-06-12days on market $82,500 Active 93 DOM
-
2026-06-09days on market $82,500 Active 90 DOM
-
2026-06-08days on market $82,500 Active 89 DOM
-
2026-06-07days on market $82,500 Active 88 DOM
-
2026-06-07days on market $82,500 Active 87 DOM
-
2026-06-04days on market $82,500 Active 84 DOM
-
2026-06-02days on market $82,500 Active 83 DOM
-
2026-06-01days on market $82,500 Active 82 DOM
-
2026-05-31days on market $82,500 Active 81 DOM
-
2026-05-31days on market $82,500 Active 80 DOM
-
2026-03-11$82,500 Active 982-char remark
Show marketing remark (982 chars)
Located in the beautiful Rowdy Creek Mobile Home Park is this sweet singlewide mobile home, just waiting for you! The open floor plan features a sunny kitchen that's open to the living room, 2 bedrooms, and 1 bathroom. Outside, there's a covered carport and a nice enclosed storage room. The roof is only about 3 years old, and there's a monitor heater to keep you warm. The mobile home park itself is an adult park and sits right on Rowdy Creek. It features a spacious patio with picnic tables and views of the creek, where you can watch the salmon and steelhead runs each year. The space rent is only $500.00 a month and includes water, sewer, and trash. This would make a great getaway or full-time living! Close to Lucky 7 casino and gas station and the House of Howonquet Restaurand. Don't miss out, call for your private showing today! For more info on this beautiful mobile home park check out https://www. rowdycreekmobilepark.com/ Interior photos to follow so check back!
ⓘ Source: listings_history table (triggers on properties + properties_extension) + one-shot
backfill from property_details.listing_events for pre-trigger history.
Climate risk First Street
- Flood 9/10 Extreme FEMA zone X (unshaded) · 99% chance over 30 yrs
- Wildfire 4/10 Moderate
- Heat 3/10 Moderate 10 d/yr ≥76°F today · 31 d/yr by 30 yrs out
- Wind 1/10 Low
- Air quality 8/10 Severe 13 unhealthy d/yr today · 13 by 30 yrs out
Nearby sold comps map
Loading sold comps map…
Walkable amenities ~0.75 mi
Loading nearby amenities…
Taxation est. · year 1
- Rental income
- $12,221
- − Mortgage interest
- −$4,621
- − Property taxes
- −$1,238
- − Insurance
- −$1,210
- − Repairs & maintenance
- −$978
- − Management
- −$978
- − Depreciation
- −$2,400
- Taxable income
- $797
- Est. tax owed @ 24.0%
- −$191
- After-tax cash flow
- $1,824/yr
For passive investors: Depreciation is non-cash, so a rental often shows a tax loss while cash-flowing — sheltering income. Rental losses are passive: they offset passive income freely, and up to $25,000/yr can offset ordinary (W-2) income if you actively participate and your MAGI is under $100k (phasing out to $0 by $150k); unused losses carry forward. On sale, claimed depreciation is recaptured at up to 25%, and gains may owe capital-gains tax (a 1031 exchange can defer both). Figures are a year-1 estimate at your 24.0% rate — not tax advice; consult a CPA.
Condition & rehab AI · 13 photos
This mobile home is in fair condition with some repairs and maintenance needed, including painting the exterior siding and roof, and trimming the landscaping. The home has a good location in a mobile home park with a nice view of Rowdy Creek, which could be a selling point for potential buyers or renters.
Repairs flagged
- Major roof — The roof appears to be in poor condition, with visible wear and tear.
- Minor exterior siding — The exterior siding appears to have some discoloration and wear, which may be due to age and exposure to the elements.
- Minor exterior fencing — The exterior fencing appears to have some wear and tear, which may be due to age and exposure to the elements.
- Minor landscaping — The landscaping appears to have some overgrown areas, which may need trimming and maintenance.
Value-add opportunities
- Resale painting the exterior siding and roof — Painting the exterior siding and roof can improve the home's curb appeal and make it more attractive to potential buyers.
- Rental trimming and maintaining the landscaping — Maintaining the landscaping can improve the home's curb appeal and make it more attractive to potential renters.
Renovation cost estimate screening
| Repair item | Severity | Est. cost |
|---|---|---|
| roof · The roof appears to be in poor condition, with visible wear and tear. | Major | $15,000–50,000 |
| exterior siding · The exterior siding appears to have some discoloration and wear, which may be due to age and exposure to the elements. | Minor | $500–3,000 |
| exterior fencing · The exterior fencing appears to have some wear and tear, which may be due to age and exposure to the elements. | Minor | $500–3,000 |
| landscaping · The landscaping appears to have some overgrown areas, which may need trimming and maintenance. | Minor | $500–3,000 |
| Total estimated repair cost · 4 items | $16,500–59,000 |
Value-add ROI direction
- Resale painting the exterior siding and roof — Painting the exterior siding and roof can improve the home's curb appeal and make it more attractive to potential buyers. ↑
- Rental trimming and maintaining the landscaping — Maintaining the landscaping can improve the home's curb appeal and make it more attractive to potential renters. ↑
ⓘ Cost ranges are severity-bucket heuristics (US national rule-of-thumb). Get contractor quotes + a written scope before underwriting a rehab budget.
Schools (NCES district)
- District
- Del Norte County Unified
- NCES district ID
- 0610770
- Math proficiency
- 25% ▲ 1.00%
- Reading proficiency
- 36% ▲ 1.00%
- Median HH income
- $39,747
- Composite
- 28.43/100
- National rank
- #12110
- State rank
- #1047 of 1400 in CA
Livability — Smith River
- Score
- 59/100
- State rank
- #640
- US rank
- #20107
Category grades
Schools grade is shown separately in the Schools card above.
Census & demographics
- Census place
- Smith River, CA
- Population (ZIP)
- 2,349
Population outlook (Del Norte County) Hauer SSP2
- Today (2025)
- 25,011 people
- By 2030
- 24,204 · -3.2%
- By 2040
- 22,826 · -8.7%
- By 2050
- 21,495 · -14.1%
- By 2075
- 18,487 · -26.1%
- By 2100
- 16,113 · -35.6%
Race, ethnicity, and origin ACS 2023
- Neighborhood character
- Diverse neighborhood (Simpson 0.62)
- Race & ethnicity
- White 58% Hispanic / Latino 21% Native American 18% Two or more races 3%
- Hispanic origin (detail)
- Mexican 20% Puerto Rican 1%
- Common ancestry
- Slovak 8% Portuguese 6% Lithuanian 3%
- Foreign-born
- 12% · Canada, South Korea
- Languages at home
- 82% English-only · Spanish 15% Korean 1%
Political lean MEDSL · Del Norte
- 2024 margin
- R (+16.4) · D 40.4% · R 56.8% · Other 2.8%
- 2008→2024 swing
- -9.7pp toward R · 2008: -6.8pp · 2024: -16.4pp
- All cycles
- 2024: R+16.4 2020: R+15.6 2016: R+17.6 2012: R+10.8 2008: R+6.8
Not yet ingested
- Civics
- —
Market trends
- HPI YoY
- ▲ 0.38%
- Current HPI
- 142.8439
- Rent YoY
- —
- Metro
- —
- State GDP YoY
- ▲ 3.21%
- F500 in state
- 116
Industry mix (Fortune 500 HQ in CA)
| Industry | F500 HQs | Revenue |
|---|---|---|
| Technology | 27 | $1,492B |
|
||
| Financial Services | 3 | $174B |
|
||
| Retail | 3 | $44B |
|
||
| Insurance | 3 | $26B |
|
||
| Media / Entertainment | 2 | $115B |
|
||
| Pharmaceuticals / Biotech | 2 | $62B |
|
||
Price history
1 event — show timeline
- 2026-03-11 Listed $82,500 DNAORMLS
Cash-flow waterfall
monthlySold comps — $/sqft
last 12 mo · ≤1 miLoading sold comps…