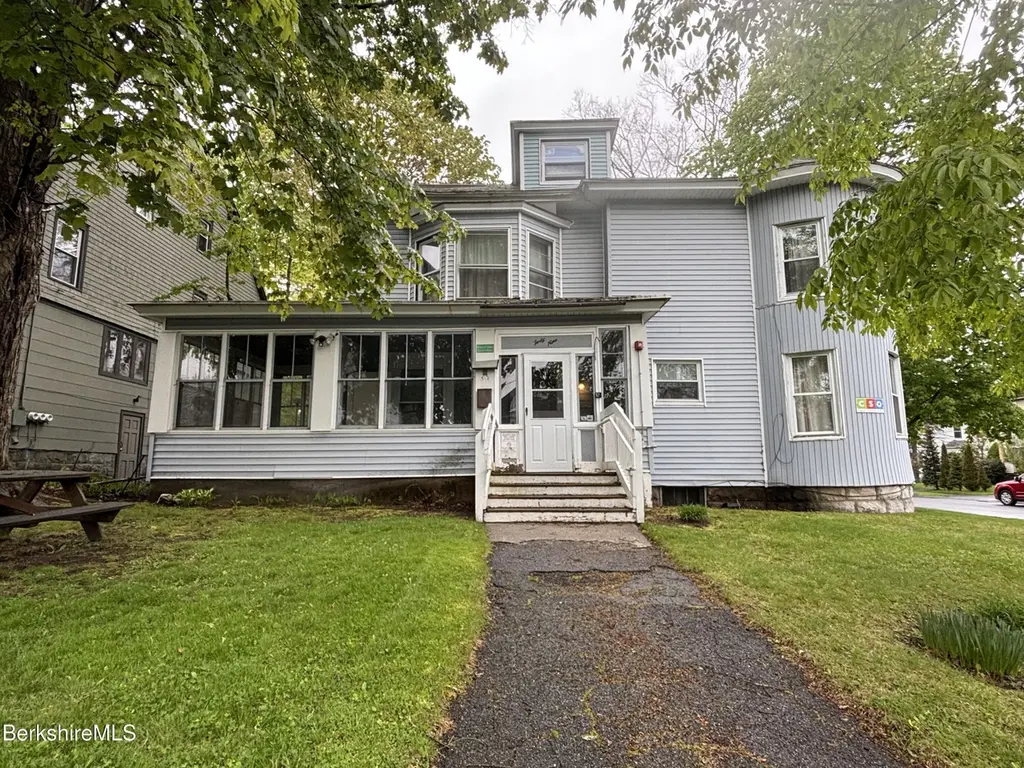
49 Brenton Ter · Pittsfield, MA
Flood risk 1/10 · Minimal
- FEMA flood zone
- X
- Chance of flooding over 30 yrs
- 0.0%
- Est. flood insurance / yr
- $473 – $860
Fire risk 1/10 · Minimal
- Est. fire insurance / yr
- $915 – $1,699
Heat risk 3/10 · Minor
- Hot days now (above 92°F)
- 7 days/yr
- Hot days in 30 yrs
- 17 days/yr
Wind risk 4/10 · Minor
- Chance of severe wind over 30 yrs
- 10.0%
Air-quality risk 2/10 · Minimal
- Unhealthy air days now
- 1 days/yr
- Unhealthy air days in 30 yrs
- 1 days/yr
Risk factors via First Street. Map © Google.
Why this score? — see what drove the C grade
The composite is a weighted blend of 9 inputs, each scored 0–100. Each bar is that input's sub-score; the figure is the points it added to the 100-point composite (weight × sub-score).
- Cash flow +18.9/30.0
- ARV discount +15.0/15.0
- DSCR +5.9/10.0
- 1% rule +5.0/10.0
- Rent growth +4.4/5.0
- Livability +3.8/5.0
- Schools +2.3/10.0
- Condition / age +2.2/5.0
- Appreciation +0.0/10.0
$239,000
🖨 Deal sheet (PDF) 📄 Offer letter ✓ Due diligence
Listing remarks
This 4-bedroom home is located in a highly desirable neighborhood and sits on a corner lot, offering added space, privacy, and curb appeal. The property features a 2-car garage, 1.5 bathrooms, and a functional layout with wood floors throughout much of the home. A cozy fireplace anchors the main living area, while a built-in smoke and carbon monoxide monitoring system provides added safety. The home does need cosmetic repairs, making it an excellent opportunity for buyers or investors to update and customize while building equity in a sought-after location. Possible conversion to multi-family as well.
Key facts
- Added space
- Privacy
- Curb appeal
Tags
Property features AI
Finance
- Financial info: Tax assessed value provided (excluded financial amounts per instructions)
Exterior
- Parking: Off-street parking; 2-car garage
- Security: Alarm system
- Utilities: 200 Amp electric service with circuit breakers; Individual electric meter; Public sewer
- Home design: Property type details not specified; Stories and entry level not specified; Facing direction not specified
- Construction: Building area listed (2,528 total building area); Year built not specified; Construction materials and roof/foundation not specified
- Exterior features: Listed as a fixer property
Interior
- Kitchen: No appliances included
- Bedrooms: 9 total rooms (bedroom count not separately specified)
- Flooring: Carpet; Wood
- Bathrooms: 1 full bathroom; 1 half bathroom
- Heating & cooling: Natural gas heating; Has heating
- Interior features: Alarm system
- Laundry & utility: No laundry appliances listed
Neighborhood map
What this means for you Summary
Snapshot
- This is a 4-bed/1.5-bath single-family listed at $239k. Condition is rated fair.
Deal economics
- At list price, monthly cash flow is $244 ($3k/yr) — positive.
- The deal already cash-flows at list — no discount required.
- Meets the 1% rule at list price ($2k rent vs $239k).
- Recommended offer: $235k (1.5% below list) — sets the bar for market timing.
- Cap rate 7.5% vs local median 3.7% in Pittsfield — top-decile yield for the area; either an underpriced asset or a hidden risk that comps aren't pricing in. Stress-test before assuming the spread holds.
Location & tenants
- Location reads 75/100 on livability (#70 in MA, #3,820 nationally) — a middle-class / working-renter tenant base. Strengths: commute A+, housing A+, health & safety A+; Watch: employment C-, amenities D+, crime D.
- Pittsfield (urban): math 19% / reading 34% proficiency, ranked #272 of 302 in MA (top 90%) — low school quality limits family demand, transient renter base, plan for 1-2y turnover.
- Zoned schools: Stearns (math 32% / reading 52%, grade F, #462 of 938 statewide, top 52%, 234 students, 0% FRL); John T Reid Middle (math 7% / reading 17%, grade F, #283 of 305 statewide, top 93%, 450 students, 0% FRL); Taconic High (math 27% / reading 37%, grade F, #255 of 343 statewide, top 77%, 860 students, 0% FRL) — zoned schools average 0% FRL vs 50% district-wide (50 pts lower); this property's tenant base skews higher-income than the district average.
- Market conditions: Rents rising fast (+7.7%/yr); 278 active listings in the ZIP; 130 units permitted in Berkshire County in 2024 (10 in 5+ unit buildings).
- This rent runs 41% of the median local income ($71k/yr) — at the standard rent-burdened threshold; future hikes will face affordability resistance.
Forward outlook
- Local home prices are declining (-3.0%/yr); year-one equity from $2k of loan paydown is wiped out by about $7k of value loss. Plan a longer hold.
- Berkshire County population projected at -24% by 2050 — secular population decline; favor cash flow + early exit over multi-decade hold.
- At projected returns (-3.0% appreciation + 7.7% rent growth), your $67k cash investment doubles in ~10 years — after that, you're playing with house money.
Negotiation context
- It's been on market 21 days — a 2% lower offer ($235k) is reasonable based on typical stale-listing flexibility.
Risks & watch-outs
- Watch-outs: built in 1900 — expect roof / HVAC / electrical / plumbing capex.
Questions for the listing agent
- Have any recent inspections been done? Can we get a copy of the seller's disclosures and any deferred-maintenance estimates?
- Built in 1900 — when were the roof, HVAC, electrical panel, plumbing, and water heater last replaced?
- Is there a deadline driving the sale (1031 exchange, divorce, estate, relocation)? That informs how much negotiation room exists.
- Schools are D-rated, which usually means shorter tenancies and higher turnover. Who's the typical renter profile here, and what's been the actual vacancy rate?
- Crime grade is D in this area — have there been break-ins, vandalism, or insurance claims at this property in the last 3 years? What carrier currently insures it and at what premium?
- What's the average days-on-market for RENTAL listings here right now (not sales)? A rising rental-DOM trend means longer vacancies and softer asking-rent achievability than the comps imply.
- What's the recent tenant-quality profile in this submarket — average credit score on applications, eviction rate, late-payment / NSF rate, and stable-employment percentage? A property-management company in the area should have these aggregated.
- How much new for-sale + rental construction is in the pipeline within 1–3 miles? Heavy new supply typically softens prices + rents 12–24 months out; constrained supply supports both.
Investment metrics
- 1% rule
- 1.00% ✓
- Cap rate
- 7.52%
- Cash-on-cash
- 4.38%
- DSCR
- 1.19
- GRM
- 8.3
CMA / ARV
- ARV (median comp)
- $289,373
- List price
- $239,000
- Delta
- -17.41%
- Verdict
- UNDERPRICED
- Comps
- 20 within 1.0 mi
Show comp detail 10 sales within ~0.75 mi
| Address | Dist | Beds/Ba | Sqft | Sold | Price | $/sf | Match |
|---|---|---|---|---|---|---|---|
| 50 Brenton Ter | 0.03mi | 5/3.5 (+1) | 2,616 (+4%) | 13mo | $345,000 | $132 | 69 |
| 25 Leroi Dr | 0.62mi | 4/3.0 | 2,412 (-5%) | 3mo | $435,000 | $180 | 55 |
| 89 Robbins Ave | 0.61mi | 4/2.0 | 2,378 (-6%) | 14mo | $118,000 | $50 | 48 |
| 47 Onota St | 0.54mi | 4/2.0 | 2,148 (-15%) | 1mo | $330,000 | $154 | 47 |
| 57 Mckinley Ter | 0.34mi | 5/2.0 (+1) | 2,160 (-15%) | 12mo | $349,900 | $162 | 43 |
| 145 Union St | 0.73mi | 5/2.5 (+1) | 2,446 (-3%) | 11mo | $285,000 | $117 | 42 |
| 41 Hampshire St | 0.46mi | 4/2.0 | 2,846 (+13%) | 20mo | $296,000 | $104 | 39 |
| 24 Weston St | 0.74mi | 5/2.5 (+1) | 2,400 (-5%) | 11mo | $390,000 | $163 | 39 |
| 11 Harding St | 0.69mi | 3/2.5 (-1) | 2,396 (-5%) | 14mo | $352,500 | $147 | 38 |
| 7 Trova Ter | 0.71mi | 4/3.0 | 2,652 (+5%) | 19mo | $469,900 | $177 | 37 |
Match score weights: distance 35% · size 25% · config 20% · recency 20%. Top-matched comps best support the ARV.
Projected returns pro-forma
-3.0% appreciation · 7.72% rent growth · sell at horizon
- IRR
- -4.3%
- Equity multiple
- 0.83×
- Total profit
- $-11,195
- Equity at exit
- $35,636
- IRR
- 10.2%
- Equity multiple
- 1.96×
- Total profit
- $64,455
- Equity at exit
- $20,664
Cash invested: $66,920 (down + closing). Projections, not guarantees.
Landlord ↔ Tenant lean methodology
- Overall (STATE)
- 20 Strongly Tenant-Friendly
- State Massachusetts
- 20 Strongly Tenant-Friendly · D+15
- County
- — inherits STATE
- City
- — inherits STATE
ZIP-level market 01201
- Rents YoY
- 7.7%
- Active inventory
- 278
- Price-to-rent
- 8.3×
Monthly cashflow live
- Estimated rent
- $2,400 medium interval (Pro) →
- Mortgage (P&I)
- −$1,253
- Tax est. 1.5%
- −$299 /mo · $3,585/yr
- Insurance
- −$100
- HOA
- −$0
- Vacancy / Maint / Mgmt
- −$504
- Net cashflow
- $244
Break-even live
Sensitivity live
| Price | -10% $409 | -5% $327 | +0% $244 | +5% $162 | +10% $79 |
|---|---|---|---|---|---|
| Rent | -10% $55 | -5% $149 | +0% $244 | +5% $339 | +10% $434 |
| Rate | -1.0pp $365 | -0.5pp $305 | base $244 | +0.5pp $182 | +1.0pp $119 |
UW: 25.0% down · 7.5% · 30yr · 1.5% tax · 5.0% vac · 8.0% maint · 8.0% mgmt
Financing live
Cash to close
- Down payment
- $59,750
- Closing costs
- $7,170
- Reserves months
- —
- Total cash needed
- —
Loan-product check · same deal, 3 products live
Conventional
25% down · 7.5% · 30yr
- Down + closing
- —
- Monthly P&I
- —
- Monthly cashflow
- —
- DSCR
- —
- Eligible?
- —
Personal DTI + credit; lowest rate.
DSCR
20% down · 8.5% · 30yr
- Down + closing
- —
- Monthly P&I
- —
- Monthly cashflow
- —
- DSCR
- —
- Eligible?
- —
No personal income docs; deal must DSCR.
Hard money
10% down · 12.0% · 12mo
- Down + closing
- —
- Monthly P&I
- —
- Monthly cashflow
- —
- DSCR
- —
- Eligible?
- —
Short-term bridge; refi at stabilization.
Listing history 6 events
-
2026-06-05statusdays on market $239,000 Pending 21 DOM
-
2026-06-02days on market $239,000 Active 20 DOM
-
2026-06-01days on market $239,000 Active 19 DOM
-
2026-05-31days on market $239,000 Active 18 DOM
-
2026-05-30days on market $239,000 Active 17 DOM
-
2026-05-13$239,000 Active 608-char remark
ⓘ Source: listings_history table (triggers on properties + properties_extension) + one-shot
backfill from property_details.listing_events for pre-trigger history.
Climate risk First Street
- Flood 1/10 Low FEMA zone X · 0% chance over 30 yrs
- Wildfire 1/10 Low
- Heat 3/10 Moderate 7 d/yr ≥92°F today · 17 d/yr by 30 yrs out
- Wind 4/10 Moderate 10% chance of damaging wind over 30 yrs
- Air quality 2/10 Low 1 unhealthy d/yr today · 1 by 30 yrs out
Nearby sold comps map
Loading sold comps map…
Walkable amenities ~0.75 mi
Loading nearby amenities…
Taxation est. · year 1
- Rental income
- $28,799
- − Mortgage interest
- −$13,388
- − Property taxes
- −$3,585
- − Insurance
- −$1,195
- − Repairs & maintenance
- −$2,304
- − Management
- −$2,304
- − Depreciation
- −$6,953
- Taxable loss
- −$929
- Est. tax savings @ 24.0%
- +$223
- After-tax cash flow
- $3,154/yr
For passive investors: Depreciation is non-cash, so a rental often shows a tax loss while cash-flowing — sheltering income. Rental losses are passive: they offset passive income freely, and up to $25,000/yr can offset ordinary (W-2) income if you actively participate and your MAGI is under $100k (phasing out to $0 by $150k); unused losses carry forward. On sale, claimed depreciation is recaptured at up to 25%, and gains may owe capital-gains tax (a 1031 exchange can defer both). Figures are a year-1 estimate at your 24.0% rate — not tax advice; consult a CPA.
Condition & rehab AI · 30 photos
This 4-bedroom home in a desirable neighborhood requires moderate repairs and updates to its kitchen, bathrooms, and exterior. Fresh paint and new countertops would significantly enhance its curb appeal and interior aesthetics.
Repairs flagged
- Moderate Kitchen cabinets — Dated appearance
- Moderate Bathtub and fixtures — Appears dated
- Minor Exterior siding — Weathered
- Minor Landscaping — Overgrown and in need of maintenance
Value-add opportunities
- Both Paint interior walls — Fresh paint enhances curb appeal and interior aesthetics
- Both Replace countertops in kitchen — Modern countertops improve functionality and aesthetics
- Both Update bathroom fixtures — New fixtures enhance functionality and aesthetics
Renovation cost estimate screening
| Repair item | Severity | Est. cost |
|---|---|---|
| Kitchen cabinets · Dated appearance | Moderate | $3,000–15,000 |
| Bathtub and fixtures · Appears dated | Moderate | $3,000–15,000 |
| Exterior siding · Weathered | Minor | $500–3,000 |
| Landscaping · Overgrown and in need of maintenance | Minor | $500–3,000 |
| Total estimated repair cost · 4 items | $7,000–36,000 |
Value-add ROI direction
- Both Paint interior walls — Fresh paint enhances curb appeal and interior aesthetics ↑
- Both Replace countertops in kitchen — Modern countertops improve functionality and aesthetics ↑
- Both Update bathroom fixtures — New fixtures enhance functionality and aesthetics ↑
ⓘ Cost ranges are severity-bucket heuristics (US national rule-of-thumb). Get contractor quotes + a written scope before underwriting a rehab budget.
Schools (NCES district)
- District
- Pittsfield
- NCES district ID
- 2509630
- Math proficiency
- 19% ▼ -10.00%
- Reading proficiency
- 34% ▼ -2.00%
- Median HH income
- $44,032
- Composite
- 22.67/100
- National rank
- #8046
- State rank
- #272 of 302 in MA
Livability — Pittsfield
- Score
- 75/100
- State rank
- #70
- US rank
- #3820
Category grades
Schools grade is shown separately in the Schools card above.
Census & demographics
- Census place
- Pittsfield, MA
- County
- Berkshire County · 44,848 people
- City population
- 44,848
- Metro
- Pittsfield, MA
- Population (ZIP)
- 44,848
- Household income
- $71,093
- Rent vs Own
- Severe rent burden
- 1580.0
Population outlook (Berkshire County) Hauer SSP2
- Today (2025)
- 119,723 people
- By 2030
- 114,608 · -4.3%
- By 2040
- 102,806 · -14.1%
- By 2050
- 91,305 · -23.7%
- By 2075
- 71,517 · -40.3%
- By 2100
- 57,988 · -51.6%
Race, ethnicity, and origin ACS 2023
- Neighborhood character
- Predominantly White (78%)
- Race & ethnicity
- White 78% Two or more races 10% Hispanic / Latino 9% Black 5% Asian 1%
- Hispanic origin (detail)
- Puerto Rican 3%
- Common ancestry
- Lithuanian 8% Romanian 6% Slovak 2%
- Foreign-born
- 7% · Canada, Jamaica
- Languages at home
- 90% English-only · Spanish 6% Other Indo-European 1% Russian/Polish/Slavic 1%
Political lean MEDSL · Berkshire
- 2024 margin
- Solid D (+39.9) · D 68.9% · R 29.0% · Other 2.1%
- 2008→2024 swing
- -12.5pp toward R · 2008: 52.4pp · 2024: 39.9pp
- All cycles
- 2024: D+39.9 2020: D+47.1 2016: D+41.5 2012: D+53.7 2008: D+52.4
Not yet ingested
- Civics
- —
Market trends
- HPI YoY
- ▼ -199.88%
- Current HPI
- 283.3421
- Rent YoY
- ▲ 7.72%
- Metro
- Pittsfield, MA
- State GDP YoY
- ▲ 2.28%
- F500 in state
- 38
Industry mix (Fortune 500 HQ in MA)
| Industry | F500 HQs | Revenue |
|---|---|---|
| Technology | 3 | $17B |
|
||
| Insurance | 2 | $84B |
|
||
| Retail | 2 | $76B |
|
||
| Life Sciences | 1 | $43B |
|
||
| Energy Technology | 1 | $31B |
|
||
| Aerospace / Defense | 1 | $18B |
|
||
Price history
2 events — show timeline
- 2026-06-04 Pending — BCMLS
- 2026-05-13 Listed $239,000 BCMLS
Cash-flow waterfall
monthlySold comps — $/sqft
last 12 mo · ≤1 miLoading sold comps…