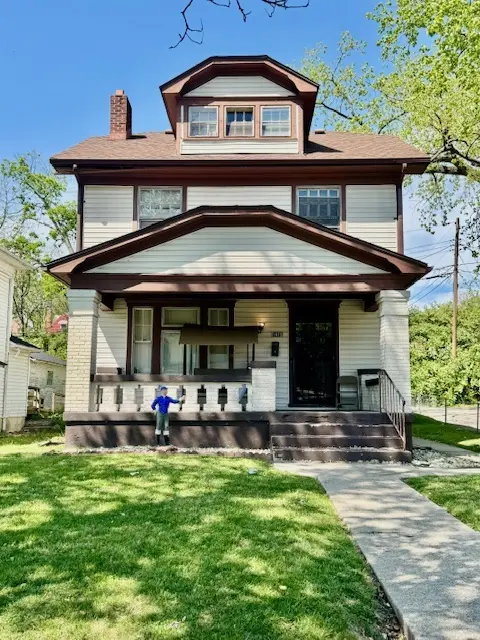
1415 Lexington Ave · Dayton, OH
Flood risk 6/10 · Moderate
- FEMA flood zone
- X (unshaded)
- Chance of flooding over 30 yrs
- 0.74%
- Est. flood insurance / yr
- $473 – $860
Fire risk 1/10 · Minimal
- Est. fire insurance / yr
- $713 – $1,323
Heat risk 4/10 · Minor
- Hot days now (above 104°F)
- 7 days/yr
- Hot days in 30 yrs
- 19 days/yr
Wind risk 2/10 · Minimal
- Chance of severe wind over 30 yrs
- 0.0%
Air-quality risk 3/10 · Minor
- Unhealthy air days now
- 2 days/yr
- Unhealthy air days in 30 yrs
- 4 days/yr
Risk factors via First Street. Map © Google.
Why this score? — see what drove the B- grade
The composite is a weighted blend of 9 inputs, each scored 0–100. Each bar is that input's sub-score; the figure is the points it added to the 100-point composite (weight × sub-score).
- Cash flow +30.0/30.0
- 1% rule +10.0/10.0
- DSCR +10.0/10.0
- ARV discount +7.5/15.0
- Rent growth +3.5/5.0
- Livability +3.2/5.0
- Condition / age +2.5/5.0
- Schools +1.3/10.0
- Appreciation +0.0/10.0
$54,900
🖨 Deal sheet (PDF) 📄 Offer letter ✓ Due diligence
Listing remarks
Expect the unexpected! This 1920’s built Dayton original retains original woodwork, oversized rooms and 3 levels of finished living area making it THE PLACE WITH SPACE! From the moment you pull up its fresh, clean exterior is a true standout. Low maintenance vinyl siding, a large covered front porch, new dimensional roofing, a 2 car detached garage and premium corner lot add to the appeal. Inside you’ll enjoy a traditional layout consisting of a large living room w/ decorative fireplace, formal dining room & kitchen authentic “swing door, ” double ovens, cozy breakfast nook and access to the fenced back yard. Space continues on the 2nd level with 3 generous be
Key facts
- 5,401 sq ft lot
- Garage
- Built 1928
Neighborhood map
What this means for you Summary
Snapshot
- This is a 4-bed/1.0-bath single-family listed at $55k.
Deal economics
- At list price, monthly cash flow is $736 ($9k/yr) — positive.
- The deal already cash-flows at list — no discount required.
- Meets the 1% rule at list price ($1k rent vs $55k).
- Recommended offer: $53k (3.0% below list) — sets the bar for market timing.
- Cap rate 22.4% vs local median 7.3% in Dayton — top-decile yield for the area; either an underpriced asset or a hidden risk that comps aren't pricing in. Stress-test before assuming the spread holds.
Location & tenants
- Location reads 65/100 on livability (#716 in OH) — a middle-class / working-renter tenant base. Strengths: cost of living A+, housing A+, health & safety A; Watch: amenities C-, crime F, commute F.
- Dayton City (urban): math 12% / reading 21% proficiency, ranked #641 of 656 in OH (top 98%) — low school quality limits family demand, transient renter base, plan for 1-2y turnover; 74% free/reduced lunch — lower-income household profile, screen leases tightly.
- Zoned schools: River'S Edge Montessori Elementary School (math 22% / reading 32%, grade F, #1,193 of 1,584 statewide, top 76%, 494 students, 0% FRL); Belmont High School (math 5% / reading 20%, grade F, #720 of 781 statewide, top 93%, 1,100 students, 0% FRL) — zoned schools average 0% FRL vs 74% district-wide (74 pts lower); this property's tenant base skews higher-income than the district average.
- Market conditions: Rents rising (+4.0%/yr); 87 active listings in the ZIP; 36 comparable units currently listed for rent nearby; rentals lingering (median 46d on market — plan ~5-8 weeks vacancy on turnover, expect pricing pressure); 53% of comp listings sitting > 30 days — soft ceiling on asking rent; 907 units permitted in Montgomery County in 2024 (416 in 5+ unit buildings).
- This rent runs 34% of the median local income ($48k/yr) — at the standard rent-burdened threshold; future hikes will face affordability resistance.
Forward outlook
- Local home prices are declining (-3.0%/yr); year-one equity from $380 of loan paydown is wiped out by about $2k of value loss. Plan a longer hold.
- Montgomery County population projected at -10% by 2050 — secular population decline; favor cash flow + early exit over multi-decade hold.
- At projected returns (-3.0% appreciation + 4.0% rent growth), your $15k cash investment doubles in ~2 years — after that, you're playing with house money.
Negotiation context
- It's been on market 45 days — a 3% lower offer ($53k) is reasonable based on typical stale-listing flexibility.
Risks & watch-outs
- Watch-outs: built in 1928 — expect roof / HVAC / electrical / plumbing capex.
- Climate carrying-cost: major flood risk — expect insurance premiums to compound above CPI over the hold.
Questions for the listing agent
- It's been on market 45 days. Have you received any prior offers? Is the seller open to a 3% concession, seller financing, or rate buy-down credit?
- Built in 1928 — when were the roof, HVAC, electrical panel, plumbing, and water heater last replaced?
- Is there a deadline driving the sale (1031 exchange, divorce, estate, relocation)? That informs how much negotiation room exists.
- Crime grade is F in this area — have there been break-ins, vandalism, or insurance claims at this property in the last 3 years? What carrier currently insures it and at what premium?
- What's the average days-on-market for RENTAL listings here right now (not sales)? A rising rental-DOM trend means longer vacancies and softer asking-rent achievability than the comps imply.
- What's the recent tenant-quality profile in this submarket — average credit score on applications, eviction rate, late-payment / NSF rate, and stable-employment percentage? A property-management company in the area should have these aggregated.
- How much new for-sale + rental construction is in the pipeline within 1–3 miles? Heavy new supply typically softens prices + rents 12–24 months out; constrained supply supports both.
Investment metrics
- 1% rule
- 2.50% ✓
- Cap rate
- 22.37%
- Cash-on-cash
- 57.43%
- DSCR
- 3.56
- GRM
- 3.3
CMA / ARV
- ARV (median comp)
- $112,130
- List price
- $54,900
- Delta
- -51.04%
- Verdict
- UNDERPRICED
- Comps
- 20 within 1.0 mi
Show comp detail 12 sales within ~0.75 mi
| Address | Dist | Beds/Ba | Sqft | Sold | Price | $/sf | Match |
|---|---|---|---|---|---|---|---|
| 1029 Shakespeare Ave | 0.07mi | 3/1.0 (-1) | 1,436 (0%) | 4mo | $71,000 | $49 | 88 |
| 1419 Lexington Ave | 0.01mi | 3/1.0 (-1) | 1,496 (+4%) | 8mo | $27,280 | $18 | 81 |
| 3100 Princeton Dr | 0.33mi | 3/1.0 (-1) | 1,448 (+1%) | 6mo | $65,000 | $45 | 73 |
| 1135 Windsor Ave | 0.36mi | 3/1.0 (-1) | 1,484 (+3%) | 4mo | $45,000 | $30 | 70 |
| 1119 Windsor Ave | 0.36mi | 3/1.0 (-1) | 1,380 (-4%) | 7mo | $58,000 | $42 | 66 |
| 1124 Seneca Dr | 0.14mi | 3/2.0 (-1) | 1,300 (-10%) | 6mo | $78,000 | $60 | 64 |
| 1312 Canfield Ave | 0.25mi | 4/1.5 | 1,239 (-14%) | 4mo | $44,220 | $36 | 60 |
| 1526 Academy Pl | 0.57mi | 3/1.5 (-1) | 1,314 (-8%) | 8mo | $154,900 | $118 | 46 |
| 2515 Hoover Ave | 0.48mi | 3/2.5 (-1) | 1,608 (+12%) | 1mo | $120,000 | $75 | 46 |
| 1725 W Grand Ave | 0.53mi | 3/1.5 (-1) | 1,629 (+13%) | 2mo | $144,900 | $89 | 45 |
| 1616 Wesleyan Rd | 0.71mi | 4/2.0 | 1,306 (-9%) | 8mo | $159,000 | $122 | 41 |
| 1656 Tennyson Ave | 0.68mi | 3/1.5 (-1) | 1,290 (-10%) | 8mo | $160,000 | $124 | 38 |
Match score weights: distance 35% · size 25% · config 20% · recency 20%. Top-matched comps best support the ARV.
Projected returns pro-forma
-3.0% appreciation · 3.98% rent growth · sell at horizon
- IRR
- 57.0%
- Equity multiple
- 3.56×
- Total profit
- $39,333
- Equity at exit
- $8,186
- IRR
- 62.3%
- Equity multiple
- 7.53×
- Total profit
- $100,327
- Equity at exit
- $4,747
Cash invested: $15,372 (down + closing). Projections, not guarantees.
Landlord ↔ Tenant lean methodology
- Overall (STATE)
- 73 Landlord-Friendly
- State Ohio
- 73 Landlord-Friendly · R+6
- County
- — inherits STATE
- City
- — inherits STATE
ZIP-level market 45402
- Rents YoY
- 4.0%
- Active inventory
- 87
- Price-to-rent
- 3.3×
Monthly cashflow live
- Estimated rent
- $1,374 high interval (Pro) →
- Mortgage (P&I)
- −$288
- Tax from tax record
- −$39 /mo · $470/yr
- Insurance
- −$23
- HOA
- −$0
- Vacancy / Maint / Mgmt
- −$289
- Net cashflow
- $736
Break-even live
Sensitivity live
| Price | -10% $767 | -5% $751 | +0% $736 | +5% $720 | +10% $705 |
|---|---|---|---|---|---|
| Rent | -10% $627 | -5% $681 | +0% $736 | +5% $790 | +10% $844 |
| Rate | -1.0pp $763 | -0.5pp $750 | base $736 | +0.5pp $722 | +1.0pp $707 |
UW: 25.0% down · 7.5% · 30yr · 1.5% tax · 5.0% vac · 8.0% maint · 8.0% mgmt
Financing live
Cash to close
- Down payment
- $13,725
- Closing costs
- $1,647
- Reserves months
- —
- Total cash needed
- —
Loan-product check · same deal, 3 products live
Conventional
25% down · 7.5% · 30yr
- Down + closing
- —
- Monthly P&I
- —
- Monthly cashflow
- —
- DSCR
- —
- Eligible?
- —
Personal DTI + credit; lowest rate.
DSCR
20% down · 8.5% · 30yr
- Down + closing
- —
- Monthly P&I
- —
- Monthly cashflow
- —
- DSCR
- —
- Eligible?
- —
No personal income docs; deal must DSCR.
Hard money
10% down · 12.0% · 12mo
- Down + closing
- —
- Monthly P&I
- —
- Monthly cashflow
- —
- DSCR
- —
- Eligible?
- —
Short-term bridge; refi at stabilization.
Rent comps 36 comps
| Address | Beds | Baths | Sqft | Rent | $/sqft | DOM | Units | Dist |
|---|---|---|---|---|---|---|---|---|
| 1045 Shakespeare Ave Dayton, OH | 3.0 | 1.0 | 1435 | $1,275 | $0.89 | 45d | 1 | 0.06mi |
| 660 Gramont Ave Dayton, OH | 3.0 | 1.0 | 1142 | $1,050 | $0.92 | 5d | 1 | 0.27mi |
| 635 Anna St Dayton, OH | 3.0 | 1.0 | 960 | $1,300 | $1.35 | 16d | 1 | 0.30mi |
| 3220 Princeton Dr Dayton, OH | 3.0 | 1.0 | 900 | $1,000 | $1.11 | 45d | 1 | 0.41mi |
| 1816 N James H McGee Blvd Apt B Dayton, OH | 3.0 | 1.0 | 950 | $1,150 | $1.21 | 45d | 1 | 0.49mi |
| 1816 N James H McGee Blvd Unit C Dayton, OH | 3.0 | 1.0 | 950 | $1,150 | $1.21 | 4d | 1 | 0.49mi |
| 1816 N James H McGee Blvd Apt A Dayton, OH | 3.0 | 1.0 | 950 | $1,200 | $1.26 | 4d | 1 | 0.49mi |
| 437 Lorenz Ave Dayton, OH | 3.0 | 1.0 | 1322 | $1,200 | $0.91 | 25d | 1 | 0.58mi |
| 617 Westwood Ave Dayton, OH | 3.0 | 1.0 | 1304 | $1,050 | $0.81 | 45d | 1 | 0.59mi |
| 3207 Cornell Dr Dayton, OH | 3.0 | 1.0 | 1168 | $1,000 | $0.86 | 5d | 1 | 0.61mi |
| 863 N Upland Ave Dayton, OH | 3.0 | 1.0 | 1042 | $1,200 | $1.15 | 45d | 1 | 0.76mi |
| 424 Lexington Ave Dayton, OH | 3.0 | 2.0 | 1536 | $1,025 | $0.67 | 45d | 1 | 0.78mi |
| 1119 Superior Ave Unit 1119 Dayton, OH | 3.0 | 1.0 | 1435 | $1,350 | $0.94 | 5d | 1 | 0.78mi |
| 216 N Ardmore Ave Dayton, OH | 3.0 | 1.0 | 1500 | $1,100 | $0.73 | 5d | 1 | 0.83mi |
| 3311 Otterbein Ave Dayton, OH | 3.0 | 1.5 | 1004 | $1,300 | $1.29 | 13d | 1 | 0.93mi |
| 1743 Radcliffe Rd Dayton, OH | 3.0 | 1.5 | 1729 | $1,200 | $0.69 | 45d | 1 | 0.95mi |
| 1927 Burroughs Dr Dayton, OH | 3.0 | 2.0 | 1409 | $1,245 | $0.88 | 16d | 1 | 0.97mi |
| 1225 Amherst Pl Dayton, OH | 3.0 | 1.0 | 1548 | $1,300 | $0.84 | 16d | 1 | 0.98mi |
| 1011 N Broadway St Dayton, OH | 3.0 | 1.5 | 1700 | $950 | $0.56 | 45d | 1 | 1.05mi |
| 70 Gramont Ave Dayton, OH | 3.0 | 1.5 | 966 | $1,300 | $1.35 | 4d | 1 | 1.06mi |
| 2232 Salem Ave Dayton, OH | 3.0 | 1.0 | 1250 | $1,200 | $0.96 | 5d | 1 | 1.10mi |
| 2247 Salem Ave Unit 2247 Dayton, OH | 3.0 | 1.5 | 1300 | $1,350 | $1.04 | 5d | 1 | 1.13mi |
| 2247 Salem Ave Unit 2249 Dayton, OH | 3.0 | 1.5 | 1300 | $1,400 | $1.08 | 45d | 1 | 1.13mi |
| 942 Harvard Blvd Dayton, OH | 3.0 | 2.0 | 1596 | $1,200 | $0.75 | 5d | 1 | 1.19mi |
| 2141 Philadelphia Dr Dayton, OH | 3.0 | 1.0 | 1736 | $1,395 | $0.80 | 45d | 1 | 1.20mi |
| 40 S Mathison St Dayton, OH | 3.0 | 1.0 | 1300 | $1,200 | $0.92 | 16d | 1 | 1.21mi |
| 42 S Mathison St Dayton, OH | 3.0 | 1.0 | 1300 | $1,220 | $0.94 | 5d | 1 | 1.21mi |
| 905 Neal Ave Dayton, OH | 3.0 | 1.0 | 1100 | $850 | $0.77 | 45d | 1 | 1.23mi |
| 265 Victor Ave Dayton, OH | 3.0 | 1.0 | 1204 | $900 | $0.75 | 45d | 1 | 1.25mi |
| 234 Santa Clara Ave Dayton, OH | 3.0 | 1.0 | 1368 | $1,125 | $0.82 | 45d | 1 | 1.36mi |
| 439 W Fairview Ave Dayton, OH | 3.0 | 1.0 | 1500 | $1,200 | $0.80 | 45d | 1 | 1.41mi |
| 167 W Hudson Ave Dayton, OH | 3.0 | 1.5 | 1344 | $1,185 | $0.88 | 45d | 1 | 1.42mi |
| 201 W Norman Ave Dayton, OH | 3.0 | 1.0 | 1424 | $1,200 | $0.84 | 45d | 1 | 1.43mi |
| 1019 Cherry Dr Dayton, OH | 4.0 | 1.0 | 1057 | $1,125 | $1.06 | 45d | 1 | 1.44mi |
| 181 W Norman Ave Dayton, OH | 3.0 | 2.0 | 1228 | $1,150 | $0.94 | 45d | 1 | 1.44mi |
| 338 Kenwood Ave Dayton, OH | 3.0 | 1.5 | 1512 | $1,195 | $0.79 | 45d | 1 | 1.45mi |
Listing history 15 events
-
2026-06-15statusdays on market $54,900 Pending 45 DOM
-
2026-06-14days on market $54,900 Active 44 DOM
-
2026-06-13statusdays on market $54,900 Active 43 DOM
-
2026-06-10days on market $54,900 ActiveUnderContract 41 DOM
-
2026-06-09days on market $54,900 ActiveUnderContract 40 DOM
-
2026-06-08days on market $54,900 ActiveUnderContract 39 DOM
-
2026-06-07days on market $54,900 ActiveUnderContract 38 DOM
-
2026-06-05days on market $54,900 ActiveUnderContract 35 DOM
-
2026-06-03days on market $54,900 ActiveUnderContract 34 DOM
-
2026-06-02days on market $54,900 ActiveUnderContract 33 DOM
-
2026-06-01days on market $54,900 ActiveUnderContract 32 DOM
-
2026-05-31days on market $54,900 ActiveUnderContract 31 DOM
-
2026-05-14price $54,900 1215-char remark
-
2026-04-30$59,900 Active 1215-char remark
-
1997-11-04soldstatus $49,900
ⓘ Source: listings_history table (triggers on properties + properties_extension) + one-shot
backfill from property_details.listing_events for pre-trigger history.
Tax reassessment forecast OH · Partial reset (capped growth)
- Current annual tax
- $470 · $39/mo
- Projected year-2 tax
- $663 · $55/mo
- Expected delta
- +$193/yr (+$16/mo · 41.2%)
ⓘ Screening estimate from a state-policy table — verify with the county assessor before closing.
Climate risk First Street
- Flood 6/10 Major FEMA zone X (unshaded) · 74% chance over 30 yrs
- Wildfire 1/10 Low
- Heat 4/10 Moderate 7 d/yr ≥104°F today · 19 d/yr by 30 yrs out
- Wind 2/10 Low 0% chance of damaging wind over 30 yrs
- Air quality 3/10 Moderate 2 unhealthy d/yr today · 4 by 30 yrs out
Nearby sold comps map
Loading sold comps map…
Walkable amenities ~0.75 mi
Loading nearby amenities…
Taxation est. · year 1
- Rental income
- $16,491
- − Mortgage interest
- −$3,075
- − Property taxes
- −$470
- − Insurance
- −$274
- − Repairs & maintenance
- −$1,319
- − Management
- −$1,319
- − Depreciation
- −$1,597
- Taxable income
- $8,436
- Est. tax owed @ 24.0%
- −$2,025
- After-tax cash flow
- $6,804/yr
For passive investors: Depreciation is non-cash, so a rental often shows a tax loss while cash-flowing — sheltering income. Rental losses are passive: they offset passive income freely, and up to $25,000/yr can offset ordinary (W-2) income if you actively participate and your MAGI is under $100k (phasing out to $0 by $150k); unused losses carry forward. On sale, claimed depreciation is recaptured at up to 25%, and gains may owe capital-gains tax (a 1031 exchange can defer both). Figures are a year-1 estimate at your 24.0% rate — not tax advice; consult a CPA.
Schools (NCES district)
- District
- Dayton City
- NCES district ID
- 3904384
- Math proficiency
- 12% ▼ -12.00%
- Reading proficiency
- 21% ▼ -11.00%
- Median HH income
- $28,688
- Composite
- 12.94/100
- National rank
- #9579
- State rank
- #641 of 656 in OH
Livability — Dayton
- Score
- 65/100
- State rank
- #716
- US rank
- #12895
Category grades
Schools grade is shown separately in the Schools card above.
Census & demographics
- Census place
- Dayton, OH
- County
- Montgomery County · 459,541 people
- City population
- 164,387
- Metro
- Dayton-Kettering, OH
- Population (ZIP)
- 9,407
- Household income
- $48,401
- Rent vs Own
- Severe rent burden
- 404.0
Population outlook (Montgomery County) Hauer SSP2
- Today (2025)
- 523,241 people
- By 2030
- 514,948 · -1.6%
- By 2040
- 493,378 · -5.7%
- By 2050
- 469,639 · -10.2%
- By 2075
- 418,360 · -20.0%
- By 2100
- 353,315 · -32.5%
Race, ethnicity, and origin ACS 2023
- Neighborhood character
- Diverse neighborhood (Simpson 0.57)
- Race & ethnicity
- Black 57% White 32% Two or more races 7% Hispanic / Latino 5%
- Hispanic origin (detail)
- Mexican 1%
- Common ancestry
- Italian 2% Serbian 2% Slovak 1%
- Foreign-born
- 5% · Canada, Vietnam, Jamaica
- Languages at home
- 94% English-only · Spanish 4% Other Asian/Pacific 1% Arabic 1%
Political lean MEDSL · Montgomery
- 2024 margin
- Toss-up / Even · D 49.8% · R 49.3%
- 2008→2024 swing
- -5.8pp toward R · 2008: 6.2pp · 2024: 0.5pp
- All cycles
- 2024: D+0.5 2020: D+2.2 2016: R+1.2 2012: D+3.1 2008: D+6.2
Not yet ingested
- Civics
- —
Market trends
- HPI YoY
- ▼ -81.89%
- Current HPI
- 149.7909
- Rent YoY
- ▲ 3.98%
- Metro
- Dayton-Kettering, OH
- State GDP YoY
- ▲ 1.98%
- F500 in state
- 48
Industry mix (Fortune 500 HQ in OH)
| Industry | F500 HQs | Revenue |
|---|---|---|
| Insurance | 3 | $145B |
|
||
| Industrial Machinery | 3 | $49B |
|
||
| Financial Services | 3 | $24B |
|
||
| Consumer Goods | 2 | $93B |
|
||
| Aerospace / Defense | 2 | $47B |
|
||
| Utilities | 2 | $33B |
|
||
Price history
+10.0% since first listed2 events — show timeline
- 2026-05-14 Price Changed $54,900 Dayton MLS
- 1997-11-04 Sold (Public Records) $49,900 Public Records
Property tax history
-2.0%/yrLatest (2025): $470 · -4.2% YoY. Source: county tax records.
Cash-flow waterfall
monthlySold comps — $/sqft
last 12 mo · ≤1 miLoading sold comps…