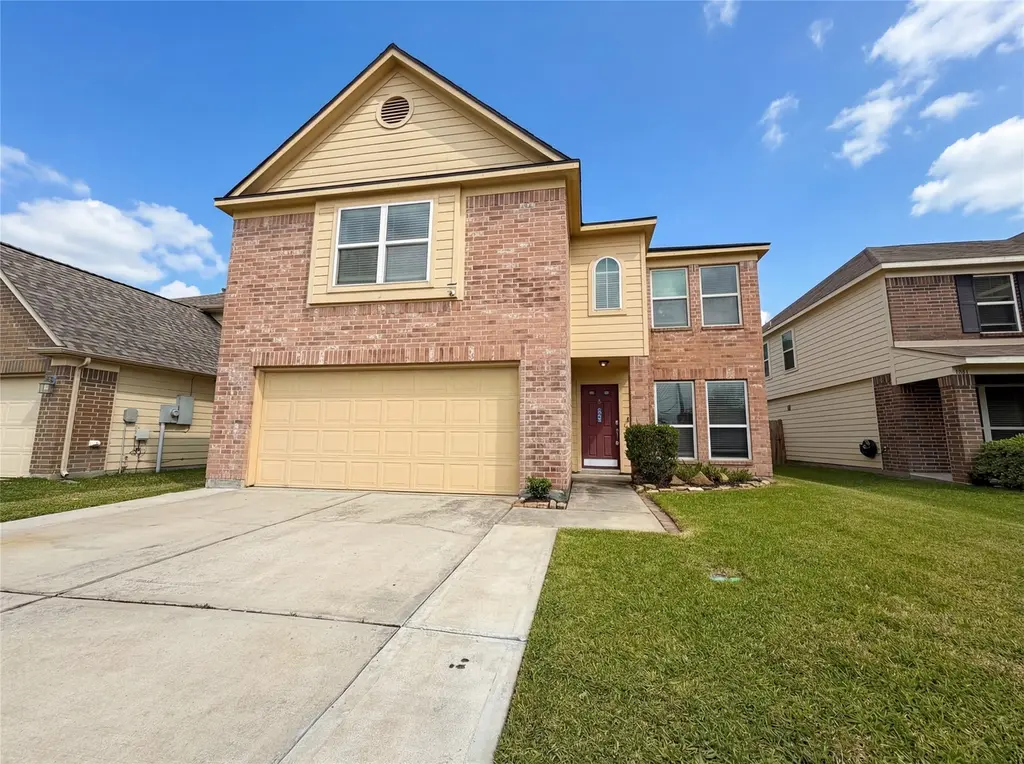
9881 Hyacinth Way · The Woodlands, TX
Flood risk 1/10 · Minimal
- FEMA flood zone
- X (unshaded)
- Chance of flooding over 30 yrs
- 0.0%
- Est. flood insurance / yr
- $507 – $1,088
Fire risk 4/10 · Minor
- Est. fire insurance / yr
- $1,222 – $2,270
Heat risk 9/10 · Severe
- Hot days now (above 111°F)
- 7 days/yr
- Hot days in 30 yrs
- 26 days/yr
Wind risk 8/10 · Major
- Chance of severe wind over 30 yrs
- 99.0%
Air-quality risk 3/10 · Minor
- Unhealthy air days now
- 2 days/yr
- Unhealthy air days in 30 yrs
- 3 days/yr
Risk factors via First Street. Map © Google.
Why this score? — see what drove the D- grade
The composite is a weighted blend of 9 inputs, each scored 0–100. Each bar is that input's sub-score; the figure is the points it added to the 100-point composite (weight × sub-score).
- ARV discount +10.3/15.0
- Cash flow +7.5/30.0
- Schools +5.1/10.0
- Livability +4.5/5.0
- Rent growth +3.5/5.0
- 1% rule +3.3/10.0
- Condition / age +2.5/5.0
- DSCR +1.7/10.0
- Appreciation +0.0/10.0
$256,000
🖨 Deal sheet (PDF) 📄 Offer letter ✓ Due diligence
Listing remarks MLS
Discover 9881 Hyacinth Way, a residence providing a functional layout designed for ease of use. The kitchen is equipped with a functional island, an accent backsplash, and all stainless steel appliances, enhancing daily culinary tasks. The primary bathroom includes a separate tub and shower, providing practical utility. A covered patio extends to a fully fenced backyard, providing a defined and enclosed outdoor area. This property combines practical interior features with usable exterior space. Included 100-Day Home Warranty with buyer activation
Key facts
- Functional island
- Covered patio
- Functional layout
Tags
Neighborhood map
What this means for you Summary
Snapshot
- This is a 3-bed/3.0-bath single-family listed at $256k.
Deal economics
- At list price, monthly cash flow is $-313 ($-4k/yr) — negative.
- To cash-flow at today's rent, offer at most $201k (21.6% below list).
- To meet the 1% rule (rent ≥ 1% of price), the offer needs to be $213k (16.7% below list).
- Recommended offer: $201k (21.6% below list) — sets the bar for cash-flow.
- Cap rate 4.8% vs local median 2.3% in The Woodlands — top-decile yield for the area; either an underpriced asset or a hidden risk that comps aren't pricing in. Stress-test before assuming the spread holds.
Location & tenants
- Location reads 91/100 on livability (#1 in TX, #47 nationally) — a professional / high-income tenant draw. Strengths: amenities A+, commute A+, employment A+; Watch: cost of living D-.
- Conroe ISD (other): math 57% / reading 57% proficiency, ranked #69 of 826 in TX (top 8%) — acceptable for families but not a draw, mixed tenant base, ~2y average lease.
- Zoned schools: Houser El (math 47% / reading 42%, grade F, #1,155 of 4,322 statewide, top 29%, 636 students, 70% FRL); Irons J H (math 54% / reading 53%, grade C+, #275 of 1,662 statewide, top 17%, 1,344 students, 52% FRL); Oak Ridge H S (math 48% / reading 62%, grade C, #373 of 1,632 statewide, top 23%, 2,672 students, 42% FRL) — zoned schools average 55% FRL vs 34% district-wide (20 pts higher); higher-poverty schools than district average — tighter screening recommended.
- Market conditions: Rents rising (+3.9%/yr); 320 active listings in the ZIP; 6 comparable units currently listed for rent nearby; rentals leasing fast (median 5d on market — plan ~1-2 weeks tenant-placement turnaround); high-income renter base; 13,259 units permitted in Montgomery County in 2024 (1,402 in 5+ unit buildings).
Forward outlook
- Local home prices are declining (-3.0%/yr); year-one equity from $2k of loan paydown is wiped out by about $8k of value loss. Plan a longer hold.
- Montgomery County population projected at +65% by 2050 — long-run rental-demand tailwind backs the buy-and-hold thesis.
Negotiation context
- It's been on market 45 days — a 3% lower offer ($248k) is reasonable based on typical stale-listing flexibility.
Risks & watch-outs
- Climate carrying-cost: severe wind risk, 99% chance of damaging wind over 30y; extreme-heat days projected 7→26/yr by 2055 (HVAC capex compounding) — expect insurance premiums to compound above CPI over the hold.
Questions for the listing agent
- What do current leases actually rent for vs. the listed asking? Can we see a recent rent roll and the last 12 months of T-12 income?
- It's been on market 45 days. Have you received any prior offers? Is the seller open to a 22% concession, seller financing, or rate buy-down credit?
- What does the HOA fee cover, when was the last increase, and are there any pending special assessments or reserve-fund shortfalls?
- Is there a deadline driving the sale (1031 exchange, divorce, estate, relocation)? That informs how much negotiation room exists.
- Schools are A-rated — typically a magnet for longer-tenancy family renters. What's the average tenant stay here, and is there a school-zone premium baked into asking?
- The area grade is low — what's the realistic commute time and amenity access for the typical tenant pool here? Any planned neighborhood developments (good or bad) we should know about?
- What's the average days-on-market for RENTAL listings here right now (not sales)? A rising rental-DOM trend means longer vacancies and softer asking-rent achievability than the comps imply.
- What's the recent tenant-quality profile in this submarket — average credit score on applications, eviction rate, late-payment / NSF rate, and stable-employment percentage? A property-management company in the area should have these aggregated.
- How much new for-sale + rental construction is in the pipeline within 1–3 miles? Heavy new supply typically softens prices + rents 12–24 months out; constrained supply supports both.
Investment metrics
- 1% rule
- 0.83% ✗
- Cap rate
- 4.83%
- Cash-on-cash
- -5.24%
- DSCR
- 0.77
- GRM
- 10.0
CMA / ARV
- ARV (median comp)
- $273,168
- List price
- $256,000
- Delta
- -6.28%
- Verdict
- FAIR
- Comps
- 20 within 1.0 mi
Show comp detail 12 sales within ~0.75 mi
| Address | Dist | Beds/Ba | Sqft | Sold | Price | $/sf | Match |
|---|---|---|---|---|---|---|---|
| 10198 N Whimbrel Cir N | 0.26mi | 3/2.0 | 2,038 (-1%) | 4mo | $295,000 | $145 | 78 |
| 16916 Tableland Trl | 0.25mi | 4/2.5 (+1) | 2,055 (-0%) | 5mo | $239,000 | $116 | 76 |
| 16734 Warbler Dr | 0.32mi | 4/3.0 (+1) | 2,096 (+2%) | 4mo | $255,000 | $122 | 74 |
| 9921 Kingfisher Dr | 0.30mi | 4/2.5 (+1) | 2,096 (+2%) | 4mo | $248,000 | $118 | 73 |
| 9838 Bobolink Dr | 0.20mi | 3/2.5 | 2,277 (+10%) | 2mo | $270,000 | $119 | 70 |
| 16790 N Rail Dr | 0.10mi | 4/3.0 (+1) | 1,791 (-13%) | 0mo | $265,000 | $148 | 68 |
| 16758 N Blue Jay Dr | 0.21mi | 3/2.0 | 1,814 (-12%) | 2mo | $240,000 | $132 | 65 |
| 10190 N Whimbrel Cir | 0.28mi | 4/2.5 (+1) | 2,254 (+9%) | 1mo | $317,000 | $141 | 64 |
| 10311 Woodhollow Dr | 0.41mi | 4/2.5 (+1) | 2,180 (+6%) | 3mo | $324,900 | $149 | 62 |
| 10158 N Whimbrel Cir | 0.36mi | 4/2.5 (+1) | 2,284 (+11%) | 1mo | $316,000 | $138 | 58 |
| 16373 Olive Sparrow Dr | 0.59mi | 3/2.0 | 1,774 (-14%) | 5mo | $270,000 | $152 | 41 |
| 14 Bay Chapel Ct | 0.69mi | 3/2.0 | 2,330 (+13%) | 2mo | $349,900 | $150 | 41 |
Match score weights: distance 35% · size 25% · config 20% · recency 20%. Top-matched comps best support the ARV.
Projected returns pro-forma
-3.0% appreciation · 3.88% rent growth · sell at horizon
- IRR
- -24.0%
- Equity multiple
- 0.17×
- Total profit
- $-59,331
- Equity at exit
- $38,170
- IRR
- -16.4%
- Equity multiple
- 0.04×
- Total profit
- $-68,666
- Equity at exit
- $22,134
Cash invested: $71,680 (down + closing). Projections, not guarantees.
Landlord ↔ Tenant lean methodology
- Overall (STATE)
- 87 Strongly Landlord-Friendly
- State Texas
- 87 Strongly Landlord-Friendly · R+5
- County
- — inherits STATE
- City
- — inherits STATE
ZIP-level market 77385
- Home prices YoY
- -27.5%
- Rents YoY
- 3.9%
- Active inventory
- 320
- Price-to-rent
- 10.0×
Monthly cashflow live
- Estimated rent
- $2,132 high interval (Pro) →
- Mortgage (P&I)
- −$1,342
- Tax from tax record
- −$514 /mo · $6,164/yr
- Insurance
- −$107
- HOA
- −$34
- Vacancy / Maint / Mgmt
- −$448
- Net cashflow
- $-313
Break-even live
Sensitivity live
| Price | -10% $-168 | -5% $-240 | +0% $-313 | +5% $-385 | +10% $-458 |
|---|---|---|---|---|---|
| Rent | -10% $-481 | -5% $-397 | +0% $-313 | +5% $-229 | +10% $-144 |
| Rate | -1.0pp $-184 | -0.5pp $-248 | base $-313 | +0.5pp $-379 | +1.0pp $-447 |
UW: 25.0% down · 7.5% · 30yr · 1.5% tax · 5.0% vac · 8.0% maint · 8.0% mgmt
Financing live
Cash to close
- Down payment
- $64,000
- Closing costs
- $7,680
- Reserves months
- —
- Total cash needed
- —
Loan-product check · same deal, 3 products live
Conventional
25% down · 7.5% · 30yr
- Down + closing
- —
- Monthly P&I
- —
- Monthly cashflow
- —
- DSCR
- —
- Eligible?
- —
Personal DTI + credit; lowest rate.
DSCR
20% down · 8.5% · 30yr
- Down + closing
- —
- Monthly P&I
- —
- Monthly cashflow
- —
- DSCR
- —
- Eligible?
- —
No personal income docs; deal must DSCR.
Hard money
10% down · 12.0% · 12mo
- Down + closing
- —
- Monthly P&I
- —
- Monthly cashflow
- —
- DSCR
- —
- Eligible?
- —
Short-term bridge; refi at stabilization.
Rent comps 6 comps
| Address | Beds | Baths | Sqft | Rent | $/sqft | DOM | Units | Dist |
|---|---|---|---|---|---|---|---|---|
| 16782 N Thrasher Dr Conroe, TX | 4.0 | 2.5 | 2137 | $2,040 | $0.95 | 0d | 1 | 0.15mi |
| 9819 Kiwi Ln Conroe, TX | 4.0 | 2.0 | 1434 | $1,826 | $1.27 | 8d | 1 | 0.37mi |
| 2662 S Woodloch St Conroe, TX | 3.0 | 2.0 | 2046 | $1,910 | $0.93 | 0d | 1 | 0.95mi |
| 2657 S Woodloch St Conroe, TX | 4.0 | 2.0 | 1920 | $1,860 | $0.97 | 0d | 1 | 1.01mi |
| 9295 Inland Leather Ln Conroe, TX | 4.0 | 2.5 | 2497 | $2,400 | $0.96 | 4d | 1 | 1.39mi |
| 17153 Upland Bent Ct Conroe, TX | 4.0 | 2.5 | 2752 | $2,149 | $0.78 | 22d | 1 | 1.45mi |
HOA detail
- Monthly dues
- $34 · $408/yr
Listing history 3 events
-
2026-04-30price $256,000 552-char remark
Show marketing remark (552 chars)
Discover 9881 Hyacinth Way, a residence providing a functional layout designed for ease of use. The kitchen is equipped with a functional island, an accent backsplash, and all stainless steel appliances, enhancing daily culinary tasks. The primary bathroom includes a separate tub and shower, providing practical utility. A covered patio extends to a fully fenced backyard, providing a defined and enclosed outdoor area. This property combines practical interior features with usable exterior space. Included 100-Day Home Warranty with buyer activation
-
2026-04-07$260,000 Active 552-char remark
Show marketing remark (552 chars)
Discover 9881 Hyacinth Way, a residence providing a functional layout designed for ease of use. The kitchen is equipped with a functional island, an accent backsplash, and all stainless steel appliances, enhancing daily culinary tasks. The primary bathroom includes a separate tub and shower, providing practical utility. A covered patio extends to a fully fenced backyard, providing a defined and enclosed outdoor area. This property combines practical interior features with usable exterior space. Included 100-Day Home Warranty with buyer activation
-
2026-03-27soldstatus
ⓘ Source: listings_history table (triggers on properties + properties_extension) + one-shot
backfill from property_details.listing_events for pre-trigger history.
Tax reassessment forecast TX · Resets to sale price
- Current annual tax
- $6,164 · $514/mo
- Projected year-2 tax
- $6,164 · $514/mo
- Expected delta
- $0/yr ($0/mo · 0.0%)
ⓘ Screening estimate from a state-policy table — verify with the county assessor before closing.
Climate risk First Street
- Flood 1/10 Low FEMA zone X (unshaded) · 0% chance over 30 yrs
- Wildfire 4/10 Moderate
- Heat 9/10 Extreme 7 d/yr ≥111°F today · 26 d/yr by 30 yrs out
- Wind 8/10 Severe 99% chance of damaging wind over 30 yrs
- Air quality 3/10 Moderate 2 unhealthy d/yr today · 3 by 30 yrs out
Nearby sold comps map
Loading sold comps map…
Walkable amenities ~0.75 mi
Loading nearby amenities…
Taxation est. · year 1
- Rental income
- $25,579
- − Mortgage interest
- −$14,340
- − Property taxes
- −$6,164
- − Insurance
- −$1,280
- − Repairs & maintenance
- −$2,046
- − Management
- −$2,046
- − HOA
- −$408
- − Depreciation
- −$7,447
- Taxable loss
- −$8,152
- Est. tax savings @ 24.0%
- +$1,957
- After-tax cash flow
- $-1,797/yr
For passive investors: Depreciation is non-cash, so a rental often shows a tax loss while cash-flowing — sheltering income. Rental losses are passive: they offset passive income freely, and up to $25,000/yr can offset ordinary (W-2) income if you actively participate and your MAGI is under $100k (phasing out to $0 by $150k); unused losses carry forward. On sale, claimed depreciation is recaptured at up to 25%, and gains may owe capital-gains tax (a 1031 exchange can defer both). Figures are a year-1 estimate at your 24.0% rate — not tax advice; consult a CPA.
Schools (NCES district)
- District
- Conroe ISD
- NCES district ID
- 4815000
- Math proficiency
- 57% ▼ -6.00%
- Reading proficiency
- 57% ▼ -1.00%
- Median HH income
- $71,541
- Composite
- 50.65/100
- National rank
- #1833
- State rank
- #69 of 826 in TX
Livability — The Woodlands
- Score
- 91/100
- State rank
- #1
- US rank
- #47
Category grades
Schools grade is shown separately in the Schools card above.
Census & demographics
- County
- Montgomery County · 663,713 people
- City population
- 106,505
- Metro
- Houston-The Woodlands-Sugar Land, TX
- Population (ZIP)
- 28,156
- Household income
- $117,118
- Rent vs Own
- Severe rent burden
- 471.0
Population outlook (Montgomery County) Hauer SSP2
- Today (2025)
- 713,896 people
- By 2030
- 805,263 · +12.8%
- By 2040
- 992,708 · +39.1%
- By 2050
- 1,179,590 · +65.2%
- By 2075
- 1,628,084 · +128.1%
- By 2100
- 1,937,880 · +171.5%
Race, ethnicity, and origin ACS 2023
- Neighborhood character
- Diverse neighborhood (Simpson 0.63)
- Race & ethnicity
- White 53% Hispanic / Latino 27% Two or more races 16% Black 11% Asian 5%
- Hispanic origin (detail)
- Mexican 15% Puerto Rican 2% Cuban 1%
- Common ancestry
- Slovak 3% Romanian 2% Italian 2%
- Foreign-born
- 15% · Canada, Jamaica, Vietnam
- Languages at home
- 76% English-only · Spanish 16% Other Indo-European 2% Other Asian/Pacific 1%
Political lean MEDSL · Montgomery
- 2024 margin
- Solid R (+45.5) · D 26.8% · R 72.3%
- 2008→2024 swing
- +7.2pp toward D · 2008: -52.7pp · 2024: -45.5pp
- All cycles
- 2024: R+45.5 2020: R+43.8 2016: R+51.4 2012: R+60.7 2008: R+52.7
Not yet ingested
- Civics
- —
Market trends
- HPI YoY
- ▼ -91.09%
- Current HPI
- 239.9434
- Rent YoY
- ▲ 3.88%
- Metro
- Houston-The Woodlands-Sugar Land, TX
- State GDP YoY
- ▲ 3.95%
- F500 in state
- 110
Industry mix (Fortune 500 HQ in TX)
| Industry | F500 HQs | Revenue |
|---|---|---|
| Energy | 16 | $1,198B |
|
||
| Technology | 5 | $198B |
|
||
| Engineering / Construction | 4 | $72B |
|
||
| Energy Services | 3 | $60B |
|
||
| Utilities | 3 | $41B |
|
||
| Healthcare | 2 | $330B |
|
||
Price history
-1.5% since first listed3 events — show timeline
- 2026-04-30 Price Changed $256,000 HARMLS
- 2026-04-07 Listed $260,000 HARMLS
- 2026-03-27 Sold (Public Records) — Public Records
Property tax history
+3.7%/yrLatest (2025): $6,164 · +4.7% YoY. Source: county tax records.
Cash-flow waterfall
monthlySold comps — $/sqft
last 12 mo · ≤1 miLoading sold comps…