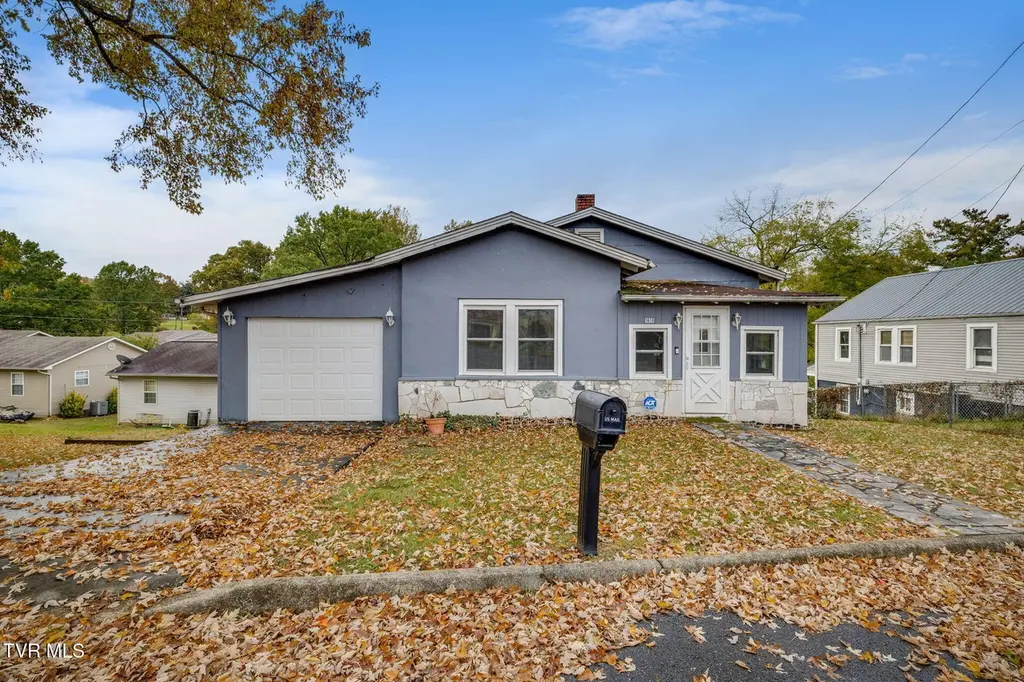
1614 Burgie St St · Elizabethton, TN
Flood risk 1/10 · Minimal
- FEMA flood zone
- X (unshaded)
- Chance of flooding over 30 yrs
- 0.0%
- Est. flood insurance / yr
- $473 – $860
Fire risk 4/10 · Minor
- Est. fire insurance / yr
- $949 – $1,763
Heat risk 5/10 · Moderate
- Hot days now (above 98°F)
- 7 days/yr
- Hot days in 30 yrs
- 21 days/yr
Wind risk 2/10 · Minimal
- Chance of severe wind over 30 yrs
- —
Air-quality risk 2/10 · Minimal
- Unhealthy air days now
- 1 days/yr
- Unhealthy air days in 30 yrs
- 1 days/yr
Risk factors via First Street. Map © Google.
Why this score? — see what drove the C- grade
The composite is a weighted blend of 9 inputs, each scored 0–100. Each bar is that input's sub-score; the figure is the points it added to the 100-point composite (weight × sub-score).
- Cash flow +15.7/30.0
- ARV discount +15.0/15.0
- DSCR +4.8/10.0
- 1% rule +3.3/10.0
- Livability +3.3/5.0
- Schools +2.9/10.0
- Rent growth +2.5/5.0
- Condition / age +2.5/5.0
- Appreciation +0.0/10.0
$172,000
🖨 Deal sheet 📄 Offer letter ✓ Due diligence
Listing remarks
Back on Market no fault of seller. LOCATION, LOCATION, LOCATION. Welcome to this charming 2-bedroom, 1-bath home filled with updates. Featuring two driveway entrances--one from the front and one from the back--plus a convenient one-car garage with a new garage door and opener accessible from the front. A beautifully refreshed main floor featuring newer windows, flooring, ceilings, and a fully remodeled bathroom with an updated sink, shower, shelving, and medicine cabinet. The kitchen shines with newer cabinets, counters, and cupboards, making it truly move-in ready. The second level offers incredible potential for a remodel, with plumbing already in place for an additional bathroom and sink
Key facts
- Newer cabinets
- Quiet cul-de-sac
- 6,670 sq ft lot
Tags
Property features AI
Exterior
- Parking: Carport with 1 space
- Utilities: Public water; Public sewer; Natural gas available; Electricity connected; Water connected
- Home design: Single-family residence; Two-story house; Entry level information not provided; Facing direction not provided
- Construction: Block and plaster construction; Composition shingle roof; Below-grade finished area present
- Exterior features: Sloped topography; Lot dimensions approximately 58 x 115; Zoned RES
Interior
- Bathrooms: 1 full bathroom; 1 half bathroom
- Heating & cooling: Central heating (electric); Central air conditioning
- Interior features: Double pane windows; Total of 5 rooms
Neighborhood map
What this means for you Summary
Snapshot
- This is a 2-bed/1.0-bath single-family listed at $172k.
Deal economics
- At list price, monthly cash flow is $76 ($917/yr) — positive.
- The deal already cash-flows at list — no discount required.
- To meet the 1% rule (rent ≥ 1% of price), the offer needs to be $143k (16.7% below list).
- Recommended offer: $143k (16.7% below list) — sets the bar for 1% rule.
- Cap rate 6.8% vs local median 3.7% in Elizabethton — top-decile yield for the area; either an underpriced asset or a hidden risk that comps aren't pricing in. Stress-test before assuming the spread holds.
Location & tenants
- Location reads 66/100 on livability (#121 in TN) — a middle-class / working-renter tenant base. Strengths: cost of living A+, housing A, crime A-; Watch: amenities F, commute F, employment F.
- Elizabethton (suburban): math 36% / reading 35% proficiency, ranked #35 of 139 in TN (top 25%) — families likely to look elsewhere, expect single-tenant / working-renter base with shorter leases.
- Zoned schools: West Side Elementary (math 52% / reading 57%, grade C, #92 of 952 statewide, top 10%, 371 students, 0% FRL); T A Dugger Junior High School (math 42% / reading 28%, grade F, #65 of 333 statewide, top 20%, 633 students, 0% FRL); Elizabethton High School (math 17% / reading 41%, grade F, #92 of 332 statewide, top 28%, 863 students, 0% FRL) — zoned schools average 0% FRL vs 43% district-wide (43 pts lower); this property's tenant base skews higher-income than the district average.
- Market conditions: 173 active listings in the ZIP; 4 comparable units currently listed for rent nearby; rentals leasing fast (median 13d on market — plan ~1-2 weeks tenant-placement turnaround); 184 units permitted in Carter County in 2024 (0 in 5+ unit buildings).
Forward outlook
- Local home prices are declining (-3.0%/yr); year-one equity from $1k of loan paydown is wiped out by about $5k of value loss. Plan a longer hold.
- Carter County population projected at -21% by 2050 — secular population decline; favor cash flow + early exit over multi-decade hold.
Negotiation context
- It's been on market 232 days — a 12% lower offer ($151k) is reasonable based on typical stale-listing flexibility.
- 2 sale attempts; this cycle's ask has dropped $18k (9%) from the opening price — seller is motivated, your offer sets the floor, not the list.
Risks & watch-outs
- Watch-outs: built in 1943 — expect roof / HVAC / electrical / plumbing capex.
- Climate carrying-cost: extreme-heat days projected 7→21/yr by 2055 (HVAC capex compounding) — expect insurance premiums to compound above CPI over the hold.
Questions for the listing agent
- It's been on market 232 days. Have you received any prior offers? Is the seller open to a 17% concession, seller financing, or rate buy-down credit?
- Built in 1943 — when were the roof, HVAC, electrical panel, plumbing, and water heater last replaced?
- Why hasn't it sold? Are there any deal-killer items the seller is aware of (foundation, flood, title, zoning, code violations)?
- Is there a deadline driving the sale (1031 exchange, divorce, estate, relocation)? That informs how much negotiation room exists.
- Schools are D-rated, which usually means shorter tenancies and higher turnover. Who's the typical renter profile here, and what's been the actual vacancy rate?
- What's the average days-on-market for RENTAL listings here right now (not sales)? A rising rental-DOM trend means longer vacancies and softer asking-rent achievability than the comps imply.
- What's the recent tenant-quality profile in this submarket — average credit score on applications, eviction rate, late-payment / NSF rate, and stable-employment percentage? A property-management company in the area should have these aggregated.
- How much new for-sale + rental construction is in the pipeline within 1–3 miles? Heavy new supply typically softens prices + rents 12–24 months out; constrained supply supports both.
Investment metrics
- 1% rule
- 0.83% ✗
- Cap rate
- 6.83%
- Cash-on-cash
- 1.90%
- DSCR
- 1.08
- GRM
- 10.0
CMA / ARV
- ARV (on-the-fly)
- $270,027
- Comps found
- 11
Show comp detail 11 sales within ~0.75 mi
| Address | Dist | Beds/Ba | Sqft | Sold | Price | $/sf | Match |
|---|---|---|---|---|---|---|---|
| 507 Division St | 0.37mi | 2/1.0 | 1,224 (-1%) | 19mo | $227,000 | $185 | 66 |
| 421 Field Rd | 0.31mi | 2/2.0 | 1,180 (-4%) | 15mo | $199,000 | $169 | 62 |
| 400 Carter Blvd Blvd | 0.42mi | 2/1.5 | 1,276 (+4%) | 16mo | $255,000 | $200 | 60 |
| 2013 Katelyn Dr | 0.65mi | 3/2.0 (+1) | 1,276 (+4%) | 0mo | $310,000 | $243 | 55 |
| 375 Pine Hill Rd | 0.46mi | 2/1.5 | 1,334 (+8%) | 10mo | $200,000 | $150 | 54 |
| 542 Division St | 0.53mi | 3/2.0 (+1) | 1,260 (+2%) | 21mo | $337,500 | $268 | 45 |
| 711 Parkway Blvd | 0.72mi | 3/2.0 (+1) | 1,334 (+8%) | 2mo | $317,500 | $238 | 42 |
| 169 Mays Rd | 0.60mi | 3/2.0 (+1) | 1,270 (+3%) | 20mo | $330,000 | $260 | 41 |
| 1752 Sylvan Hill Rd | 0.30mi | 3/2.0 (+1) | 1,112 (-10%) | 24mo | $257,900 | $232 | 41 |
| 1718 Field Rd | 0.36mi | 3/2.0 (+1) | 1,372 (+11%) | 22mo | $280,000 | $204 | 37 |
| 526 Jobe Rd | 0.48mi | 3/2.0 (+1) | 1,370 (+11%) | 20mo | $299,999 | $219 | 33 |
Match score weights: distance 35% · size 25% · config 20% · recency 20%. Top-matched comps best support the ARV.
Projected returns pro-forma
-3.0% appreciation · 3.0% rent growth · sell at horizon
- IRR
- -13.3%
- Equity multiple
- 0.52×
- Total profit
- $-23,066
- Equity at exit
- $25,646
- IRR
- -4.4%
- Equity multiple
- 0.71×
- Total profit
- $-14,065
- Equity at exit
- $14,871
Cash invested: $48,160 (down + closing). Projections, not guarantees.
Landlord ↔ Tenant lean methodology
- Overall (STATE)
- 87 Strongly Landlord-Friendly
- State Tennessee
- 87 Strongly Landlord-Friendly · R+13
- County
- — inherits STATE
- City
- — inherits STATE
ZIP-level market 37643
- Home prices YoY
- -19.3%
- Active inventory
- 173
- Price-to-rent
- 10.0×
Monthly cashflow live
- Estimated rent
- $1,432 medium interval (Pro) →
- Mortgage (P&I)
- −$902
- Tax from tax record
- −$82 /mo · $978/yr
- Insurance
- −$72
- HOA
- −$0
- Vacancy / Maint / Mgmt
- −$301
- Net cashflow
- $76
Break-even live
UW: 25.0% down · 7.5% · 30yr · 1.5% tax · 5.0% vac · 8.0% maint · 8.0% mgmt
Financing live
Cash to close
- Down payment
- $43,000
- Closing costs
- $5,160
- Reserves months
- —
- Total cash needed
- —
Loan-product check · same deal, 3 products live
Conventional
25% down · 7.5% · 30yr
- Down + closing
- —
- Monthly P&I
- —
- Monthly cashflow
- —
- DSCR
- —
- Eligible?
- —
Personal DTI + credit; lowest rate.
DSCR
20% down · 8.5% · 30yr
- Down + closing
- —
- Monthly P&I
- —
- Monthly cashflow
- —
- DSCR
- —
- Eligible?
- —
No personal income docs; deal must DSCR.
Hard money
10% down · 12.0% · 12mo
- Down + closing
- —
- Monthly P&I
- —
- Monthly cashflow
- —
- DSCR
- —
- Eligible?
- —
Short-term bridge; refi at stabilization.
Rent comps 4 comps
| Address | Beds | Baths | Sqft | Rent | $/sqft | DOM | Units | Dist |
|---|---|---|---|---|---|---|---|---|
| 600 Pine Hill Rd Elizabethton, TN | 2.0 | 1.0 | 1200 | $1,800 | $1.50 | 13d | 1 | 0.54mi |
| 537 Jena Beth Dr Unit 4 Elizabethton, TN | 2.0 | 1.0 | 720 | $875 | $1.22 | 20d | 1 | 0.92mi |
| 115 Towneview Estates Dr Unit 01 Elizabethton, TN | 2.0 | 1.0 | 830 | $1,000 | $1.20 | 13d | 1 | 1.05mi |
| 1541 Southside Rd Apt 4 Elizabethton, TN | 3.0 | 2.0 | 1300 | $1,398 | $1.08 | 13d | 1 | 1.30mi |
Listing history 24 events
-
2026-06-19days on market $172,000 Active 232 DOM
-
2026-06-18days on market $172,000 Active 231 DOM
-
2026-06-17days on market $172,000 Active 230 DOM
-
2026-06-16days on market $172,000 Active 229 DOM
-
2026-06-15days on market $172,000 Active 228 DOM
-
2026-06-14days on market $172,000 Active 226 DOM
-
2026-06-13days on market $172,000 Active 225 DOM
-
2026-06-10days on market $172,000 Active 223 DOM
-
2026-06-09days on market $172,000 Active 222 DOM
-
2026-06-08days on market $172,000 Active 221 DOM
-
2026-06-07days on market $172,000 Active 220 DOM
-
2026-06-05days on market $172,000 Active 217 DOM
-
2026-06-03days on market $172,000 Active 216 DOM
-
2026-06-02days on market $172,000 Active 215 DOM
-
2026-06-01days on market $172,000 Active 214 DOM
-
2026-05-31days on market $172,000 Active 213 DOM
-
2026-05-30days on market $172,000 Active 212 DOM
-
2026-05-09price $172,000
-
2026-04-30status Active
-
2026-04-22historical Active Under Contract
-
2026-04-02price $175,000
-
2026-02-18price $179,500
-
2026-01-15price $187,000
-
2025-10-30$190,000 Active
ⓘ Source: listings_history table (triggers on properties + properties_extension) + one-shot
backfill from property_details.listing_events for pre-trigger history.
Tax reassessment forecast TN · Resets to sale price
- Current annual tax
- $978 · $82/mo
- Projected year-2 tax
- $1,221 · $102/mo
- Expected delta
- +$243/yr (+$20/mo · 24.9%)
ⓘ Screening estimate from a state-policy table — verify with the county assessor before closing.
Climate risk First Street
- Flood 1/10 Low FEMA zone X (unshaded) · 0% chance over 30 yrs
- Wildfire 4/10 Moderate
- Heat 5/10 Major 7 d/yr ≥98°F today · 21 d/yr by 30 yrs out
- Wind 2/10 Low
- Air quality 2/10 Low 1 unhealthy d/yr today · 1 by 30 yrs out
Nearby sold comps map
Loading sold comps map…
Walkable amenities ~0.75 mi
Loading nearby amenities…
Taxation est. · year 1
- Rental income
- $17,188
- − Mortgage interest
- −$9,635
- − Property taxes
- −$978
- − Insurance
- −$860
- − Repairs & maintenance
- −$1,375
- − Management
- −$1,375
- − Depreciation
- −$5,004
- Taxable loss
- −$2,038
- Est. tax savings @ 24.0%
- +$489
- After-tax cash flow
- $1,406/yr
For passive investors: Depreciation is non-cash, so a rental often shows a tax loss while cash-flowing — sheltering income. Rental losses are passive: they offset passive income freely, and up to $25,000/yr can offset ordinary (W-2) income if you actively participate and your MAGI is under $100k (phasing out to $0 by $150k); unused losses carry forward. On sale, claimed depreciation is recaptured at up to 25%, and gains may owe capital-gains tax (a 1031 exchange can defer both). Figures are a year-1 estimate at your 24.0% rate — not tax advice; consult a CPA.
Schools (NCES district)
- District
- Elizabethton
- NCES district ID
- 4701110
- Math proficiency
- 36% ▼ -12.00%
- Reading proficiency
- 35% ▼ -8.00%
- Median HH income
- $30,800
- Composite
- 28.94/100
- National rank
- #6630
- State rank
- #35 of 139 in TN
Livability — Elizabethton
- Score
- 66/100
- State rank
- #121
- US rank
- #11785
Category grades
Schools grade is shown separately in the Schools card above.
Census & demographics
- Census place
- Elizabethton, TN
- City population
- 513
- Population (ZIP)
- 33,690
Population outlook (Carter County) Hauer SSP2
- Today (2025)
- 54,493 people
- By 2030
- 52,639 · -3.4%
- By 2040
- 47,929 · -12.0%
- By 2050
- 42,877 · -21.3%
- By 2075
- 31,487 · -42.2%
- By 2100
- 21,979 · -59.7%
Race, ethnicity, and origin ACS 2023
- Neighborhood character
- Predominantly White (93%)
- Race & ethnicity
- White 93% Two or more races 3% Hispanic / Latino 3% Black 2%
- Common ancestry
- Serbian 3% Slovak 2% Italian 2%
- Foreign-born
- 2% · Canada
- Languages at home
- 98% English-only · Spanish 2%
Political lean MEDSL · Carter
- 2024 margin
- Solid R (+63.2) · D 17.9% · R 81.2%
- 2008→2024 swing
- -16.1pp toward R · 2008: -47.2pp · 2024: -63.2pp
- All cycles
- 2024: R+63.2 2020: R+61.5 2016: R+64.0 2012: R+52.0 2008: R+47.2
Not yet ingested
- Civics
- —
Market trends
- HPI YoY
- ▼ -77.08%
- Current HPI
- 321.4024
- Rent YoY
- —
- Metro
- —
- State GDP YoY
- ▲ 2.78%
- F500 in state
- 22
Industry mix (Fortune 500 HQ in TN)
| Industry | F500 HQs | Revenue |
|---|---|---|
| Healthcare | 3 | $91B |
|
||
| Retail | 3 | $72B |
|
||
| Transportation / Logistics | 1 | $88B |
|
||
| Paper / Packaging | 1 | $19B |
|
||
| Insurance | 1 | $13B |
|
||
| Energy | 1 | $12B |
|
||
Price history
-9.5% since first listed7 events — show timeline
- 2026-05-09 Price Changed $172,000 TVRMLS
- 2026-04-30 Relisted — TVRMLS
- 2026-04-22 Contingent — TVRMLS
- 2026-04-02 Price Changed $175,000 TVRMLS
- 2026-02-18 Price Changed $179,500 TVRMLS
- 2026-01-15 Price Changed $187,000 TVRMLS
- 2025-10-30 Listed $190,000 TVRMLS
Property tax history
+1.5%/yrLatest (2025): $978 · +2.3% YoY. Source: county tax records.
Cash-flow waterfall
monthlySold comps — $/sqft
last 12 mo · ≤1 miLoading sold comps…