 Multi-family
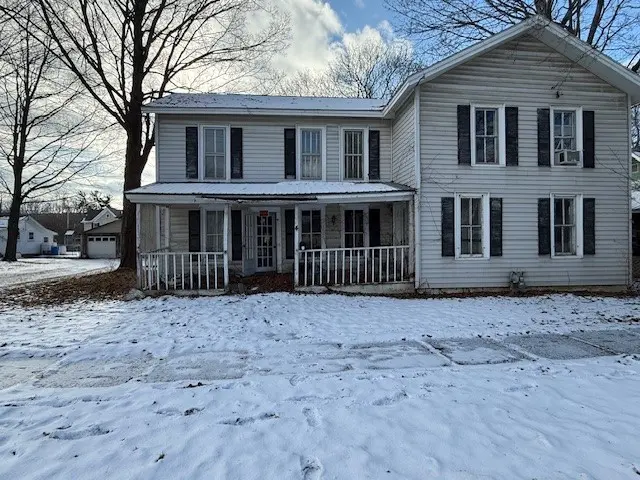
4 Trianna St · Belmont, NY
Flood risk 1/10 · Minimal
- FEMA flood zone
- X
- Chance of flooding over 30 yrs
- 0.0%
- Est. flood insurance / yr
- $473 – $860
Fire risk 3/10 · Minor
- Est. fire insurance / yr
- $691 – $1,283
Heat risk 2/10 · Minimal
- Hot days now (above 90°F)
- 7 days/yr
- Hot days in 30 yrs
- 18 days/yr
Wind risk 1/10 · Minimal
- Chance of severe wind over 30 yrs
- —
Air-quality risk 1/10 · Minimal
- Unhealthy air days now
- 0 days/yr
- Unhealthy air days in 30 yrs
- 0 days/yr
Risk factors via First Street. Map © Google.
Why this score? — see what drove the B+ grade
The composite is a weighted blend of 9 inputs, each scored 0–100. Each bar is that input's sub-score; the figure is the points it added to the 100-point composite (weight × sub-score).
- Cash flow +23.5/30.0
- ARV discount +15.0/15.0
- Appreciation +8.4/10.0
- 1% rule +7.9/10.0
- DSCR +7.6/10.0
- Schools +4.5/10.0
- Livability +3.6/5.0
- Rent growth +2.5/5.0
- Condition / age +2.5/5.0
$100,000
🖨 Deal sheet 📄 Offer letter ✓ Due diligence
Multi-family units
County records classify this as Multi-Family (2-4 Unit). Listing-text estimate: 1 unit. estimate disagrees with records
Listing remarks MLS
An Old House Waiting to be loved again. This house stands quietly on the edge of town. Time has weathered its surfaces and softened it edge, but it has not diminished it dignity. this old-style house was built for permanence solid craftmanship. As you walk in your greeted with high ceilings and very spacious large rooms with hardwoods french doors and a gas fireplace complete with a luxurious wood mantel that creates a fresh modern focal point on the first floor. This house has a full first floor bathroom with a possible first floor bedroom for complete ranch style living on the first floor if one chooses. Upstairs we have a large hallway foyer with a full Bath and two full bedrooms and a possible 3rd bedroom that is off the second bedroom upstairs.
Key facts
- Wood mantel
- Hardwoods
- French doors
Tags
Neighborhood map
What this means for you Summary
Snapshot
- This is a 3-bed/2.5-bath multifamily listed at $100k.
Deal economics
- At list price, monthly cash flow is $187 ($2k/yr) — positive.
- The deal already cash-flows at list — no discount required.
- Meets the 1% rule at list price ($1k rent vs $100k).
- Recommended offer: $88k (12.0% below list) — sets the bar for market timing.
Location & tenants
- Location reads 71/100 on livability (#401 in NY) — a middle-class / working-renter tenant base. Strengths: cost of living A+, housing A+, health & safety A+; Watch: crime F, amenities F, commute F.
- Genesee Valley Central School District (rural): math 52% / reading 50% proficiency, ranked #453 of 755 in NY (top 60%) — acceptable for families but not a draw, mixed tenant base, ~2y average lease.
- Market conditions: 19 active listings in the ZIP; 87 units permitted in Allegany County in 2024 (0 in 5+ unit buildings).
Forward outlook
- In year one you build about $7k of equity ($691 loan paydown + $7k appreciation (6.8% local appreciation)).
- Allegany County population projected at -26% by 2050 — secular population decline; favor cash flow + early exit over multi-decade hold.
- At projected returns (6.8% appreciation + 3.0% rent growth), your $28k cash investment doubles in ~3 years — after that, you're playing with house money.
- By year 5, paydown + projected appreciation supports a ~$33k cash-out refi (75% LTV) — recoverable capital for the next deal without selling this one.
Negotiation context
- It's been on market 148 days — a 12% lower offer ($88k) is reasonable based on typical stale-listing flexibility.
- Current owner paid $35k; list at $100k implies a 183% gain — meaningful room to come down on a strong offer.
Risks & watch-outs
- Watch-outs: property tax is 3.2% of price; built in 1900 — expect roof / HVAC / electrical / plumbing capex.
Questions for the listing agent
- It's been on market 148 days. Have you received any prior offers? Is the seller open to a 12% concession, seller financing, or rate buy-down credit?
- Built in 1900 — when were the roof, HVAC, electrical panel, plumbing, and water heater last replaced?
- Property tax is high relative to price — has the assessment been appealed recently, and will the sale trigger a re-assessment?
- Why hasn't it sold? Are there any deal-killer items the seller is aware of (foundation, flood, title, zoning, code violations)?
- Is there a deadline driving the sale (1031 exchange, divorce, estate, relocation)? That informs how much negotiation room exists.
- Crime grade is F in this area — have there been break-ins, vandalism, or insurance claims at this property in the last 3 years? What carrier currently insures it and at what premium?
- What's the average days-on-market for RENTAL listings here right now (not sales)? A rising rental-DOM trend means longer vacancies and softer asking-rent achievability than the comps imply.
- What's the recent tenant-quality profile in this submarket — average credit score on applications, eviction rate, late-payment / NSF rate, and stable-employment percentage? A property-management company in the area should have these aggregated.
- How much new apartment / multifamily construction is in the pipeline within 1–3 miles? Heavy new supply (>2% of stock underway) typically softens rents 12–24 months out; light construction supports rent growth.
Investment metrics
- 1% rule
- 1.29% ✓
- Cap rate
- 8.54%
- Cash-on-cash
- 8.02%
- DSCR
- 1.36
- GRM
- 6.5
CMA / ARV
- ARV (median comp)
- $166,749
- List price
- $100,000
- Delta
- -40.03%
- Verdict
- UNDERPRICED
- Comps
- 12 within 1.0 mi
Projected returns pro-forma
6.77% appreciation · 3.0% rent growth · sell at horizon
- IRR
- 23.7%
- Equity multiple
- 2.63×
- Total profit
- $45,534
- Equity at exit
- $67,789
- IRR
- 22.1%
- Equity multiple
- 5.42×
- Total profit
- $123,809
- Equity at exit
- $127,426
Cash invested: $28,000 (down + closing). Projections, not guarantees.
Landlord ↔ Tenant lean methodology
- Overall (STATE)
- 15 Strongly Tenant-Friendly
- State New York
- 15 Strongly Tenant-Friendly · D+10
- County
- — inherits STATE
- City
- — inherits STATE
ZIP-level market 14813
- Home prices YoY
- 2.6%
- Active inventory
- 19
- Price-to-rent
- 6.5×
Monthly cashflow live
- Estimated rent
- $1,291 medium interval (Pro) →
- Mortgage (P&I)
- −$524
- Tax from tax record
- −$267 /mo · $3,203/yr
- Insurance
- −$42
- HOA
- −$0
- Vacancy / Maint / Mgmt
- −$271
- Net cashflow
- $187
Break-even live
UW: 25.0% down · 7.5% · 30yr · 1.5% tax · 5.0% vac · 8.0% maint · 8.0% mgmt
Financing live
Cash to close
- Down payment
- $25,000
- Closing costs
- $3,000
- Reserves months
- —
- Total cash needed
- —
Loan-product check · same deal, 3 products live
Conventional
25% down · 7.5% · 30yr
- Down + closing
- —
- Monthly P&I
- —
- Monthly cashflow
- —
- DSCR
- —
- Eligible?
- —
Personal DTI + credit; lowest rate.
DSCR
20% down · 8.5% · 30yr
- Down + closing
- —
- Monthly P&I
- —
- Monthly cashflow
- —
- DSCR
- —
- Eligible?
- —
No personal income docs; deal must DSCR.
Hard money
10% down · 12.0% · 12mo
- Down + closing
- —
- Monthly P&I
- —
- Monthly cashflow
- —
- DSCR
- —
- Eligible?
- —
Short-term bridge; refi at stabilization.
Listing history 17 events
-
2026-06-18days on market $100,000 Active 148 DOM
-
2026-06-17days on market $100,000 Active 147 DOM
-
2026-06-16days on market $100,000 Active 146 DOM
-
2026-06-15days on market $100,000 Active 145 DOM
-
2026-06-13days on market $100,000 Active 143 DOM
-
2026-06-12days on market $100,000 Active 142 DOM
-
2026-06-09days on market $100,000 Active 139 DOM
-
2026-06-08days on market $100,000 Active 138 DOM
-
2026-06-07days on market $100,000 Active 137 DOM
-
2026-06-05days on market $100,000 Active 135 DOM
-
2026-06-04days on market $100,000 Active 133 DOM
-
2026-06-02days on market $100,000 Active 132 DOM
-
2026-06-01days on market $100,000 Active 131 DOM
-
2026-05-31days on market $100,000 Active 130 DOM
-
2026-01-20$100,000 Active 762-char remark
Show marketing remark (762 chars)
An Old House Waiting to be loved again. This house stands quietly on the edge of town. Time has weathered its surfaces and softened it edge, but it has not diminished it dignity. this old-style house was built for permanence solid craftmanship. As you walk in your greeted with high ceilings and very spacious large rooms with hardwoods french doors and a gas fireplace complete with a luxurious wood mantel that creates a fresh modern focal point on the first floor. This house has a full first floor bathroom with a possible first floor bedroom for complete ranch style living on the first floor if one chooses. Upstairs we have a large hallway foyer with a full Bath and two full bedrooms and a possible 3rd bedroom that is off the second bedroom upstairs.
-
2025-11-18soldstatus $35,300
-
2011-12-05soldstatus $42,900
ⓘ Source: listings_history table (triggers on properties + properties_extension) + one-shot
backfill from property_details.listing_events for pre-trigger history.
Tax reassessment forecast NY · Partial reset (capped growth)
- Current annual tax
- $3,203 · $267/mo
- Projected year-2 tax
- $3,203 · $267/mo
- Expected delta
- $0/yr ($0/mo · 0.0%)
ⓘ Screening estimate from a state-policy table — verify with the county assessor before closing.
Climate risk First Street
- Flood 1/10 Low FEMA zone X · 0% chance over 30 yrs
- Wildfire 3/10 Moderate
- Heat 2/10 Low 7 d/yr ≥90°F today · 18 d/yr by 30 yrs out
- Wind 1/10 Low
- Air quality 1/10 Low 0 unhealthy d/yr today · 0 by 30 yrs out
Nearby sold comps map
Loading sold comps map…
Walkable amenities ~0.75 mi
Loading nearby amenities…
Taxation est. · year 1
- Rental income
- $15,497
- − Mortgage interest
- −$5,602
- − Property taxes
- −$3,203
- − Insurance
- −$500
- − Repairs & maintenance
- −$1,240
- − Management
- −$1,240
- − Depreciation
- −$2,909
- Taxable income
- $804
- Est. tax owed @ 24.0%
- −$193
- After-tax cash flow
- $2,054/yr
For passive investors: Depreciation is non-cash, so a rental often shows a tax loss while cash-flowing — sheltering income. Rental losses are passive: they offset passive income freely, and up to $25,000/yr can offset ordinary (W-2) income if you actively participate and your MAGI is under $100k (phasing out to $0 by $150k); unused losses carry forward. On sale, claimed depreciation is recaptured at up to 25%, and gains may owe capital-gains tax (a 1031 exchange can defer both). Figures are a year-1 estimate at your 24.0% rate — not tax advice; consult a CPA.
Schools (NCES district)
- District
- Genesee Valley Central School District
- NCES district ID
- 3600017
- Math proficiency
- 52% ▲ 5.00%
- Reading proficiency
- 50% ▲ 1.00%
- Median HH income
- $43,704
- Composite
- 45.0/100
- National rank
- #5858
- State rank
- #453 of 755 in NY
Livability — Belmont
- Score
- 71/100
- State rank
- #401
- US rank
- #6959
Category grades
Schools grade is shown separately in the Schools card above.
Census & demographics
- Census place
- Belmont, NY
- Population (ZIP)
- 2,465
Population outlook (Allegany County) Hauer SSP2
- Today (2025)
- 45,362 people
- By 2030
- 43,078 · -5.0%
- By 2040
- 38,031 · -16.2%
- By 2050
- 33,634 · -25.9%
- By 2075
- 25,285 · -44.3%
- By 2100
- 18,902 · -58.3%
Race, ethnicity, and origin ACS 2023
- Neighborhood character
- Predominantly White (97%)
- Race & ethnicity
- White 97% Black 2%
- Common ancestry
- Lithuanian 4% Romanian 4% Slovak 2%
- Foreign-born
- 0%
Political lean MEDSL · Allegany
- 2024 margin
- Solid R (+43.2) · D 28.4% · R 71.6%
- 2008→2024 swing
- -21.5pp toward R · 2008: -21.7pp · 2024: -43.2pp
- All cycles
- 2024: R+43.2 2020: R+38.9 2016: R+42.3 2012: R+25.3 2008: R+21.7
Not yet ingested
- Civics
- —
Market trends
- HPI YoY
- ▲ 6.77%
- Current HPI
- 271.7193
- Rent YoY
- —
- Metro
- —
- State GDP YoY
- ▲ 2.60%
- F500 in state
- 92
Industry mix (Fortune 500 HQ in NY)
| Industry | F500 HQs | Revenue |
|---|---|---|
| Financial Services | 10 | $950B |
|
||
| Consumer Goods | 9 | $162B |
|
||
| Insurance | 4 | $225B |
|
||
| Telecommunications | 2 | $144B |
|
||
| Pharmaceuticals | 2 | $112B |
|
||
| Media / Entertainment | 2 | $69B |
|
||
Price history
+133.1% since first listed3 events — show timeline
- 2026-01-20 Listed $100,000 UNYREIS
- 2025-11-18 Sold (Public Records) $35,300 Public Records
- 2011-12-05 Sold (Public Records) $42,900 Public Records
Property tax history
+3.6%/yrLatest (2025): $3,203 · +0.6% YoY. Source: county tax records.
Cash-flow waterfall
monthlySold comps — $/sqft
last 12 mo · ≤1 miLoading sold comps…