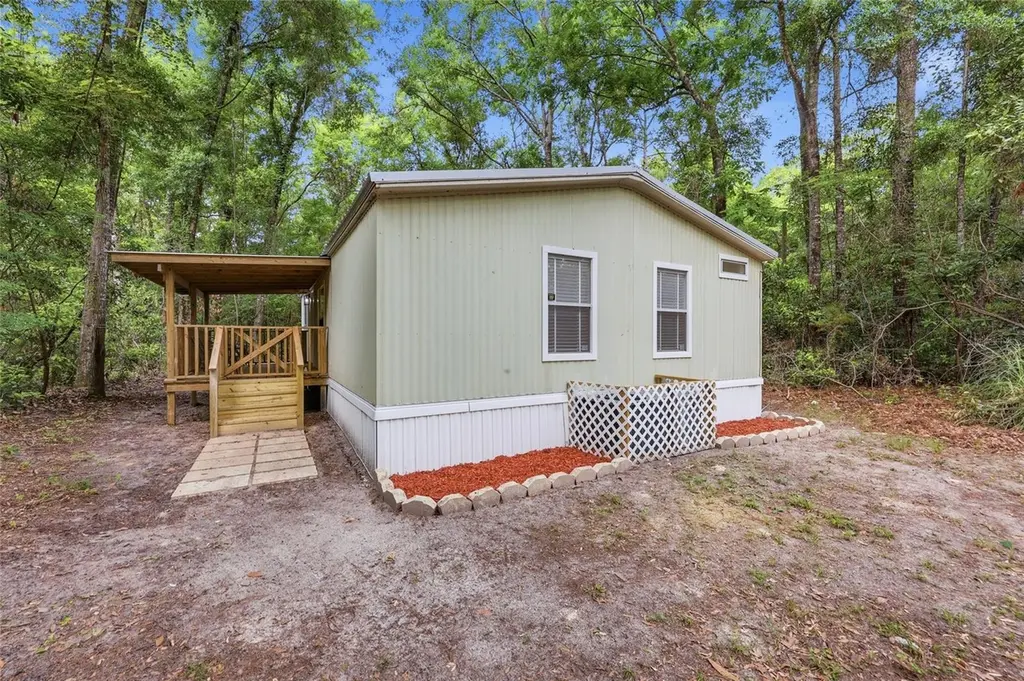
264 SW Central Ter · Fort White, FL
Flood risk 1/10 · Minimal
- FEMA flood zone
- X (unshaded)
- Chance of flooding over 30 yrs
- 0.0%
- Est. flood insurance / yr
- $507 – $1,088
Fire risk 6/10 · Moderate
- Est. fire insurance / yr
- $947 – $1,759
Heat risk 8/10 · Major
- Hot days now (above 108°F)
- 7 days/yr
- Hot days in 30 yrs
- 20 days/yr
Wind risk 9/10 · Severe
- Chance of severe wind over 30 yrs
- 99.0%
Air-quality risk 3/10 · Minor
- Unhealthy air days now
- 3 days/yr
- Unhealthy air days in 30 yrs
- 3 days/yr
Risk factors via First Street. Map © Google.
Why this score? — see what drove the C- grade
The composite is a weighted blend of 9 inputs, each scored 0–100. Each bar is that input's sub-score; the figure is the points it added to the 100-point composite (weight × sub-score).
- Cash flow +18.2/30.0
- Appreciation +10.0/10.0
- DSCR +5.7/10.0
- Schools +4.5/10.0
- 1% rule +3.7/10.0
- Livability +3.5/5.0
- Rent growth +2.5/5.0
- Condition / age +2.5/5.0
- ARV discount +1.8/15.0
$168,000
🖨 Deal sheet (PDF) 📄 Offer letter ✓ Due diligence
Listing remarks
Tucked away on a heavily wooded and private lot in the highly sought-after Three Rivers Estates community, this completely renovated 2BR/2BA doublewide on almost an acre offers the perfect blend of modern updates and North Florida outdoor living. Practically everything in the home is brand new, including a new roof, new flooring, fresh interior paint, new cabinets, granite countertops, stainless steel appliances, updated fixtures, and more—making this property truly move-in ready. Surrounded by mature trees for added privacy and shade, the property also features a nice metal shed for additional storage, tools, or outdoor equipment. Whether you’re looking for a full-time residenc
Key facts
- Private lot
- Heavily wooded lot
- New flooring
Tags
Property features AI
Finance
- Other: Total acreage about 1/2 to less than 1 (0.92 acres)
- HOA & community: Part of Three Rivers Estates; HOA required — $175 annually (about $14.58/month); Pets allowed
Exterior
- Utilities: Well water; Septic tank; High-speed internet available
- Home design: Manufactured double-wide home; One level; Faces south
- Construction: Vinyl siding; Metal roof; Crawlspace foundation
- Exterior features: Other exterior features; Dirt road access
Interior
- Kitchen: Range; Refrigerator; Dishwasher
- Bedrooms: 2 bedrooms
- Bathrooms: 2 full bathrooms
- Heating & cooling: Central heating; Central air conditioning
- Interior features: Other interior features
- Laundry & utility: Laundry room; Washer; Dryer
Neighborhood map
What this means for you Summary
Snapshot
- This is a 3-bed/2.0-bath manufactured listed at $168k.
Deal economics
- At list price, monthly cash flow is $152 ($2k/yr) — positive.
- The deal already cash-flows at list — no discount required.
- To meet the 1% rule (rent ≥ 1% of price), the offer needs to be $147k (12.8% below list).
- Recommended offer: $147k (12.8% below list) — sets the bar for 1% rule.
- Cap rate 7.4% vs local median 3.1% in Fort White — top-decile yield for the area; either an underpriced asset or a hidden risk that comps aren't pricing in. Stress-test before assuming the spread holds.
Location & tenants
- Location reads 69/100 on livability (#463 in FL) — a middle-class / working-renter tenant base. Strengths: cost of living A+, health & safety A+, housing A-; Watch: employment D, amenities F, commute F.
- Columbia (town): math 53% / reading 54% proficiency, ranked #25 of 73 in FL (top 34%) — acceptable for families but not a draw, mixed tenant base, ~2y average lease.
- Market conditions: 111 active listings in the ZIP; 178 units permitted in Columbia County in 2024 (0 in 5+ unit buildings).
Forward outlook
- In year one you build about $18k of equity ($1k loan paydown + $17k appreciation (10.0% local appreciation)).
- Columbia County population projected to shrink 7% by 2050 — rents likely to lag national; underwrite the cash flow, not the appreciation.
- At projected returns (10.0% appreciation + 3.0% rent growth), your $47k cash investment doubles in ~3 years — after that, you're playing with house money.
- By year 3, paydown + projected appreciation supports a ~$45k cash-out refi (75% LTV) — recoverable capital for the next deal without selling this one.
Negotiation context
- It's been on market 40 days — a 3% lower offer ($163k) is reasonable based on typical stale-listing flexibility.
Risks & watch-outs
- Climate carrying-cost: severe wind risk, 99% chance of damaging wind over 30y; major wildfire risk; extreme-heat days projected 7→20/yr by 2055 (HVAC capex compounding) — expect insurance premiums to compound above CPI over the hold.
Questions for the listing agent
- It's been on market 40 days. Have you received any prior offers? Is the seller open to a 13% concession, seller financing, or rate buy-down credit?
- What does the HOA fee cover, when was the last increase, and are there any pending special assessments or reserve-fund shortfalls?
- Is there a deadline driving the sale (1031 exchange, divorce, estate, relocation)? That informs how much negotiation room exists.
- Schools are B-rated — typically a magnet for longer-tenancy family renters. What's the average tenant stay here, and is there a school-zone premium baked into asking?
- What's the average days-on-market for RENTAL listings here right now (not sales)? A rising rental-DOM trend means longer vacancies and softer asking-rent achievability than the comps imply.
- What's the recent tenant-quality profile in this submarket — average credit score on applications, eviction rate, late-payment / NSF rate, and stable-employment percentage? A property-management company in the area should have these aggregated.
- How much new for-sale + rental construction is in the pipeline within 1–3 miles? Heavy new supply typically softens prices + rents 12–24 months out; constrained supply supports both.
Investment metrics
- 1% rule
- 0.87% ✗
- Cap rate
- 7.38%
- Cash-on-cash
- 3.87%
- DSCR
- 1.17
- GRM
- 9.6
CMA / ARV
- ARV (on-the-fly)
- $149,040
- Comps found
- 1
Show comp detail 1 sale within ~0.75 mi
| Address | Dist | Beds/Ba | Sqft | Sold | Price | $/sf | Match |
|---|---|---|---|---|---|---|---|
| 383 SW Delaware Way | 0.57mi | 2/2.0 (-1) | 853 (-7%) | 12mo | $138,000 | $162 | 46 |
Match score weights: distance 35% · size 25% · config 20% · recency 20%. Top-matched comps best support the ARV.
Projected returns pro-forma
10.0% appreciation · 3.0% rent growth · sell at horizon
- IRR
- 27.1%
- Equity multiple
- 3.15×
- Total profit
- $101,077
- Equity at exit
- $151,348
- IRR
- 23.6%
- Equity multiple
- 7.16×
- Total profit
- $289,920
- Equity at exit
- $326,387
Cash invested: $47,040 (down + closing). Projections, not guarantees.
Landlord ↔ Tenant lean methodology
- Overall (STATE)
- 87 Strongly Landlord-Friendly
- State Florida
- 87 Strongly Landlord-Friendly · R+3
- County
- — inherits STATE
- City
- — inherits STATE
ZIP-level market 32038
- Home prices YoY
- 17.7%
- Active inventory
- 111
- Price-to-rent
- 9.6×
Monthly cashflow live
- Estimated rent
- $1,465 medium interval (Pro) →
- Mortgage (P&I)
- −$881
- Tax from tax record
- −$41 /mo · $494/yr
- Insurance
- −$70
- HOA
- −$14
- Vacancy / Maint / Mgmt
- −$308
- Net cashflow
- $152
Break-even live
Sensitivity live
| Price | -10% $247 | -5% $199 | +0% $152 | +5% $104 | +10% $56 |
|---|---|---|---|---|---|
| Rent | -10% $36 | -5% $94 | +0% $152 | +5% $209 | +10% $267 |
| Rate | -1.0pp $236 | -0.5pp $194 | base $152 | +0.5pp $108 | +1.0pp $64 |
UW: 25.0% down · 7.5% · 30yr · 1.5% tax · 5.0% vac · 8.0% maint · 8.0% mgmt
Financing live
Cash to close
- Down payment
- $42,000
- Closing costs
- $5,040
- Reserves months
- —
- Total cash needed
- —
Loan-product check · same deal, 3 products live
Conventional
25% down · 7.5% · 30yr
- Down + closing
- —
- Monthly P&I
- —
- Monthly cashflow
- —
- DSCR
- —
- Eligible?
- —
Personal DTI + credit; lowest rate.
DSCR
20% down · 8.5% · 30yr
- Down + closing
- —
- Monthly P&I
- —
- Monthly cashflow
- —
- DSCR
- —
- Eligible?
- —
No personal income docs; deal must DSCR.
Hard money
10% down · 12.0% · 12mo
- Down + closing
- —
- Monthly P&I
- —
- Monthly cashflow
- —
- DSCR
- —
- Eligible?
- —
Short-term bridge; refi at stabilization.
HOA detail
- Monthly dues
- $14 · $168/yr
Listing history 18 events
-
2026-06-21days on market $168,000 Active 40 DOM
-
2026-06-19days on market $168,000 Active 38 DOM
-
2026-06-18days on market $168,000 Active 37 DOM
-
2026-06-17days on market $168,000 Active 36 DOM
-
2026-06-16days on market $168,000 Active 35 DOM
-
2026-06-15days on market $168,000 Active 34 DOM
-
2026-06-14days on market $168,000 Active 32 DOM
-
2026-06-12days on market $168,000 Active 31 DOM
-
2026-06-09days on market $168,000 Active 28 DOM
-
2026-06-08days on market $168,000 Active 27 DOM
-
2026-06-07days on market $168,000 Active 26 DOM
-
2026-06-05days on market $168,000 Active 23 DOM
-
2026-06-03days on market $168,000 Active 22 DOM
-
2026-06-02days on market $168,000 Active 21 DOM
-
2026-06-01days on market $168,000 Active 20 DOM
-
2026-05-31days on market $168,000 Active 19 DOM
-
2026-05-30days on market $168,000 Active 18 DOM
-
2026-05-12$168,000 Active
ⓘ Source: listings_history table (triggers on properties + properties_extension) + one-shot
backfill from property_details.listing_events for pre-trigger history.
Tax reassessment forecast FL · Resets to sale price
- Current annual tax
- $494 · $41/mo
- Projected year-2 tax
- $1,394 · $116/mo
- Expected delta
- +$901/yr (+$75/mo · 182.5%)
ⓘ Screening estimate from a state-policy table — verify with the county assessor before closing.
Climate risk First Street
- Flood 1/10 Low FEMA zone X (unshaded) · 0% chance over 30 yrs
- Wildfire 6/10 Major
- Heat 8/10 Severe 7 d/yr ≥108°F today · 20 d/yr by 30 yrs out
- Wind 9/10 Extreme 99% chance of damaging wind over 30 yrs
- Air quality 3/10 Moderate 3 unhealthy d/yr today · 3 by 30 yrs out
Nearby sold comps map
Loading sold comps map…
Walkable amenities ~0.75 mi
Loading nearby amenities…
Taxation est. · year 1
- Rental income
- $17,585
- − Mortgage interest
- −$9,411
- − Property taxes
- −$494
- − Insurance
- −$840
- − Repairs & maintenance
- −$1,407
- − Management
- −$1,407
- − HOA
- −$168
- − Depreciation
- −$4,887
- Taxable loss
- −$1,028
- Est. tax savings @ 24.0%
- +$247
- After-tax cash flow
- $2,065/yr
For passive investors: Depreciation is non-cash, so a rental often shows a tax loss while cash-flowing — sheltering income. Rental losses are passive: they offset passive income freely, and up to $25,000/yr can offset ordinary (W-2) income if you actively participate and your MAGI is under $100k (phasing out to $0 by $150k); unused losses carry forward. On sale, claimed depreciation is recaptured at up to 25%, and gains may owe capital-gains tax (a 1031 exchange can defer both). Figures are a year-1 estimate at your 24.0% rate — not tax advice; consult a CPA.
Schools (NCES district)
- District
- Columbia
- NCES district ID
- 1200360
- Math proficiency
- 53% ▼ -10.00%
- Reading proficiency
- 54% ▼ -3.00%
- Median HH income
- $40,053
- Composite
- 44.74/100
- National rank
- #2750
- State rank
- #25 of 73 in FL
Livability — Fort White
- Score
- 69/100
- State rank
- #463
- US rank
- #8360
Category grades
Schools grade is shown separately in the Schools card above.
Census & demographics
- Population (ZIP)
- 10,035
Population outlook (Columbia County) Hauer SSP2
- Today (2025)
- 68,129 people
- By 2030
- 67,501 · -0.9%
- By 2040
- 65,465 · -3.9%
- By 2050
- 63,058 · -7.4%
- By 2075
- 56,291 · -17.4%
- By 2100
- 45,243 · -33.6%
Race, ethnicity, and origin ACS 2023
- Neighborhood character
- Predominantly White (83%)
- Race & ethnicity
- White 83% Two or more races 8% Hispanic / Latino 7% Black 6%
- Hispanic origin (detail)
- Puerto Rican 3%
- Common ancestry
- Lithuanian 4% Italian 2% Slovak 2%
- Foreign-born
- 4% · Canada, South Korea
- Languages at home
- 94% English-only · Spanish 5%
Political lean MEDSL · Columbia
- 2024 margin
- Solid R (+50.2) · D 24.6% · R 74.7%
- 2008→2024 swing
- -16.4pp toward R · 2008: -33.8pp · 2024: -50.2pp
- All cycles
- 2024: R+50.2 2020: R+45.2 2016: R+44.5 2012: R+36.7 2008: R+33.8
Not yet ingested
- Civics
- —
Market trends
- HPI YoY
- ▲ 57.72%
- Current HPI
- 384.5816
- Rent YoY
- —
- Metro
- —
- State GDP YoY
- ▲ 3.28%
- F500 in state
- 36
Industry mix (Fortune 500 HQ in FL)
| Industry | F500 HQs | Revenue |
|---|---|---|
| Industrial Technology | 2 | $29B |
|
||
| Insurance | 2 | $17B |
|
||
| Retail | 1 | $60B |
|
||
| Technology Distribution | 1 | $58B |
|
||
| Homebuilding | 1 | $35B |
|
||
| Technology Manufacturing | 1 | $35B |
|
||
Price history
1 event — show timeline
- 2026-05-12 Listed $168,000 Stellar MLS as Distributed by MLS Grid
Property tax history
+0.2%/yrLatest (2025): $494 · +0.3% YoY. Source: county tax records.
Cash-flow waterfall
monthlySold comps — $/sqft
last 12 mo · ≤1 miLoading sold comps…