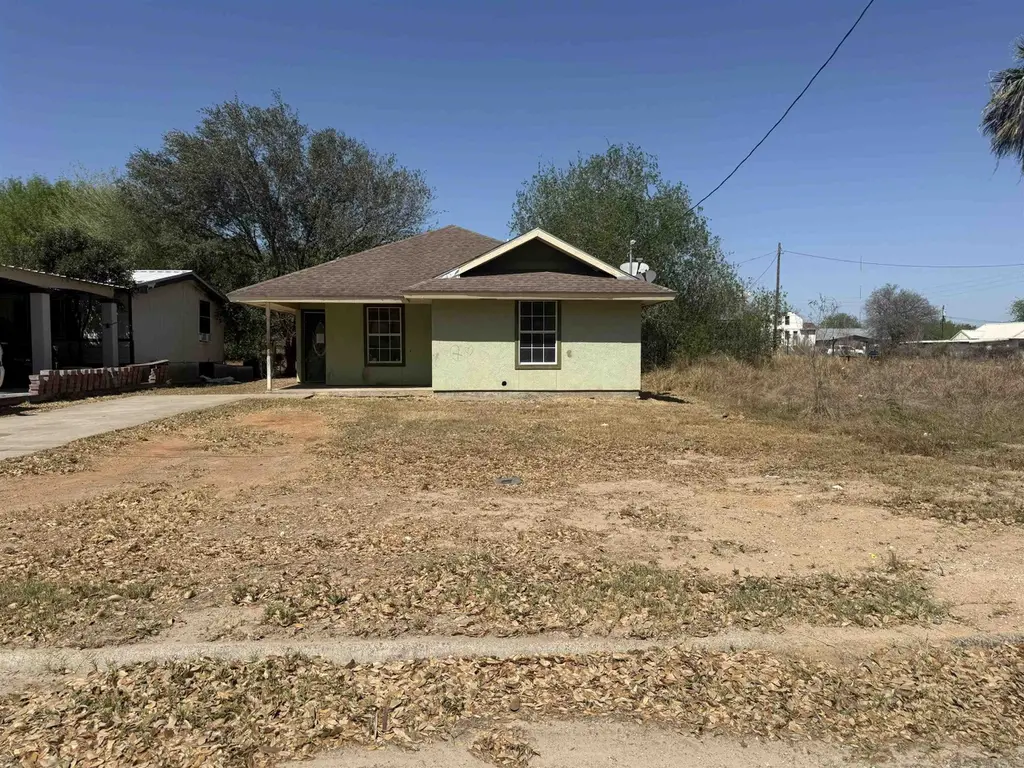
410 E Amada St · Hebbronville, TX
Flood risk 1/10 · Minimal
- FEMA flood zone
- —
- Chance of flooding over 30 yrs
- 0.0%
- Est. flood insurance / yr
- —
Fire risk 5/10 · Moderate
- Est. fire insurance / yr
- $1,222 – $2,270
Heat risk 9/10 · Severe
- Hot days now (above 111°F)
- 7 days/yr
- Hot days in 30 yrs
- 20 days/yr
Wind risk 8/10 · Major
- Chance of severe wind over 30 yrs
- 93.0%
Air-quality risk 1/10 · Minimal
- Unhealthy air days now
- 0 days/yr
- Unhealthy air days in 30 yrs
- 0 days/yr
Risk factors via First Street. Map © Google.
Why this score? — see what drove the D grade
The composite is a weighted blend of 9 inputs, each scored 0–100. Each bar is that input's sub-score; the figure is the points it added to the 100-point composite (weight × sub-score).
- Cash flow +12.3/30.0
- 1% rule +6.9/10.0
- ARV discount +6.9/15.0
- Appreciation +4.5/10.0
- DSCR +3.6/10.0
- Livability +3.1/5.0
- Schools +2.6/10.0
- Rent growth +2.5/5.0
- Condition / age +2.5/5.0
$91,084
🖨 Deal sheet 📄 Offer letter ✓ Due diligence
Listing remarks MLS
Charming 4-bedroom, 2-bath home located in the heart of Hebbronville. This well-situated property offers comfortable living with convenient access to everyday amenities. The home is ideally located near a local church and a city park, providing a peaceful neighborhood. This is a USDA property sold “As-Is, Where-Is. ” Title will only be conveyed by Quitclaim Deed. Buyers must sign the Hold Harmless form before entering the property. To make an offer or for more information, visit www. MyNextBid.com.
Key facts
- Convenient access
- City park
- 7,500 sq ft lot
Tags
Neighborhood map
What this means for you Summary
Snapshot
- This is a 4-bed/2.0-bath single-family listed at $91k.
Deal economics
- At list price, monthly cash flow is $-17 ($-204/yr) — negative.
- To cash-flow at today's rent, offer at most $88k (3.3% below list).
- Meets the 1% rule at list price ($1k rent vs $91k).
- Recommended offer: $83k (9.0% below list) — sets the bar for market timing.
Location & tenants
- Location reads 61/100 on livability (#1,032 in TX) — a middle-class / working-renter tenant base. Strengths: cost of living A+, housing A+; Watch: crime D+, schools D-, amenities F.
- Jim Hogg County ISD (town): math 31% / reading 31% proficiency, ranked #622 of 826 in TX (top 75%) — families likely to look elsewhere, expect single-tenant / working-renter base with shorter leases.
- Market conditions: 36 active listings in the ZIP.
Forward outlook
- Local home prices are declining (-0.9%/yr); year-one equity from $630 of loan paydown is wiped out by about $870 of value loss. Plan a longer hold.
- Jim Hogg County population projected at -10% by 2050 — secular population decline; favor cash flow + early exit over multi-decade hold.
Negotiation context
- It's been on market 97 days — a 9% lower offer ($83k) is reasonable based on typical stale-listing flexibility.
Risks & watch-outs
- Watch-outs: property tax is 4.7% of price.
- Climate carrying-cost: severe wind risk, 93% chance of damaging wind over 30y; moderate wildfire risk; extreme-heat days projected 7→20/yr by 2055 (HVAC capex compounding) — expect insurance premiums to compound above CPI over the hold.
Questions for the listing agent
- What do current leases actually rent for vs. the listed asking? Can we see a recent rent roll and the last 12 months of T-12 income?
- It's been on market 97 days. Have you received any prior offers? Is the seller open to a 9% concession, seller financing, or rate buy-down credit?
- Property tax is high relative to price — has the assessment been appealed recently, and will the sale trigger a re-assessment?
- Why hasn't it sold? Are there any deal-killer items the seller is aware of (foundation, flood, title, zoning, code violations)?
- Is there a deadline driving the sale (1031 exchange, divorce, estate, relocation)? That informs how much negotiation room exists.
- Schools are D-rated, which usually means shorter tenancies and higher turnover. Who's the typical renter profile here, and what's been the actual vacancy rate?
- Crime grade is D in this area — have there been break-ins, vandalism, or insurance claims at this property in the last 3 years? What carrier currently insures it and at what premium?
- The area grade is low — what's the realistic commute time and amenity access for the typical tenant pool here? Any planned neighborhood developments (good or bad) we should know about?
- What's the average days-on-market for RENTAL listings here right now (not sales)? A rising rental-DOM trend means longer vacancies and softer asking-rent achievability than the comps imply.
- What's the recent tenant-quality profile in this submarket — average credit score on applications, eviction rate, late-payment / NSF rate, and stable-employment percentage? A property-management company in the area should have these aggregated.
- How much new for-sale + rental construction is in the pipeline within 1–3 miles? Heavy new supply typically softens prices + rents 12–24 months out; constrained supply supports both.
Investment metrics
- 1% rule
- 1.19% ✓
- Cap rate
- 6.07%
- Cash-on-cash
- -0.80%
- DSCR
- 0.96
- GRM
- 7.0
CMA / ARV
- ARV (median comp)
- $89,847
- List price
- $91,084
- Delta
- 1.38%
- Verdict
- FAIR
- Comps
- 16 within 1.0 mi
Show comp detail 3 sales within ~0.75 mi
| Address | Dist | Beds/Ba | Sqft | Sold | Price | $/sf | Match |
|---|---|---|---|---|---|---|---|
| 411 S Smith Ave | 0.52mi | 3/2.0 (-1) | 1,440 (+2%) | 21mo | $119,900 | $83 | 50 |
| 409 E Kohler St | 0.44mi | 3/1.0 (-1) | 1,292 (-8%) | 22mo | $30,000 | $23 | 38 |
| 206 E Thompson St | 0.58mi | 3/2.0 (-1) | 1,230 (-13%) | 21mo | $64,625 | $53 | 29 |
Match score weights: distance 35% · size 25% · config 20% · recency 20%. Top-matched comps best support the ARV.
Projected returns pro-forma
-0.95% appreciation · 3.0% rent growth · sell at horizon
- IRR
- -6.8%
- Equity multiple
- 0.70×
- Total profit
- $-7,593
- Equity at exit
- $22,181
- IRR
- 0.1%
- Equity multiple
- 1.01×
- Total profit
- $276
- Equity at exit
- $23,458
Cash invested: $25,504 (down + closing). Projections, not guarantees.
Landlord ↔ Tenant lean methodology
- Overall (STATE)
- 87 Strongly Landlord-Friendly
- State Texas
- 87 Strongly Landlord-Friendly · R+5
- County
- — inherits STATE
- City
- — inherits STATE
ZIP-level market 78361
- Home prices YoY
- -0.9%
- Active inventory
- 36
- Price-to-rent
- 7.0×
Monthly cashflow live
- Estimated rent
- $1,084 medium interval (Pro) →
- Mortgage (P&I)
- −$478
- Tax from tax record
- −$358 /mo · $4,291/yr
- Insurance
- −$38
- HOA
- −$0
- Vacancy / Maint / Mgmt
- −$228
- Net cashflow
- $-17
Break-even live
UW: 25.0% down · 7.5% · 30yr · 1.5% tax · 5.0% vac · 8.0% maint · 8.0% mgmt
Financing live
Cash to close
- Down payment
- $22,771
- Closing costs
- $2,733
- Reserves months
- —
- Total cash needed
- —
Loan-product check · same deal, 3 products live
Conventional
25% down · 7.5% · 30yr
- Down + closing
- —
- Monthly P&I
- —
- Monthly cashflow
- —
- DSCR
- —
- Eligible?
- —
Personal DTI + credit; lowest rate.
DSCR
20% down · 8.5% · 30yr
- Down + closing
- —
- Monthly P&I
- —
- Monthly cashflow
- —
- DSCR
- —
- Eligible?
- —
No personal income docs; deal must DSCR.
Hard money
10% down · 12.0% · 12mo
- Down + closing
- —
- Monthly P&I
- —
- Monthly cashflow
- —
- DSCR
- —
- Eligible?
- —
Short-term bridge; refi at stabilization.
Listing history 17 events
-
2026-06-18days on market $91,084 Active 97 DOM
-
2026-06-17days on market $91,084 Active 96 DOM
-
2026-06-16days on market $91,084 Active 95 DOM
-
2026-06-15days on market $91,084 Active 94 DOM
-
2026-06-13days on market $91,084 Active 92 DOM
-
2026-06-12days on market $91,084 Active 91 DOM
-
2026-06-10days on market $91,084 Active 88 DOM
-
2026-06-08days on market $91,084 Active 87 DOM
-
2026-06-08days on market $91,084 Active 86 DOM
-
2026-06-05pricedays on market $91,084 Active 84 DOM
-
2026-06-03days on market $96,442 Active 82 DOM
-
2026-06-02days on market $96,442 Active 81 DOM
-
2026-06-01days on market $96,442 Active 80 DOM
-
2026-05-31days on market $96,442 Active 79 DOM
-
2026-05-04price $96,442 515-char remark
Show marketing remark (515 chars)
Charming 4-bedroom, 2-bath home located in the heart of Hebbronville. This well-situated property offers comfortable living with convenient access to everyday amenities. The home is ideally located near a local church and a city park, providing a peaceful neighborhood. This is a USDA property sold “As-Is, Where-Is. ” Title will only be conveyed by Quitclaim Deed. Buyers must sign the Hold Harmless form before entering the property. To make an offer or for more information, visit www. MyNextBid.com.
-
2026-03-12$107,158 Active 515-char remark
Show marketing remark (515 chars)
Charming 4-bedroom, 2-bath home located in the heart of Hebbronville. This well-situated property offers comfortable living with convenient access to everyday amenities. The home is ideally located near a local church and a city park, providing a peaceful neighborhood. This is a USDA property sold “As-Is, Where-Is. ” Title will only be conveyed by Quitclaim Deed. Buyers must sign the Hold Harmless form before entering the property. To make an offer or for more information, visit www. MyNextBid.com.
-
2010-11-23soldstatus
ⓘ Source: listings_history table (triggers on properties + properties_extension) + one-shot
backfill from property_details.listing_events for pre-trigger history.
Tax reassessment forecast TX · Resets to sale price
- Current annual tax
- $4,291 · $358/mo
- Projected year-2 tax
- $4,291 · $358/mo
- Expected delta
- $0/yr ($0/mo · 0.0%)
ⓘ Screening estimate from a state-policy table — verify with the county assessor before closing.
Climate risk First Street
- Flood 1/10 Low 0% chance over 30 yrs
- Wildfire 5/10 Major
- Heat 9/10 Extreme 7 d/yr ≥111°F today · 20 d/yr by 30 yrs out
- Wind 8/10 Severe 93% chance of damaging wind over 30 yrs
- Air quality 1/10 Low 0 unhealthy d/yr today · 0 by 30 yrs out
Nearby sold comps map
Loading sold comps map…
Walkable amenities ~0.75 mi
Loading nearby amenities…
Taxation est. · year 1
- Rental income
- $13,006
- − Mortgage interest
- −$5,102
- − Property taxes
- −$4,291
- − Insurance
- −$455
- − Repairs & maintenance
- −$1,040
- − Management
- −$1,040
- − Depreciation
- −$2,650
- Taxable loss
- −$1,574
- Est. tax savings @ 24.0%
- +$378
- After-tax cash flow
- $174/yr
For passive investors: Depreciation is non-cash, so a rental often shows a tax loss while cash-flowing — sheltering income. Rental losses are passive: they offset passive income freely, and up to $25,000/yr can offset ordinary (W-2) income if you actively participate and your MAGI is under $100k (phasing out to $0 by $150k); unused losses carry forward. On sale, claimed depreciation is recaptured at up to 25%, and gains may owe capital-gains tax (a 1031 exchange can defer both). Figures are a year-1 estimate at your 24.0% rate — not tax advice; consult a CPA.
Schools (NCES district)
- District
- Jim Hogg County ISD
- NCES district ID
- 4824750
- Math proficiency
- 31% ▼ -15.00%
- Reading proficiency
- 31% ▼ -2.00%
- Median HH income
- $35,870
- Composite
- 25.69/100
- National rank
- #7391
- State rank
- #622 of 826 in TX
Livability — Hebbronville
- Score
- 61/100
- State rank
- #1032
- US rank
- #18361
Category grades
Schools grade is shown separately in the Schools card above.
Census & demographics
- Census place
- Hebbronville, TX
- Population (ZIP)
- 4,764
Population outlook (Jim Hogg County) Hauer SSP2
- Today (2025)
- 5,023 people
- By 2030
- 4,897 · -2.5%
- By 2040
- 4,722 · -6.0%
- By 2050
- 4,510 · -10.2%
- By 2075
- 3,827 · -23.8%
- By 2100
- 2,794 · -44.4%
Race, ethnicity, and origin ACS 2023
- Neighborhood character
- Predominantly Hispanic (78%)
- Race & ethnicity
- Hispanic / Latino 78% Two or more races 40% White 21%
- Hispanic origin (detail)
- Mexican 76%
- Foreign-born
- 1% · Canada
- Languages at home
- 41% English-only · Spanish 58% Tagalog/Filipino 1%
Political lean MEDSL · Jim Hogg
- 2024 margin
- Lean D (+8.3) · D 54.0% · R 45.7%
- 2008→2024 swing
- -39.3pp toward R · 2008: 47.6pp · 2024: 8.3pp
- All cycles
- 2024: D+8.3 2020: D+17.9 2016: D+56.9 2012: D+56.7 2008: D+47.6
Not yet ingested
- Civics
- —
Market trends
- HPI YoY
- ▼ -0.95%
- Current HPI
- 99.0946
- Rent YoY
- —
- Metro
- —
- State GDP YoY
- ▲ 3.95%
- F500 in state
- 110
Industry mix (Fortune 500 HQ in TX)
| Industry | F500 HQs | Revenue |
|---|---|---|
| Energy | 16 | $1,198B |
|
||
| Technology | 5 | $198B |
|
||
| Engineering / Construction | 4 | $72B |
|
||
| Energy Services | 3 | $60B |
|
||
| Utilities | 3 | $41B |
|
||
| Healthcare | 2 | $330B |
|
||
Price history
-10.0% since first listed3 events — show timeline
- 2026-05-04 Price Changed $96,442 LAOR
- 2026-03-12 Listed $107,158 LAOR
- 2010-11-23 Sold (Public Records) — Public Records
Property tax history
+5.7%/yrLatest (2025): $4,291 · -3.2% YoY. Source: county tax records.
Cash-flow waterfall
monthlySold comps — $/sqft
last 12 mo · ≤1 miLoading sold comps…