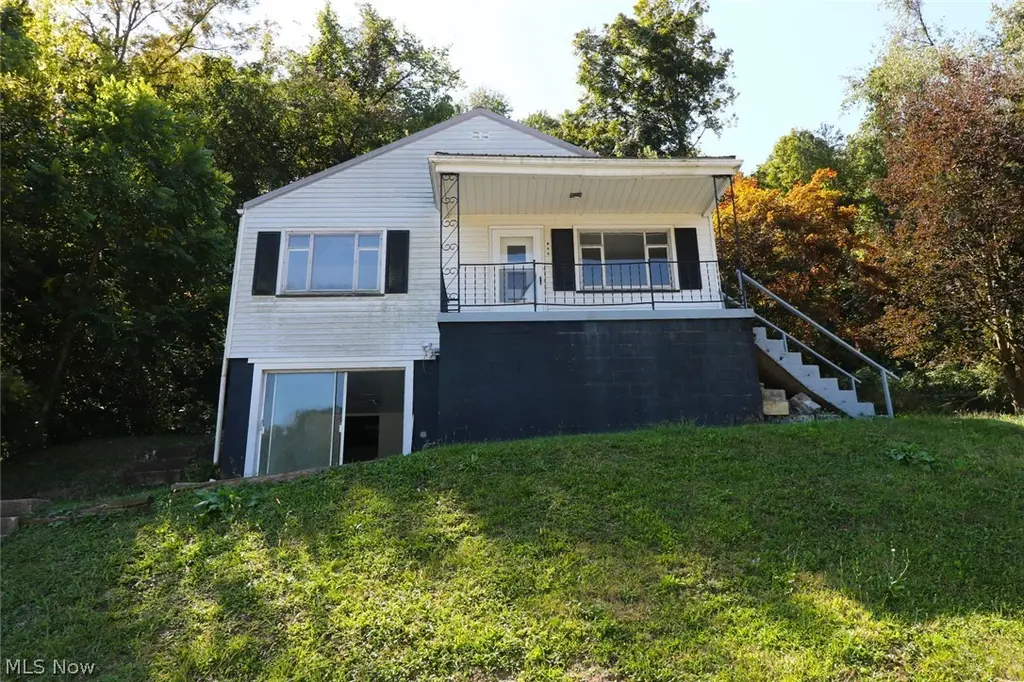
126 Ohio St · Mingo Junction, OH
Flood risk 1/10 · Minimal
- FEMA flood zone
- X (unshaded)
- Chance of flooding over 30 yrs
- 0.0%
- Est. flood insurance / yr
- $473 – $860
Fire risk 2/10 · Minimal
- Est. fire insurance / yr
- $713 – $1,323
Heat risk 3/10 · Minor
- Hot days now (above 97°F)
- 7 days/yr
- Hot days in 30 yrs
- 18 days/yr
Wind risk 1/10 · Minimal
- Chance of severe wind over 30 yrs
- —
Air-quality risk 2/10 · Minimal
- Unhealthy air days now
- 1 days/yr
- Unhealthy air days in 30 yrs
- 2 days/yr
Risk factors via First Street. Map © Google.
Why this score? — see what drove the B- grade
The composite is a weighted blend of 9 inputs, each scored 0–100. Each bar is that input's sub-score; the figure is the points it added to the 100-point composite (weight × sub-score).
- Cash flow +30.0/30.0
- 1% rule +10.0/10.0
- DSCR +10.0/10.0
- ARV discount +6.5/15.0
- Schools +4.1/10.0
- Livability +3.6/5.0
- Rent growth +2.5/5.0
- Condition / age +2.5/5.0
- Appreciation +0.0/10.0
$67,900
🖨 Deal sheet 📄 Offer letter ✓ Due diligence
Listing remarks MLS
Welcome to this charming 3-bedroom, 1-bath home in Mingo Junction, Ohio. Featuring a fresh coat of paint throughout the interior, this residence is move-in ready and full of potential. The covered front porch offers the perfect spot to relax and unwind after a long day. Conveniently located just minutes from State Route 7, this property provides quick access to Franciscan University—only 6.5 miles away—as well as shopping, dining, and local amenities. Whether you’re searching for your first home or looking to downsize, this home is a wonderful opportunity.
Key facts
- Covered front porch
- Fresh coat of paint
- 4,356 sq ft lot
Tags
Neighborhood map
What this means for you Summary
Snapshot
- This is a 3-bed/1.0-bath single-family listed at $68k.
Deal economics
- At list price, monthly cash flow is $411 ($5k/yr) — positive.
- The deal already cash-flows at list — no discount required.
- Meets the 1% rule at list price ($1k rent vs $68k).
- Recommended offer: $64k (6.0% below list) — sets the bar for market timing.
Location & tenants
- Location reads 72/100 on livability (#381 in OH) — a middle-class / working-renter tenant base. Strengths: cost of living A+, housing A+, crime A; Watch: commute D, amenities F, employment D-.
- Indian Creek Local (suburban): math 42% / reading 56% proficiency, ranked #455 of 656 in OH (top 69%) — families likely to look elsewhere, expect single-tenant / working-renter base with shorter leases.
- Market conditions: 17 active listings in the ZIP; 2 units permitted in Jefferson County in 2024 (0 in 5+ unit buildings).
Forward outlook
- Local home prices are declining (-3.0%/yr); year-one equity from $469 of loan paydown is wiped out by about $2k of value loss. Plan a longer hold.
- Jefferson County population projected at -19% by 2050 — secular population decline; favor cash flow + early exit over multi-decade hold.
- At projected returns (-3.0% appreciation + 3.0% rent growth), your $19k cash investment doubles in ~5 years — after that, you're playing with house money.
Negotiation context
- It's been on market 64 days — a 6% lower offer ($64k) is reasonable based on typical stale-listing flexibility.
- 8 sale attempts since 21y ago with the ask held roughly flat each time — persistent listings suggest the price (not the market) is what's stuck; bring a comps-based counter.
- Current owner paid $3k; list at $68k implies a 1989% gain — meaningful room to come down on a strong offer.
Risks & watch-outs
- Watch-outs: built in 1953 — expect roof / HVAC / electrical / plumbing capex.
Questions for the listing agent
- It's been on market 64 days. Have you received any prior offers? Is the seller open to a 6% concession, seller financing, or rate buy-down credit?
- Built in 1953 — when were the roof, HVAC, electrical panel, plumbing, and water heater last replaced?
- Why hasn't it sold? Are there any deal-killer items the seller is aware of (foundation, flood, title, zoning, code violations)?
- Is there a deadline driving the sale (1031 exchange, divorce, estate, relocation)? That informs how much negotiation room exists.
- Schools are A-rated — typically a magnet for longer-tenancy family renters. What's the average tenant stay here, and is there a school-zone premium baked into asking?
- What's the average days-on-market for RENTAL listings here right now (not sales)? A rising rental-DOM trend means longer vacancies and softer asking-rent achievability than the comps imply.
- What's the recent tenant-quality profile in this submarket — average credit score on applications, eviction rate, late-payment / NSF rate, and stable-employment percentage? A property-management company in the area should have these aggregated.
- How much new for-sale + rental construction is in the pipeline within 1–3 miles? Heavy new supply typically softens prices + rents 12–24 months out; constrained supply supports both.
Investment metrics
- 1% rule
- 1.58% ✓
- Cap rate
- 13.56%
- Cash-on-cash
- 25.94%
- DSCR
- 2.15
- GRM
- 5.3
CMA / ARV
- ARV (median comp)
- $66,476
- List price
- $67,900
- Delta
- 2.14%
- Verdict
- FAIR
- Comps
- 16 within 1.0 mi
Projected returns pro-forma
-3.0% appreciation · 3.0% rent growth · sell at horizon
- IRR
- 19.6%
- Equity multiple
- 1.80×
- Total profit
- $15,169
- Equity at exit
- $10,124
- IRR
- 27.9%
- Equity multiple
- 3.47×
- Total profit
- $46,901
- Equity at exit
- $5,871
Cash invested: $19,012 (down + closing). Projections, not guarantees.
Landlord ↔ Tenant lean methodology
- Overall (STATE)
- 73 Landlord-Friendly
- State Ohio
- 73 Landlord-Friendly · R+6
- County
- — inherits STATE
- City
- — inherits STATE
ZIP-level market 43938
- Home prices YoY
- -6.0%
- Active inventory
- 17
- Price-to-rent
- 5.3×
Monthly cashflow live
- Estimated rent
- $1,075 medium interval (Pro) →
- Mortgage (P&I)
- −$356
- Tax from tax record
- −$54 /mo · $646/yr
- Insurance
- −$28
- HOA
- −$0
- Vacancy / Maint / Mgmt
- −$226
- Net cashflow
- $411
Break-even live
UW: 25.0% down · 7.5% · 30yr · 1.5% tax · 5.0% vac · 8.0% maint · 8.0% mgmt
Financing live
Cash to close
- Down payment
- $16,975
- Closing costs
- $2,037
- Reserves months
- —
- Total cash needed
- —
Loan-product check · same deal, 3 products live
Conventional
25% down · 7.5% · 30yr
- Down + closing
- —
- Monthly P&I
- —
- Monthly cashflow
- —
- DSCR
- —
- Eligible?
- —
Personal DTI + credit; lowest rate.
DSCR
20% down · 8.5% · 30yr
- Down + closing
- —
- Monthly P&I
- —
- Monthly cashflow
- —
- DSCR
- —
- Eligible?
- —
No personal income docs; deal must DSCR.
Hard money
10% down · 12.0% · 12mo
- Down + closing
- —
- Monthly P&I
- —
- Monthly cashflow
- —
- DSCR
- —
- Eligible?
- —
Short-term bridge; refi at stabilization.
Listing history 20 events
-
2026-05-31statusdays on market $67,900 Pending 64 DOM
-
2026-03-27$67,900 Active 584-char remark
Show marketing remark (584 chars)
Welcome to this charming 3-bedroom, 1-bath home in Mingo Junction, Ohio. Featuring a fresh coat of paint throughout the interior, this residence is move-in ready and full of potential. The covered front porch offers the perfect spot to relax and unwind after a long day. Conveniently located just minutes from State Route 7, this property provides quick access to Franciscan University—only 6.5 miles away—as well as shopping, dining, and local amenities. Whether you’re searching for your first home or looking to downsize, this home is a wonderful opportunity.
-
2026-03-16historical
-
2025-12-23status Active
-
2025-12-15historical Contingent
-
2025-11-17price $69,900
-
2025-09-16$75,000 Active
-
2025-04-11historical $800
-
2024-12-21$800
-
2023-11-04historical $700
-
2023-10-24price $700
-
2023-10-11price $750
-
2023-09-25$800
-
2016-09-02soldstatus $3,250
-
2016-05-24$5,900
-
2016-05-20historical
-
2015-11-13$14,900
-
2006-01-27soldstatus $15,500
-
2005-05-27$16,800
-
2000-07-21soldstatus $41,000
ⓘ Source: listings_history table (triggers on properties + properties_extension) + one-shot
backfill from property_details.listing_events for pre-trigger history.
Tax reassessment forecast OH · Partial reset (capped growth)
- Current annual tax
- $646 · $54/mo
- Projected year-2 tax
- $853 · $71/mo
- Expected delta
- +$207/yr (+$17/mo · 32.0%)
ⓘ Screening estimate from a state-policy table — verify with the county assessor before closing.
Climate risk First Street
- Flood 1/10 Low FEMA zone X (unshaded) · 0% chance over 30 yrs
- Wildfire 2/10 Low
- Heat 3/10 Moderate 7 d/yr ≥97°F today · 18 d/yr by 30 yrs out
- Wind 1/10 Low
- Air quality 2/10 Low 1 unhealthy d/yr today · 2 by 30 yrs out
Nearby sold comps map
Loading sold comps map…
Walkable amenities ~0.75 mi
Loading nearby amenities…
Taxation est. · year 1
- Rental income
- $12,899
- − Mortgage interest
- −$3,803
- − Property taxes
- −$646
- − Insurance
- −$340
- − Repairs & maintenance
- −$1,032
- − Management
- −$1,032
- − Depreciation
- −$1,975
- Taxable income
- $4,071
- Est. tax owed @ 24.0%
- −$977
- After-tax cash flow
- $3,955/yr
For passive investors: Depreciation is non-cash, so a rental often shows a tax loss while cash-flowing — sheltering income. Rental losses are passive: they offset passive income freely, and up to $25,000/yr can offset ordinary (W-2) income if you actively participate and your MAGI is under $100k (phasing out to $0 by $150k); unused losses carry forward. On sale, claimed depreciation is recaptured at up to 25%, and gains may owe capital-gains tax (a 1031 exchange can defer both). Figures are a year-1 estimate at your 24.0% rate — not tax advice; consult a CPA.
Schools (NCES district)
- District
- Indian Creek Local
- NCES district ID
- 3904780
- Math proficiency
- 42% ▼ -24.00%
- Reading proficiency
- 56% ▼ -10.00%
- Median HH income
- $44,695
- Composite
- 41.39/100
- National rank
- #3483
- State rank
- #455 of 656 in OH
Livability — Mingo Junction
- Score
- 72/100
- State rank
- #381
- US rank
- #6170
Category grades
Schools grade is shown separately in the Schools card above.
Census & demographics
- County
- Jefferson · 64,369 people
- Metro
- Weirton-Steubenville, WV-OH
- Population (ZIP)
- 5,448
- Household income
- $57,453
- Rent vs Own
- Severe rent burden
- 11.2
Population outlook (Jefferson County) Hauer SSP2
- Today (2025)
- 63,481 people
- By 2030
- 61,067 · -3.8%
- By 2040
- 55,860 · -12.0%
- By 2050
- 51,236 · -19.3%
- By 2075
- 41,804 · -34.1%
- By 2100
- 32,344 · -49.0%
Race, ethnicity, and origin ACS 2023
- Neighborhood character
- Predominantly White (94%)
- Race & ethnicity
- White 94% Two or more races 5%
- Common ancestry
- Romanian 4% Slovak 1% Italian 1%
- Foreign-born
- 1% · Canada
Political lean MEDSL · Jefferson
- 2024 margin
- Solid R (+43.9) · D 27.5% · R 71.4% · Other 1.1%
- 2008→2024 swing
- -44.1pp toward R · 2008: 0.2pp · 2024: -43.9pp
- All cycles
- 2024: R+43.9 2020: R+38.4 2016: R+35.7 2012: R+5.5 2008: D+0.2
Not yet ingested
- Civics
- —
Market trends
- HPI YoY
- ▼ -11.44%
- Current HPI
- 179.3725
- Rent YoY
- —
- Metro
- —
- State GDP YoY
- ▲ 1.98%
- F500 in state
- 48
Industry mix (Fortune 500 HQ in OH)
| Industry | F500 HQs | Revenue |
|---|---|---|
| Insurance | 3 | $145B |
|
||
| Industrial Machinery | 3 | $49B |
|
||
| Financial Services | 3 | $24B |
|
||
| Consumer Goods | 2 | $93B |
|
||
| Aerospace / Defense | 2 | $47B |
|
||
| Utilities | 2 | $33B |
|
||
Price history
+65.6% since first listed19 events — show timeline
- 2026-03-27 Listed $67,900 MLSNOW
- 2026-03-16 Listing Removed — MLSNOW
- 2025-12-23 Relisted — MLSNOW
- 2025-12-15 Contingent — MLSNOW
- 2025-11-17 Price Changed $69,900 MLSNOW
- 2025-09-16 Listed $75,000 MLSNOW
- 2025-04-11 Rental Removed $800 APPFOLIO
- 2024-12-21 Listed for Rent $800 APPFOLIO
- 2023-11-04 Rental Removed $700 APPFOLIO
- 2023-10-24 Price Changed $700 APPFOLIO
- 2023-10-11 Price Changed $750 APPFOLIO
- 2023-09-25 Listed for Rent $800 APPFOLIO
- 2016-09-02 Sold (MLS) $3,250 MLSNOW
- 2016-05-24 Listed $5,900 MLSNOW
- 2016-05-20 Listing Removed — MLSNOW
- 2015-11-13 Listed $14,900 MLSNOW
- 2006-01-27 Sold (MLS) $15,500 MLSNOW
- 2005-05-27 Listed $16,800 MLSNOW
- 2000-07-21 Sold (Public Records) $41,000 Public Records
Property tax history
+1.7%/yrLatest (2025): $646 · +0.1% YoY. Source: county tax records.
Cash-flow waterfall
monthlySold comps — $/sqft
last 12 mo · ≤1 miLoading sold comps…