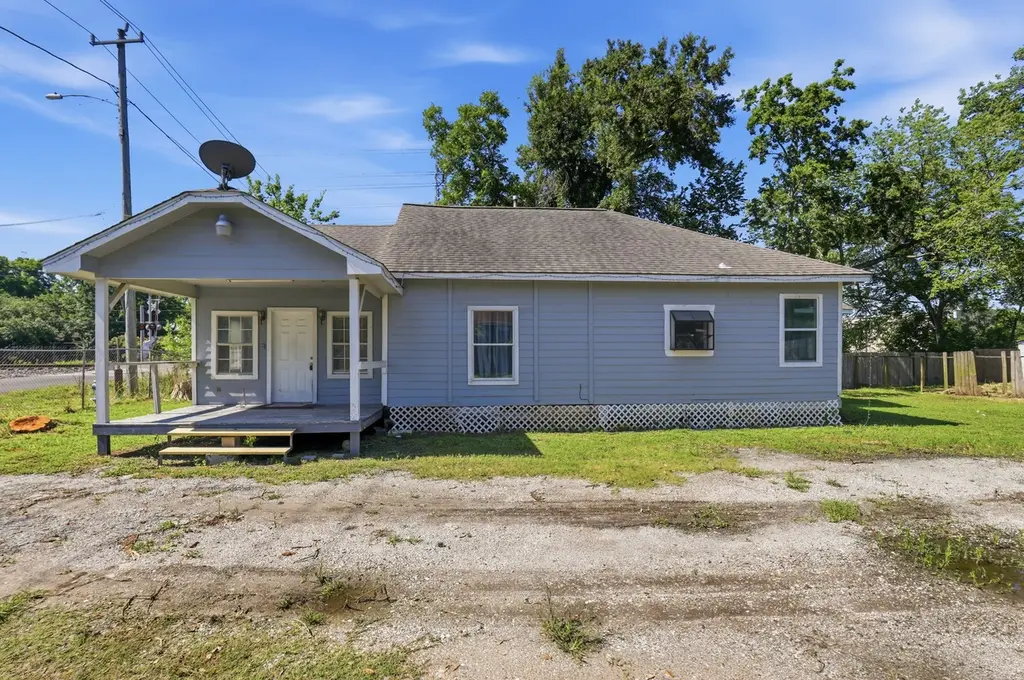
6803 Donlen St · Houston, TX
Flood risk 1/10 · Minimal
- FEMA flood zone
- X (unshaded)
- Chance of flooding over 30 yrs
- 0.0%
- Est. flood insurance / yr
- $507 – $1,088
Fire risk 1/10 · Minimal
- Est. fire insurance / yr
- $1,222 – $2,270
Heat risk 9/10 · Severe
- Hot days now (above 109°F)
- 7 days/yr
- Hot days in 30 yrs
- 24 days/yr
Wind risk 9/10 · Severe
- Chance of severe wind over 30 yrs
- 99.0%
Air-quality risk 3/10 · Minor
- Unhealthy air days now
- 2 days/yr
- Unhealthy air days in 30 yrs
- 3 days/yr
Risk factors via First Street. Map © Google.
Why this score? — see what drove the C+ grade
The composite is a weighted blend of 9 inputs, each scored 0–100. Each bar is that input's sub-score; the figure is the points it added to the 100-point composite (weight × sub-score).
- Cash flow +21.0/30.0
- ARV discount +15.0/15.0
- DSCR +6.7/10.0
- 1% rule +6.0/10.0
- Livability +3.7/5.0
- Rent growth +3.6/5.0
- Schools +2.7/10.0
- Condition / age +2.5/5.0
- Appreciation +0.0/10.0
$185,000
🖨 Deal sheet (PDF) 📄 Offer letter ✓ Due diligence
Listing remarks
This charming property offers a unique opportunity for the next owner. The home is being sold as-is, allowing for endless potential to transform it into a lucrative property. With a prime location, easy access to downtown, close to metro rail and a spacious large lot, this property is a hidden gem waiting to be discovered. Roof age is about 5 years, hardie siding, central heat and a/c, property fully fenced. Perfect for homestead or investors. Don't miss out on the chance to turn this diamond in the rough into a great home. Contact me today to schedule a viewing and unlock the possibilities that await in this exciting real estate opportunity. * * * Vacant lot (8,374 sqft) next to it is a
Key facts
- Fully fenced
- Spacious large lot
- Hardie siding
Tags
Property features AI
Finance
- Other: Total building area reported as 1,260; Total rooms: 6
- Financial info: Lease not considered
Exterior
- Utilities: Public water; Public sewer
- Home design: Residential property facing north; Single-story entry (all main rooms listed on the first floor)
- Construction: Built in 1958; Cement siding exterior; Composition roof; Pillar/post/pier foundation
- Exterior features: Lot dimensions approximately 53 x 148; Lot area about 7,526 sq ft; Lot includes other/unspecified features
Interior
- Kitchen: Kitchen on the first floor (13x12)
- Bedrooms: Primary bedroom on the first floor (13x13); Two additional bedrooms on the first floor (each 13x11); Den on the first floor (13x15)
- Bathrooms: 2 full bathrooms
- Heating & cooling: Central heating (gas); Central electric air conditioning
- Interior features: Kitchen and dining combined (kitchen/dining combo)
Neighborhood map
What this means for you Summary
Snapshot
- This is a 3-bed/2.0-bath single-family listed at $185k.
Deal economics
- At list price, monthly cash flow is $261 ($3k/yr) — positive.
- The deal already cash-flows at list — no discount required.
- Meets the 1% rule at list price ($2k rent vs $185k).
- Recommended offer: $182k (1.5% below list) — sets the bar for market timing.
- Cap rate 8.0% vs local median 3.2% in Houston — top-decile yield for the area; either an underpriced asset or a hidden risk that comps aren't pricing in. Stress-test before assuming the spread holds.
Location & tenants
- Location reads 74/100 on livability (#184 in TX, #4,771 nationally) — a middle-class / working-renter tenant base. Strengths: amenities A+, cost of living A+, housing A+; Watch: crime F.
- Houston ISD (urban): math 27% / reading 35% proficiency, ranked #593 of 826 in TX (top 72%) — families likely to look elsewhere, expect single-tenant / working-renter base with shorter leases; 71% free/reduced lunch — lower-income household profile, screen leases tightly.
- Zoned schools: Herrera El (math 36% / reading 34%, grade F, #1,965 of 4,322 statewide, top 46%, 828 students, 91% FRL); Burbank Middle (math 37% / reading 42%, grade F, #660 of 1,662 statewide, top 41%, 1,417 students, 96% FRL); Houston Math Science And Technology Center (math 9% / reading 21%, grade F, #1,507 of 1,632 statewide, top 93%, 2,779 students, 95% FRL) — zoned schools average 94% FRL vs 71% district-wide (23 pts higher); higher-poverty schools than district average — tighter screening recommended.
- Market conditions: Rents rising fast (+4.5%/yr); 285 active listings in the ZIP; 35 comparable units currently listed for rent nearby; rentals at typical pace (median 15d on market — plan ~3-4 weeks tenant-placement turnaround); 29,883 units permitted in Harris County in 2024 (8,621 in 5+ unit buildings).
- At $2,038/mo this rent would consume 46% of the median local household income ($53k/yr) (locally 1354% of renters already pay >50% of income on rent) — very limited rent-growth headroom before tenants either downsize or default.
Forward outlook
- Local home prices are declining (-3.0%/yr); year-one equity from $1k of loan paydown is wiped out by about $6k of value loss. Plan a longer hold.
- Harris County population projected at +47% by 2050 — long-run rental-demand tailwind backs the buy-and-hold thesis.
Negotiation context
- It's been on market 22 days — a 2% lower offer ($182k) is reasonable based on typical stale-listing flexibility.
- 2 sale attempts since 5y ago with the ask held roughly flat each time — persistent listings suggest the price (not the market) is what's stuck; bring a comps-based counter.
- Current owner paid $35k; list at $185k implies a 430% gain — meaningful room to come down on a strong offer.
Risks & watch-outs
- Watch-outs: built in 1958 — expect roof / HVAC / electrical / plumbing capex.
- Climate carrying-cost: severe wind risk, 99% chance of damaging wind over 30y; extreme-heat days projected 7→24/yr by 2055 (HVAC capex compounding) — expect insurance premiums to compound above CPI over the hold.
Questions for the listing agent
- Built in 1958 — when were the roof, HVAC, electrical panel, plumbing, and water heater last replaced?
- Is there a deadline driving the sale (1031 exchange, divorce, estate, relocation)? That informs how much negotiation room exists.
- Schools are D-rated, which usually means shorter tenancies and higher turnover. Who's the typical renter profile here, and what's been the actual vacancy rate?
- Crime grade is F in this area — have there been break-ins, vandalism, or insurance claims at this property in the last 3 years? What carrier currently insures it and at what premium?
- What's the average days-on-market for RENTAL listings here right now (not sales)? A rising rental-DOM trend means longer vacancies and softer asking-rent achievability than the comps imply.
- What's the recent tenant-quality profile in this submarket — average credit score on applications, eviction rate, late-payment / NSF rate, and stable-employment percentage? A property-management company in the area should have these aggregated.
- How much new for-sale + rental construction is in the pipeline within 1–3 miles? Heavy new supply typically softens prices + rents 12–24 months out; constrained supply supports both.
Investment metrics
- 1% rule
- 1.10% ✓
- Cap rate
- 7.99%
- Cash-on-cash
- 6.06%
- DSCR
- 1.27
- GRM
- 7.6
CMA / ARV
- ARV (on-the-fly)
- $317,520
- Comps found
- 12
Show comp detail 12 sales within ~0.75 mi
| Address | Dist | Beds/Ba | Sqft | Sold | Price | $/sf | Match |
|---|---|---|---|---|---|---|---|
| 227 Styers St | 0.24mi | 3/2.0 | 1,268 (+1%) | 14mo | $178,000 | $140 | 76 |
| 7125 Farnsworth St | 0.44mi | 3/2.0 | 1,296 (+3%) | 3mo | $215,000 | $166 | 72 |
| 105 Oddo St | 0.53mi | 3/2.0 | 1,336 (+6%) | 2mo | $155,000 | $116 | 64 |
| 513 Reid St | 0.51mi | 3/1.0 | 1,218 (-3%) | 6mo | $345,000 | $283 | 62 |
| 217 Dorchester St | 0.22mi | 3/1.0 | 1,094 (-13%) | 8mo | $285,000 | $261 | 57 |
| 1314 E 34th St | 0.67mi | 3/2.0 | 1,274 (+1%) | 12mo | $285,000 | $224 | 57 |
| 206 Delaney St | 0.45mi | 3/2.0 | 1,112 (-12%) | 10mo | $299,000 | $269 | 51 |
| 516 Kelley St | 0.63mi | 2/1.0 (-1) | 1,221 (-3%) | 8mo | $426,900 | $350 | 50 |
| 1406 E 35th St | 0.59mi | 3/1.5 | 1,120 (-11%) | 4mo | $175,000 | $156 | 48 |
| 604 Yorkshire St | 0.63mi | 2/1.0 (-1) | 1,170 (-7%) | 2mo | $175,000 | $150 | 48 |
| 415 Woodard St | 0.67mi | 2/1.0 (-1) | 1,337 (+6%) | 4mo | $409,000 | $306 | 46 |
| 1922 Tabor St | 0.61mi | 3/2.0 | 1,102 (-12%) | 9mo | $278,000 | $252 | 43 |
Match score weights: distance 35% · size 25% · config 20% · recency 20%. Top-matched comps best support the ARV.
Projected returns pro-forma
-3.0% appreciation · 4.47% rent growth · sell at horizon
- IRR
- -5.2%
- Equity multiple
- 0.80×
- Total profit
- $-10,193
- Equity at exit
- $27,584
- IRR
- 6.2%
- Equity multiple
- 1.50×
- Total profit
- $25,796
- Equity at exit
- $15,995
Cash invested: $51,800 (down + closing). Projections, not guarantees.
Landlord ↔ Tenant lean methodology
- Overall (STATE)
- 87 Strongly Landlord-Friendly
- State Texas
- 87 Strongly Landlord-Friendly · R+5
- County
- — inherits STATE
- City
- — inherits STATE
ZIP-level market 77022
- Home prices YoY
- -33.2%
- Rents YoY
- 4.5%
- Active inventory
- 285
- Price-to-rent
- 7.6×
Monthly cashflow live
- Estimated rent
- $2,038 high interval (Pro) →
- Mortgage (P&I)
- −$970
- Tax from tax record
- −$301 /mo · $3,611/yr
- Insurance
- −$77
- HOA
- −$0
- Vacancy / Maint / Mgmt
- −$428
- Net cashflow
- $261
Break-even live
Sensitivity live
| Price | -10% $366 | -5% $314 | +0% $261 | +5% $209 | +10% $157 |
|---|---|---|---|---|---|
| Rent | -10% $101 | -5% $181 | +0% $261 | +5% $342 | +10% $422 |
| Rate | -1.0pp $355 | -0.5pp $309 | base $261 | +0.5pp $214 | +1.0pp $165 |
UW: 25.0% down · 7.5% · 30yr · 1.5% tax · 5.0% vac · 8.0% maint · 8.0% mgmt
Financing live
Cash to close
- Down payment
- $46,250
- Closing costs
- $5,550
- Reserves months
- —
- Total cash needed
- —
Loan-product check · same deal, 3 products live
Conventional
25% down · 7.5% · 30yr
- Down + closing
- —
- Monthly P&I
- —
- Monthly cashflow
- —
- DSCR
- —
- Eligible?
- —
Personal DTI + credit; lowest rate.
DSCR
20% down · 8.5% · 30yr
- Down + closing
- —
- Monthly P&I
- —
- Monthly cashflow
- —
- DSCR
- —
- Eligible?
- —
No personal income docs; deal must DSCR.
Hard money
10% down · 12.0% · 12mo
- Down + closing
- —
- Monthly P&I
- —
- Monthly cashflow
- —
- DSCR
- —
- Eligible?
- —
Short-term bridge; refi at stabilization.
Rent comps 35 comps
| Address | Beds | Baths | Sqft | Rent | $/sqft | DOM | Units | Dist |
|---|---|---|---|---|---|---|---|---|
| 207 Lindale St Unit 1316403P Houston, TX | 2.0 | 1.0 | 1119 | $3,187 | $2.85 | 1d | 1 | 0.14mi |
| 58 Bennington St Houston, TX | 2.0 | 1.0 | 950 | $950 | $1.00 | 26d | 1 | 0.28mi |
| 6918 Irvington Blvd Houston, TX | 2.0 | 2.0 | 1100 | $1,550 | $1.41 | 45d | 1 | 0.63mi |
| 1420 E 31st St Houston, TX | 3.0 | 2.5 | 1790 | $2,600 | $1.45 | 26d | 1 | 0.65mi |
| 1690 North Loop Houston, TX | 1.0–2.0 | 1.0–2.0 | 876 | $2,269 | $2.59 | 0d | 40 | 0.69mi |
| 835E Dorchester St Unit 1273076P Houston, TX | 3.0 | 2.0 | 1528 | $3,079 | $2.02 | 1d | 1 | 0.73mi |
| 705 Link Rd Houston, TX | 3.0 | 3.5 | 1850 | $2,600 | $1.41 | 9d | 1 | 0.97mi |
| 705 Link Rd Houston, TX | 3.0 | 3.5 | 1850 | $2,600 | $1.41 | 1d | 1 | 0.97mi |
| 4132 Europa St Houston, TX | 3.0 | 2.0 | 1259 | $1,430 | $1.14 | 14d | 1 | 1.00mi |
| 1617 Enid St Houston, TX | 1.0–2.0 | 1.0–2.0 | 974 | $2,417 | $2.48 | 0d | 54 | 1.00mi |
| 8185 Fulton St Houston, TX | 2.0 | 2.0 | 924 | $1,395 | $1.51 | 26d | 1 | 1.02mi |
| 770 Strawberry Pines Ct Houston, TX | 2.0–3.0 | 2.5 | 1422 | $2,735 | $1.92 | 3d | 12 | 1.09mi |
| 823 North Loop Unit A Houston, TX | 3.0 | 2.0 | 1532 | $2,500 | $1.63 | 26d | 1 | 1.09mi |
| 74 Lyerly St Houston, TX | 1.0–2.0 | 1.0–2.0 | 775 | $1,211 | $1.56 | 22d | 5 | 1.10mi |
| 8217 Fulton St Houston, TX | 2.0–3.0 | 1.0 | 785 | $1,162 | $1.48 | 4d | 6 | 1.14mi |
| 3514 Ajax St Unit 1047956P Houston, TX | 3.0 | 2.5 | 1689 | $3,114 | $1.84 | 9d | 1 | 1.17mi |
| 811 E 42nd St Houston, TX | 4.0 | 2.0 | 1213 | $1,600 | $1.32 | 45d | 1 | 1.17mi |
| 6869 Arto St Houston, TX | 1.0–2.0 | 1.0 | 900 | $950 | $1.06 | 18d | 6 | 1.20mi |
| 611 W Cavalcade St Houston, TX | 1.0–2.0 | 1.0 | 775 | $1,339 | $1.73 | 3d | 12 | 1.22mi |
| 1209 Cordell St Houston, TX | 2.0 | 2.0 | 990 | $2,000 | $2.02 | 4d | 1 | 1.22mi |
| 4605 Fisk St Houston, TX | 3.0 | 2.0 | 1628 | $3,000 | $1.84 | 45d | 1 | 1.26mi |
| 8520 Madie Dr Houston, TX | 2.0 | 2.0 | 924 | $1,395 | $1.51 | 45d | 1 | 1.27mi |
| 8520 Madie Dr Houston, TX | 2.0 | 2.0 | 924 | $1,395 | $1.51 | 22d | 1 | 1.27mi |
| 611 E 39th St Houston, TX | 2.0 | 2.0 | 1326 | $2,099 | $1.58 | 45d | 1 | 1.27mi |
| 8520 Madie Dr Unit 8577 Houston, TX | 2.0 | 2.0 | 924 | $1,291 | $1.40 | 45d | 1 | 1.29mi |
| 8520 Madie Dr Unit 2047 Houston, TX | 2.0 | 2.0 | 924 | $1,345 | $1.46 | 0d | 1 | 1.29mi |
| 8520 Madie Dr Unit 422 Houston, TX | 2.0 | 2.0 | 924 | $1,320 | $1.43 | 9d | 1 | 1.29mi |
| 8520 Madie Dr Unit 2174 Houston, TX | 2.0 | 2.0 | 924 | $1,344 | $1.45 | 12d | 1 | 1.30mi |
| 8520 Madie Dr Unit 424 Houston, TX | 2.0 | 2.0 | 924 | $1,320 | $1.43 | 7d | 1 | 1.30mi |
| 8520 Madie Dr Unit 2112 Houston, TX | 2.0 | 2.0 | 924 | $1,304 | $1.41 | 0d | 1 | 1.30mi |
| 538 E 38th St Houston, TX | 3.0 | 2.5 | 1521 | $2,300 | $1.51 | 45d | 1 | 1.30mi |
| 1007 Archer St Houston, TX | 2.0 | 1.0 | 1008 | $1,923 | $1.91 | 4d | 1 | 1.35mi |
| 8855 McGallion Rd Houston, TX | 1.0–2.0 | 1.0–2.0 | 751 | $1,303 | $1.73 | 45d | 6 | 1.41mi |
| 8855 McGallion Rd Houston, TX | 1.0–2.0 | 1.0–2.0 | 751 | $1,303 | $1.73 | 17d | 16 | 1.41mi |
| 322 E 33rd St Houston, TX | 2.0 | 1.0 | 1100 | $1,500 | $1.36 | 45d | 1 | 1.45mi |
Listing history 15 events
-
2026-06-21days on market $185,000 Active 22 DOM
-
2026-06-18days on market $185,000 Active 19 DOM
-
2026-06-17days on market $185,000 Active 18 DOM
-
2026-06-16days on market $185,000 Active 17 DOM
-
2026-06-15days on market $185,000 Active 16 DOM
-
2026-06-13days on market $185,000 Active 14 DOM
-
2026-06-09days on market $185,000 Active 10 DOM
-
2026-06-08days on market $185,000 Active 9 DOM
-
2026-06-07days on market $185,000 Active 8 DOM
-
2026-06-04days on market $185,000 Active 5 DOM
-
2026-06-03days on market $185,000 Active 4 DOM
-
2026-06-02days on market $185,000 Active 3 DOM
-
2026-06-01days on market $185,000 Active 2 DOM
-
2026-05-31remarks 699-char remark
-
2026-05-31$185,000 Active 1 DOM
ⓘ Source: listings_history table (triggers on properties + properties_extension) + one-shot
backfill from property_details.listing_events for pre-trigger history.
Tax reassessment forecast TX · Resets to sale price
- Current annual tax
- $3,611 · $301/mo
- Projected year-2 tax
- $3,611 · $301/mo
- Expected delta
- $0/yr ($0/mo · 0.0%)
ⓘ Screening estimate from a state-policy table — verify with the county assessor before closing.
Climate risk First Street
- Flood 1/10 Low FEMA zone X (unshaded) · 0% chance over 30 yrs
- Wildfire 1/10 Low
- Heat 9/10 Extreme 7 d/yr ≥109°F today · 24 d/yr by 30 yrs out
- Wind 9/10 Extreme 99% chance of damaging wind over 30 yrs
- Air quality 3/10 Moderate 2 unhealthy d/yr today · 3 by 30 yrs out
Nearby sold comps map
Loading sold comps map…
Walkable amenities ~0.75 mi
Loading nearby amenities…
Taxation est. · year 1
- Rental income
- $24,450
- − Mortgage interest
- −$10,363
- − Property taxes
- −$3,611
- − Insurance
- −$925
- − Repairs & maintenance
- −$1,956
- − Management
- −$1,956
- − Depreciation
- −$5,382
- Taxable income
- $257
- Est. tax owed @ 24.0%
- −$62
- After-tax cash flow
- $3,076/yr
For passive investors: Depreciation is non-cash, so a rental often shows a tax loss while cash-flowing — sheltering income. Rental losses are passive: they offset passive income freely, and up to $25,000/yr can offset ordinary (W-2) income if you actively participate and your MAGI is under $100k (phasing out to $0 by $150k); unused losses carry forward. On sale, claimed depreciation is recaptured at up to 25%, and gains may owe capital-gains tax (a 1031 exchange can defer both). Figures are a year-1 estimate at your 24.0% rate — not tax advice; consult a CPA.
Schools (NCES district)
- District
- Houston ISD
- NCES district ID
- 4823640
- Math proficiency
- 27% ▼ -18.00%
- Reading proficiency
- 35% ▼ -6.00%
- Median HH income
- $46,054
- Composite
- 26.63/100
- National rank
- #7173
- State rank
- #593 of 826 in TX
Livability — Houston
- Score
- 74/100
- State rank
- #184
- US rank
- #4771
Category grades
Schools grade is shown separately in the Schools card above.
Census & demographics
- Census place
- Houston, TX
- County
- Harris County · 4,702,590 people
- City population
- 3,226,434
- Metro
- Houston-The Woodlands-Sugar Land, TX
- Population (ZIP)
- 25,805
- Household income
- $52,739
- Rent vs Own
- Severe rent burden
- 1354.0
Population outlook (Harris County) Hauer SSP2
- Today (2025)
- 5,571,493 people
- By 2030
- 6,089,821 · +9.3%
- By 2040
- 7,142,806 · +28.2%
- By 2050
- 8,185,864 · +46.9%
- By 2075
- 10,574,329 · +89.8%
- By 2100
- 12,109,958 · +117.4%
Race, ethnicity, and origin ACS 2023
- Neighborhood character
- Predominantly Hispanic (72%)
- Race & ethnicity
- Hispanic / Latino 72% Two or more races 24% Black 19% White 7% Native American 1%
- Hispanic origin (detail)
- Mexican 54%
- Common ancestry
- Romanian 1% Portuguese 1%
- Foreign-born
- 30% · Canada, Jamaica
- Languages at home
- 40% English-only · Spanish 59%
Political lean MEDSL · Harris
- 2024 margin
- Lean D (+5.5) · D 52.0% · R 46.4% · Other 1.6%
- 2008→2024 swing
- +3.9pp toward D · 2008: 1.6pp · 2024: 5.5pp
- All cycles
- 2024: D+5.5 2020: D+13.3 2016: D+12.4 2012: D+0.1 2008: D+1.6
Not yet ingested
- Civics
- —
Market trends
- HPI YoY
- ▼ -151.13%
- Current HPI
- 304.3745
- Rent YoY
- ▲ 4.47%
- Metro
- Houston-The Woodlands-Sugar Land, TX
- State GDP YoY
- ▲ 3.95%
- F500 in state
- 110
Industry mix (Fortune 500 HQ in TX)
| Industry | F500 HQs | Revenue |
|---|---|---|
| Energy | 16 | $1,198B |
|
||
| Technology | 5 | $198B |
|
||
| Engineering / Construction | 4 | $72B |
|
||
| Energy Services | 3 | $60B |
|
||
| Utilities | 3 | $41B |
|
||
| Healthcare | 2 | $330B |
|
||
Price history
+430.1% since first listed7 events — show timeline
- 2026-05-30 Listed $185,000 HARMLS
- 2021-05-08 Listing Removed — HARMLS
- 2021-03-09 Price Changed $305,000 HARMLS
- 2021-01-15 Listed $325,000 HARMLS
- 2008-09-24 Sold (Public Records) — Public Records
- 1995-11-01 Sold (Public Records) $34,900 Public Records
- 1988-01-02 Sold (Public Records) — Public Records
Property tax history
+4.1%/yrLatest (2025): $3,611 · +4.9% YoY. Source: county tax records.
Cash-flow waterfall
monthlySold comps — $/sqft
last 12 mo · ≤1 miLoading sold comps…