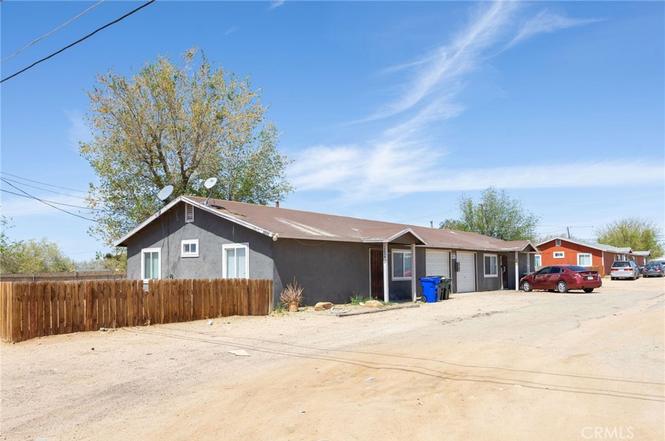
 Duplex
12048 Sand Ave · Adelanto, CA
Flood risk 3/10 · Minor
- FEMA flood zone
- AE
- Chance of flooding over 30 yrs
- 0.1%
- Est. flood insurance / yr
- $1,737 – $8,500
Fire risk 4/10 · Minor
- Est. fire insurance / yr
- $659 – $1,223
Heat risk 7/10 · Major
- Hot days now (above 99°F)
- 6 days/yr
- Hot days in 30 yrs
- 15 days/yr
Wind risk 1/10 · Minimal
- Chance of severe wind over 30 yrs
- —
Air-quality risk 8/10 · Major
- Unhealthy air days now
- 16 days/yr
- Unhealthy air days in 30 yrs
- 20 days/yr
Risk factors via First Street. Map © Google.
Why this score? — see what drove the C grade
The composite is a weighted blend of 9 inputs, each scored 0–100. Each bar is that input's sub-score; the figure is the points it added to the 100-point composite (weight × sub-score).
- ARV discount +15.0/15.0
- Cash flow +12.7/30.0
- Appreciation +10.0/10.0
- DSCR +3.8/10.0
- Rent growth +3.7/5.0
- 1% rule +3.6/10.0
- Condition / age +2.5/5.0
- Livability +2.4/5.0
- Schools +2.2/10.0
$360,000
🖨 Deal sheet 📄 Offer letter ✓ Due diligence
Multi-family units
County records classify this as Multi-Family (2-4 Unit). Listing-text estimate: 2 units. confirmed
Listing remarks MLS
Bank Owned Property. Sold AS-IS. Single Story Duplex in North Adelanto. Close to SCLA. Each unit is 2 bedroom, 1 bath, single attached garage. This property is being sold in its present condition. (AS-IS)
Key facts
- Street-level lot
- Private patios
- Single-story duplex
Tags
Property features AI
Finance
- Other: Property is not an ADU
- Financial info: Total building area reported as 1,800 (unit not repeated in interior/exterior); Gross income/Gross scheduled income of $36,600; Net operating income of $25,559; Gross multiplier 9.83; Operating expenses reported at $11,041 with line items including taxes, insurance, gardener, maintenance, trash, electric, and water/sewer; One building with two total units
- HOA & community: Community apartment common interest
Exterior
- Parking: Two parking spaces total; Each unit has an attached 2-car garage
- Security: No security details provided
- Utilities: Septic tank sewer system; District/public water; One separate water meter; Two separate gas meters; Two separate electric meters
- Home design: Single-story building; Attached dwelling; Community apartment property
- Construction: Year built from public records (year not specified)
- Exterior features: No pool; Lot characterized as 2–5 units per acre
Interior
- Kitchen: No specific kitchen appliance details provided
- Bedrooms: Unit(s) include 2-bedroom layouts
- Flooring: No flooring information provided
- Bathrooms: Units include 1 full bathroom
- Heating & cooling: No heating or cooling information provided
- Interior features: Ground-floor entry; Attached property with one common wall; Two-unit community apartment
- Laundry & utility: No laundry facilities in-unit
Neighborhood map
What this means for you Summary
Snapshot
- This is a 2 × 2-bed/1.0-bath units multifamily listed at $360k.
Deal economics
- At list price, monthly cash flow is $-467 ($-6k/yr) — negative. Per door: $-234/mo.
- To cash-flow at today's rent, offer at most $292k (18.8% below list).
- To meet the 1% rule (rent ≥ 1% of price), the offer needs to be $310k (13.9% below list).
- Recommended offer: $292k (18.8% below list) — sets the bar for cash-flow.
- Cap rate 6.2% vs local median 4.2% in Adelanto — top-decile yield for the area; either an underpriced asset or a hidden risk that comps aren't pricing in. Stress-test before assuming the spread holds.
Location & tenants
- Location reads 47/100 on livability (#1,250 in CA) — a working-class tenant base; expect higher turnover. Strengths: housing A+; Watch: crime D, schools F, amenities F.
- Victor Valley Union High (urban): math 25% / reading 25% proficiency, ranked #407 of 517 in CA (top 79%) — low school quality limits family demand, transient renter base, plan for 1-2y turnover; 72% free/reduced lunch — lower-income household profile, screen leases tightly.
- Market conditions: Rents rising fast (+4.7%/yr); 615 active listings in the ZIP; 1 comparable units currently listed for rent nearby; 5,458 units permitted in San Bernardino County in 2024 (1,500 in 5+ unit buildings).
- At $3,098/mo this rent would consume 54% of the median local household income ($69k/yr) (locally 1345% of renters already pay >50% of income on rent) — very limited rent-growth headroom before tenants either downsize or default.
Forward outlook
- In year one you build about $38k of equity ($2k loan paydown + $36k appreciation (10.0% local appreciation)).
- San Bernardino County population projected at +15% by 2050 — modest demand growth; plan on rents tracking national, not racing it.
- By year 2, paydown + projected appreciation supports a ~$62k cash-out refi (75% LTV) — recoverable capital for the next deal without selling this one.
Negotiation context
- It's been on market 153 days — a 12% lower offer ($317k) is reasonable based on typical stale-listing flexibility.
- 5 sale attempts since 19y ago with the ask held roughly flat each time — persistent listings suggest the price (not the market) is what's stuck; bring a comps-based counter.
- Current owner paid $22k; list at $360k implies a 1536% gain — meaningful room to come down on a strong offer.
Risks & watch-outs
- Watch-outs: flood insurance adds $427/mo.
- Climate carrying-cost: in FEMA flood zone AE (mandatory federal flood insurance); extreme-heat days projected 6→15/yr by 2055 (HVAC capex compounding) — expect insurance premiums to compound above CPI over the hold.
Questions for the listing agent
- What do current leases actually rent for vs. the listed asking? Can we see a recent rent roll and the last 12 months of T-12 income?
- It's been on market 153 days. Have you received any prior offers? Is the seller open to a 19% concession, seller financing, or rate buy-down credit?
- Can we see the unit-by-unit rent roll, current vacancy, and any below-market leases? What's the average tenancy length?
- What capital expenditures (roof, boiler, parking lot, exteriors) have been made in the last 5 years, and what's planned in the next 2?
- What's the actual annual flood-insurance premium (NFIP or private), and is the property in a SFHA with mandatory coverage?
- Why hasn't it sold? Are there any deal-killer items the seller is aware of (foundation, flood, title, zoning, code violations)?
- Is there a deadline driving the sale (1031 exchange, divorce, estate, relocation)? That informs how much negotiation room exists.
- Schools are F-rated, which usually means shorter tenancies and higher turnover. Who's the typical renter profile here, and what's been the actual vacancy rate?
- Crime grade is D in this area — have there been break-ins, vandalism, or insurance claims at this property in the last 3 years? What carrier currently insures it and at what premium?
- What's the average days-on-market for RENTAL listings here right now (not sales)? A rising rental-DOM trend means longer vacancies and softer asking-rent achievability than the comps imply.
- What's the recent tenant-quality profile in this submarket — average credit score on applications, eviction rate, late-payment / NSF rate, and stable-employment percentage? A property-management company in the area should have these aggregated.
- How much new apartment / multifamily construction is in the pipeline within 1–3 miles? Heavy new supply (>2% of stock underway) typically softens rents 12–24 months out; light construction supports rent growth.
Investment metrics
- 1% rule
- 0.86% ✗
- Cap rate
- 6.16%
- Cash-on-cash
- -0.48%
- DSCR
- 0.98
- GRM
- 9.7
CMA / ARV
- ARV (on-the-fly)
- $500,400
- Comps found
- 1
Show comp detail 1 sale within ~0.75 mi
| Address | Dist | Beds/Ba | Sqft | Sold | Price | $/sf | Match |
|---|---|---|---|---|---|---|---|
| 18415 Jonathan St | 0.42mi | 4/1.0 | 2,048 (+14%) | 8mo | $570,000 | $278 | 46 |
Match score weights: distance 35% · size 25% · config 20% · recency 20%. Top-matched comps best support the ARV.
Projected returns pro-forma
10.0% appreciation · 4.68% rent growth · sell at horizon
- IRR
- 20.9%
- Equity multiple
- 2.71×
- Total profit
- $171,955
- Equity at exit
- $324,317
- IRR
- 19.4%
- Equity multiple
- 6.38×
- Total profit
- $541,951
- Equity at exit
- $699,401
Cash invested: $100,800 (down + closing). Projections, not guarantees.
Landlord ↔ Tenant lean methodology
- Overall (STATE)
- 18 Strongly Tenant-Friendly
- State California
- 18 Strongly Tenant-Friendly · D+13
- County
- — inherits STATE
- City
- — inherits STATE
ZIP-level market 92301
- Home prices YoY
- 10.0%
- Rents YoY
- 4.7%
- Active inventory
- 615
- Price-to-rent
- 19.4×
Monthly cashflow live
- Estimated rent
- $3,098 high interval (Pro) →
- Mortgage (P&I)
- −$1,888
- Tax est. 1.5%
- −$450 /mo · $5,400/yr
- Insurance
- −$150
- Flood insurance flood zone
- −$427 /mo · $5,118/yr
- HOA
- −$0
- Vacancy / Maint / Mgmt
- −$651
- Net cashflow
- $-467
Break-even live
2-unit breakdown (identical units grouped — click to expand)
| Units | Beds | Baths | Est. rent |
|---|---|---|---|
| 2× units | 2 | 1 | $3,098 |
| #1 | 2 | 1 | $1,549 |
| #2 | 2 | 1 | $1,549 |
| Total (2 units) | $3,098 | ||
UW: 25.0% down · 7.5% · 30yr · 1.5% tax · 5.0% vac · 8.0% maint · 8.0% mgmt
Financing live
Cash to close
- Down payment
- $90,000
- Closing costs
- $10,800
- Reserves months
- —
- Total cash needed
- —
Loan-product check · same deal, 3 products live
Conventional
25% down · 7.5% · 30yr
- Down + closing
- —
- Monthly P&I
- —
- Monthly cashflow
- —
- DSCR
- —
- Eligible?
- —
Personal DTI + credit; lowest rate.
DSCR
20% down · 8.5% · 30yr
- Down + closing
- —
- Monthly P&I
- —
- Monthly cashflow
- —
- DSCR
- —
- Eligible?
- —
No personal income docs; deal must DSCR.
Hard money
10% down · 12.0% · 12mo
- Down + closing
- —
- Monthly P&I
- —
- Monthly cashflow
- —
- DSCR
- —
- Eligible?
- —
Short-term bridge; refi at stabilization.
Rent comps 1 comps
| Address | Beds | Baths | Sqft | Rent | $/sqft | DOM | Units | Dist |
|---|---|---|---|---|---|---|---|---|
| 11715 Lee Ave Adelanto, CA | 3.0 | 3.0 | 1916 | $3,195 | $1.67 | 1d | 1 | 0.47mi |
Listing history 28 events
-
2026-06-18days on market $360,000 Active 153 DOM
-
2026-06-17days on market $360,000 Active 152 DOM
-
2026-06-16days on market $360,000 Active 151 DOM
-
2026-06-15days on market $360,000 Active 150 DOM
-
2026-06-13days on market $360,000 Active 148 DOM
-
2026-06-09days on market $360,000 Active 144 DOM
-
2026-06-08days on market $360,000 Active 143 DOM
-
2026-06-07days on market $360,000 Active 142 DOM
-
2026-06-04days on market $360,000 Active 139 DOM
-
2026-06-03days on market $360,000 Active 138 DOM
-
2026-06-02days on market $360,000 Active 137 DOM
-
2026-06-01days on market $360,000 Active 136 DOM
-
2026-05-31days on market $360,000 Active 135 DOM
-
2026-05-19status Active
-
2026-04-02historical Active Under Contract
-
2026-01-16$360,000 Active
-
2010-03-19soldstatus $22,000 204-char remark
Show marketing remark (204 chars)
Bank Owned Property. Sold AS-IS. Single Story Duplex in North Adelanto. Close to SCLA. Each unit is 2 bedroom, 1 bath, single attached garage. This property is being sold in its present condition. (AS-IS)
-
2009-03-19historical
-
2009-03-13price $49,900
-
2009-02-10price $54,900
-
2008-11-12$72,900
-
2008-01-01historical
-
2008-01-01historical
-
2007-06-15$180,000
-
2007-06-15$180,000
-
2006-07-24soldstatus $239,000
-
2006-07-24soldstatus $240,000
-
2004-11-23soldstatus $125,000
ⓘ Source: listings_history table (triggers on properties + properties_extension) + one-shot
backfill from property_details.listing_events for pre-trigger history.
Climate risk First Street
- Flood 3/10 Moderate FEMA zone AE · 10% chance over 30 yrs
- Wildfire 4/10 Moderate
- Heat 7/10 Severe 6 d/yr ≥99°F today · 15 d/yr by 30 yrs out
- Wind 1/10 Low
- Air quality 8/10 Severe 16 unhealthy d/yr today · 20 by 30 yrs out
Nearby sold comps map
Loading sold comps map…
Walkable amenities ~0.75 mi
Loading nearby amenities…
Taxation est. · year 1
- Rental income
- $37,176
- − Mortgage interest
- −$20,166
- − Property taxes
- −$5,400
- − Insurance
- −$6,919
- − Repairs & maintenance
- −$2,974
- − Management
- −$2,974
- − Depreciation
- −$10,473
- Taxable loss
- −$11,729
- Est. tax savings @ 24.0%
- +$2,815
- After-tax cash flow
- $-2,789/yr
For passive investors: Depreciation is non-cash, so a rental often shows a tax loss while cash-flowing — sheltering income. Rental losses are passive: they offset passive income freely, and up to $25,000/yr can offset ordinary (W-2) income if you actively participate and your MAGI is under $100k (phasing out to $0 by $150k); unused losses carry forward. On sale, claimed depreciation is recaptured at up to 25%, and gains may owe capital-gains tax (a 1031 exchange can defer both). Figures are a year-1 estimate at your 24.0% rate — not tax advice; consult a CPA.
Schools (NCES district)
- District
- Victor Valley Union High
- NCES district ID
- 0636972
- Math proficiency
- 25% ▲ 6.00%
- Reading proficiency
- 25% ▼ -12.00%
- Median HH income
- $45,112
- Composite
- 21.6/100
- National rank
- #8296
- State rank
- #407 of 517 in CA
Livability — Adelanto
- Score
- 47/100
- State rank
- #1250
- US rank
- #26338
Category grades
Schools grade is shown separately in the Schools card above.
Census & demographics
- Census place
- Adelanto, CA
- County
- San Bernardino County · 2,030,291 people
- City population
- 38,577
- Metro
- Riverside-San Bernardino-Ontario, CA
- Population (ZIP)
- 38,577
- Household income
- $68,676
- Rent vs Own
- Severe rent burden
- 1345.0
Population outlook (San Bernardino County) Hauer SSP2
- Today (2025)
- 2,300,329 people
- By 2030
- 2,378,907 · +3.4%
- By 2040
- 2,523,137 · +9.7%
- By 2050
- 2,642,388 · +14.9%
- By 2075
- 2,880,769 · +25.2%
- By 2100
- 2,909,436 · +26.5%
Race, ethnicity, and origin ACS 2023
- Neighborhood character
- Predominantly Hispanic (69%)
- Race & ethnicity
- Hispanic / Latino 69% Two or more races 34% Black 15% White 9% Asian 2% Native American 1%
- Hispanic origin (detail)
- Mexican 58%
- Foreign-born
- 18% · Canada
- Languages at home
- 52% English-only · Spanish 46%
Political lean MEDSL · San Bernardino
- 2024 margin
- Toss-up / Even · D 47.5% · R 49.7% · Other 2.8%
- 2008→2024 swing
- -8.5pp toward R · 2008: 6.3pp · 2024: -2.1pp
- All cycles
- 2024: R+2.1 2020: D+10.7 2016: D+9.8 2012: D+5.4 2008: D+6.3
Not yet ingested
- Civics
- —
Market trends
- HPI YoY
- ▲ 41.09%
- Current HPI
- 453.6071
- Rent YoY
- ▲ 4.68%
- Metro
- Riverside-San Bernardino-Ontario, CA
- State GDP YoY
- ▲ 3.21%
- F500 in state
- 116
Industry mix (Fortune 500 HQ in CA)
| Industry | F500 HQs | Revenue |
|---|---|---|
| Technology | 27 | $1,492B |
|
||
| Financial Services | 3 | $174B |
|
||
| Retail | 3 | $44B |
|
||
| Insurance | 3 | $26B |
|
||
| Media / Entertainment | 2 | $115B |
|
||
| Pharmaceuticals / Biotech | 2 | $62B |
|
||
Price history
+188.0% since first listed15 events — show timeline
- 2026-05-19 Relisted — CRMLS
- 2026-04-02 Contingent — CRMLS
- 2026-01-16 Listed $360,000 CRMLS
- 2010-03-19 Sold (MLS) $22,000 CRMLS
- 2009-03-19 Listing Removed — CRMLS
- 2009-03-13 Price Changed $49,900 CRMLS
- 2009-02-10 Price Changed $54,900 CRMLS
- 2008-11-12 Listed $72,900 CRMLS
- 2008-01-01 Listing Removed — CRMLS
- 2008-01-01 Listing Removed — CRMLS
- 2007-06-15 Listed $180,000 CRMLS
- 2007-06-15 Listed $180,000 CRMLS
- 2006-07-24 Sold (Public Records) $240,000 Public Records
- 2006-07-24 Sold (MLS) $239,000 CRMLS
- 2004-11-23 Sold (Public Records) $125,000 Public Records
Property tax history
-9.6%/yrLatest (2025): $490 · +7.0% YoY. Source: county tax records.
Cash-flow waterfall
monthlySold comps — $/sqft
last 12 mo · ≤1 miLoading sold comps…