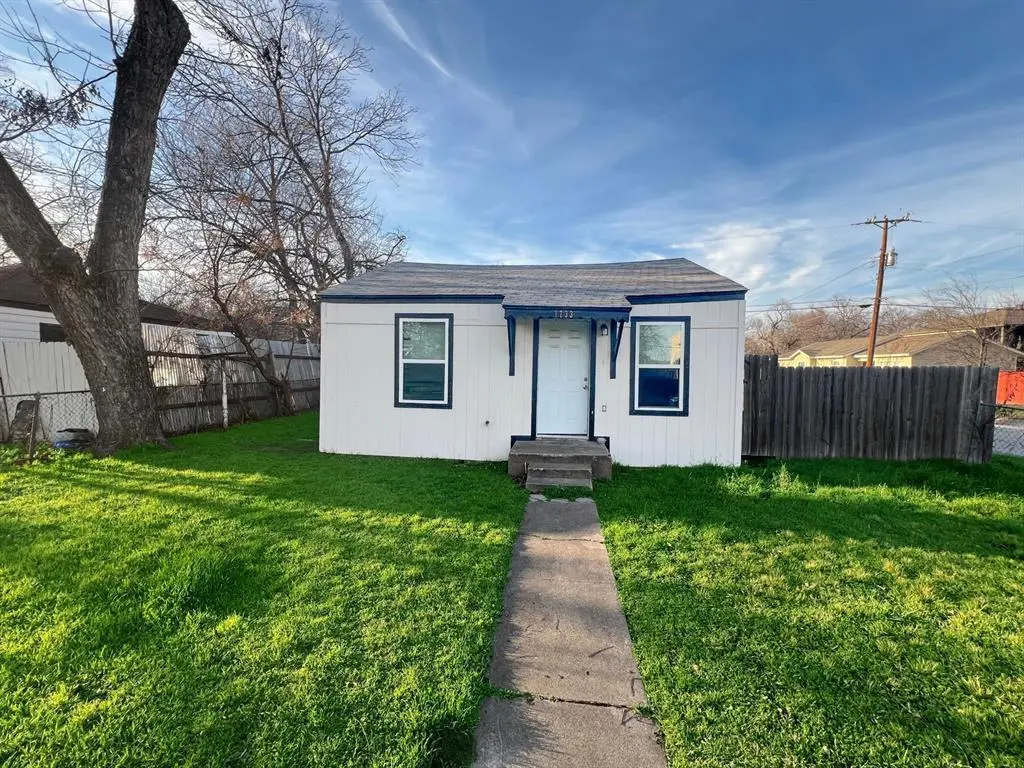
1733 Greenfield Ave · Fort Worth, TX
Flood risk 6/10 · Moderate
- FEMA flood zone
- X
- Chance of flooding over 30 yrs
- 0.27%
- Est. flood insurance / yr
- $507 – $1,088
Fire risk 1/10 · Minimal
- Est. fire insurance / yr
- $1,222 – $2,270
Heat risk 8/10 · Major
- Hot days now (above 109°F)
- 7 days/yr
- Hot days in 30 yrs
- 23 days/yr
Wind risk 4/10 · Minor
- Chance of severe wind over 30 yrs
- 24.0%
Air-quality risk 4/10 · Minor
- Unhealthy air days now
- 4 days/yr
- Unhealthy air days in 30 yrs
- 5 days/yr
Risk factors via First Street. Map © Google.
Why this score? — see what drove the A- grade
The composite is a weighted blend of 9 inputs, each scored 0–100. Each bar is that input's sub-score; the figure is the points it added to the 100-point composite (weight × sub-score).
- Cash flow +30.0/30.0
- ARV discount +15.0/15.0
- 1% rule +10.0/10.0
- DSCR +10.0/10.0
- Appreciation +4.3/10.0
- Livability +4.0/5.0
- Rent growth +3.5/5.0
- Condition / age +2.5/5.0
- Schools +2.0/10.0
$124,950
🖨 Deal sheet 📄 Offer letter ✓ Due diligence
Listing remarks MLS
Uptown Greenway- home is in the newly developed area of Greenway Place, 1.5 miles from Downtown. Walk-bike to Top Golf, Panther Island, Coyote Drive-In, Martin House Brewery via the Trinity Trails! Owner financing available; owner is flexible and willing to work with developers. One of more than 20 lots coming available in the immediate subdivision. Home needs work but a good fit for someone who can fix it up themselves or looking for a starter home.
Key facts
- Uptown greenway
- Greenway place
- Panther island
Tags
Property features AI
Finance
- Other: Possession at closing/funding; Special listing condition: Third party approval
- Financial info: Listing terms include Cash, Conventional, FHA-203K
- HOA & community: No homeowners association
Exterior
- Parking: Driveway parking; On-street parking
- Utilities: City water; City sewer; Municipal Utility District: No
- Home design: Single family residence; Single-story
- Construction: Built in 1945
- Exterior features: Lot under 0.5 acre (about 0.115 acre); Subdivision: Greenway Place Add
Interior
- Kitchen: Electric cooktop; Kitchen (level 1) — approx. 6 x 10
- Bedrooms: Primary bedroom (level 1) — approx. 13 x 15; Bedroom (level 1) — approx. 8 x 8; Bedroom (level 1) — approx. 8 x 8
- Bathrooms: Two full bathrooms; Primary bathroom (level 1) — approx. 4 x 6; Bathroom (level 1) — approx. 4 x 6
- Interior features: Seven total rooms; One living area; One level (single-story); Other interior features
Neighborhood map
What this means for you Summary
Snapshot
- This is a 2-bed/1.0-bath single-family listed at $125k.
Deal economics
- At list price, monthly cash flow is $472 ($6k/yr) — positive.
- The deal already cash-flows at list — no discount required.
- Meets the 1% rule at list price ($2k rent vs $125k).
- Recommended offer: $121k (3.0% below list) — sets the bar for market timing.
- Cap rate 10.8% vs local median 3.9% in Fort Worth — top-decile yield for the area; either an underpriced asset or a hidden risk that comps aren't pricing in. Stress-test before assuming the spread holds.
Location & tenants
- Location reads 80/100 on livability (#49 in TX, #1,954 nationally) — a professional / high-income tenant draw. Strengths: amenities A+, cost of living A+, housing A+; Watch: crime F.
- Fort Worth ISD (urban): math 18% / reading 28% proficiency, ranked #742 of 826 in TX (top 90%) — low school quality limits family demand, transient renter base, plan for 1-2y turnover; 73% free/reduced lunch — lower-income household profile, screen leases tightly.
- Zoned schools: Charles Nash El (math 12% / reading 22%, grade F, #3,836 of 4,322 statewide, top 91%, 223 students, 90% FRL) — zoned schools average 90% FRL vs 73% district-wide (17 pts higher); higher-poverty schools than district average — tighter screening recommended.
- Market conditions: Rents rising (+3.8%/yr); 62 active listings in the ZIP; 32 comparable units currently listed for rent nearby; rentals leasing fast (median 3d on market — plan ~1-2 weeks tenant-placement turnaround); solid renter incomes; 18,938 units permitted in Tarrant County in 2024 (8,336 in 5+ unit buildings).
Forward outlook
- Local home prices are declining (-1.4%/yr); year-one equity from $864 of loan paydown is wiped out by about $2k of value loss. Plan a longer hold.
- Tarrant County population projected at +41% by 2050 — long-run rental-demand tailwind backs the buy-and-hold thesis.
- At projected returns (-1.4% appreciation + 3.8% rent growth), your $35k cash investment doubles in ~6 years — after that, you're playing with house money.
Negotiation context
- It's been on market 47 days — a 3% lower offer ($121k) is reasonable based on typical stale-listing flexibility.
- 3 sale attempts since 9y ago with the ask held roughly flat each time — persistent listings suggest the price (not the market) is what's stuck; bring a comps-based counter.
Risks & watch-outs
- Watch-outs: property tax is 2.9% of price; built in 1945 — expect roof / HVAC / electrical / plumbing capex.
- Climate carrying-cost: major flood risk; extreme-heat days projected 7→23/yr by 2055 (HVAC capex compounding) — expect insurance premiums to compound above CPI over the hold.
Questions for the listing agent
- It's been on market 47 days. Have you received any prior offers? Is the seller open to a 3% concession, seller financing, or rate buy-down credit?
- Built in 1945 — when were the roof, HVAC, electrical panel, plumbing, and water heater last replaced?
- Property tax is high relative to price — has the assessment been appealed recently, and will the sale trigger a re-assessment?
- Is there a deadline driving the sale (1031 exchange, divorce, estate, relocation)? That informs how much negotiation room exists.
- Schools are D-rated, which usually means shorter tenancies and higher turnover. Who's the typical renter profile here, and what's been the actual vacancy rate?
- Crime grade is F in this area — have there been break-ins, vandalism, or insurance claims at this property in the last 3 years? What carrier currently insures it and at what premium?
- What's the average days-on-market for RENTAL listings here right now (not sales)? A rising rental-DOM trend means longer vacancies and softer asking-rent achievability than the comps imply.
- What's the recent tenant-quality profile in this submarket — average credit score on applications, eviction rate, late-payment / NSF rate, and stable-employment percentage? A property-management company in the area should have these aggregated.
- How much new for-sale + rental construction is in the pipeline within 1–3 miles? Heavy new supply typically softens prices + rents 12–24 months out; constrained supply supports both.
Investment metrics
- 1% rule
- 1.50% ✓
- Cap rate
- 10.83%
- Cash-on-cash
- 16.20%
- DSCR
- 1.72
- GRM
- 5.6
CMA / ARV
- ARV (on-the-fly)
- $174,840
- Comps found
- 3
Show comp detail 3 sales within ~0.75 mi
| Address | Dist | Beds/Ba | Sqft | Sold | Price | $/sf | Match |
|---|---|---|---|---|---|---|---|
| 1733 Greenfield Ave | 0.00mi | 3/2.0 (+1) | 744 (0%) | 1mo | $124,950 | $168 | 90 |
| 1836 Carver Ave | 0.13mi | 2/1.0 | 724 (-3%) | 0mo | $169,900 | $235 | 89 |
| 1932 Greenfield Ave | 0.21mi | 2/1.0 | 650 (-13%) | 3mo | $164,900 | $254 | 67 |
Match score weights: distance 35% · size 25% · config 20% · recency 20%. Top-matched comps best support the ARV.
Projected returns pro-forma
-1.4% appreciation · 3.82% rent growth · sell at horizon
- IRR
- 12.9%
- Equity multiple
- 1.58×
- Total profit
- $20,139
- Equity at exit
- $27,806
- IRR
- 20.1%
- Equity multiple
- 3.04×
- Total profit
- $71,198
- Equity at exit
- $27,236
Cash invested: $34,986 (down + closing). Projections, not guarantees.
Landlord ↔ Tenant lean methodology
- Overall (STATE)
- 87 Strongly Landlord-Friendly
- State Texas
- 87 Strongly Landlord-Friendly · R+5
- County
- — inherits STATE
- City
- — inherits STATE
ZIP-level market 76102
- Home prices YoY
- -0.7%
- Rents YoY
- 3.8%
- Active inventory
- 62
- Price-to-rent
- 5.6×
Monthly cashflow live
- Estimated rent
- $1,876 high interval (Pro) →
- Mortgage (P&I)
- −$655
- Tax from tax record
- −$302 /mo · $3,626/yr
- Insurance
- −$52
- HOA
- −$0
- Vacancy / Maint / Mgmt
- −$394
- Net cashflow
- $472
Break-even live
UW: 25.0% down · 7.5% · 30yr · 1.5% tax · 5.0% vac · 8.0% maint · 8.0% mgmt
Financing live
Cash to close
- Down payment
- $31,238
- Closing costs
- $3,748
- Reserves months
- —
- Total cash needed
- —
Loan-product check · same deal, 3 products live
Conventional
25% down · 7.5% · 30yr
- Down + closing
- —
- Monthly P&I
- —
- Monthly cashflow
- —
- DSCR
- —
- Eligible?
- —
Personal DTI + credit; lowest rate.
DSCR
20% down · 8.5% · 30yr
- Down + closing
- —
- Monthly P&I
- —
- Monthly cashflow
- —
- DSCR
- —
- Eligible?
- —
No personal income docs; deal must DSCR.
Hard money
10% down · 12.0% · 12mo
- Down + closing
- —
- Monthly P&I
- —
- Monthly cashflow
- —
- DSCR
- —
- Eligible?
- —
Short-term bridge; refi at stabilization.
Rent comps 32 comps
| Address | Beds | Baths | Sqft | Rent | $/sqft | DOM | Units | Dist |
|---|---|---|---|---|---|---|---|---|
| 701 N Hampton St Fort Worth, TX | 1.0–2.0 | 1.0–2.0 | 866 | $2,351 | $2.71 | 2d | 25 | 0.41mi |
| 769 Samuels Ave Fort Worth, TX | 1.0–3.0 | 1.0–3.0 | 1113 | $2,044 | $1.84 | 3d | 27 | 0.50mi |
| 637 Samuels Ave Fort Worth, TX | 2.0 | 1.0–2.0 | 1045 | $2,544 | $2.43 | 2d | 17 | 0.55mi |
| 520 Samuels Ave Fort Worth, TX | 3.0 | 1.0–2.0 | 1073 | $1,948 | $1.82 | 2d | 19 | 0.59mi |
| 999 Scenic Hill Dr Fort Worth, TX | 2.0 | 1.0–2.5 | 1077 | $2,896 | $2.69 | 2d | 19 | 0.64mi |
| 2413 Race St Fort Worth, TX | 2.0 | 1.0–2.0 | 849 | $1,949 | $2.30 | 2d | 13 | 0.71mi |
| 1852 E Northside Dr Unit 1867 Fort Worth, TX | 1.0 | 1.0 | 691 | $1,417 | $2.05 | 3d | 1 | 0.73mi |
| 1852 E Northside Dr Unit 1873 Fort Worth, TX | 1.0 | 1.0 | 691 | $1,305 | $1.89 | 44d | 1 | 0.73mi |
| 1852 E Northside Dr Unit 1867 Fort Worth, TX | 1.0 | 1.0 | 691 | $1,345 | $1.95 | 15d | 1 | 0.73mi |
| 1852 E Northside Dr Unit 412 Fort Worth, TX | 1.0 | 1.0 | 691 | $1,340 | $1.94 | 14d | 1 | 0.73mi |
| 1852 E Northside Dr Unit 1894 Fort Worth, TX | 1.0 | 1.0 | 594 | $1,312 | $2.21 | 3d | 1 | 0.73mi |
| 2001 E 4th St Unit 11006 Fort Worth, TX | 1.0 | 1.0 | 584 | $1,290 | $2.21 | 44d | 1 | 0.74mi |
| 2001 E 4th St Fort Worth, TX | 2.0 | 1.0–2.0 | 872 | $2,724 | $3.12 | 21d | 42 | 0.74mi |
| 2001 E 4th St Fort Worth, TX | 2.0 | 1.0–2.0 | 872 | $2,759 | $3.16 | 2d | 121 | 0.74mi |
| 336 Oakhurst Scenic Dr Fort Worth, TX | 2.0 | 1.0–2.0 | 939 | $2,085 | $2.22 | 2d | 29 | 0.75mi |
| 1852 E Northside Dr Fort Worth, TX | 1.0 | 1.0 | 691 | $1,700 | $2.46 | 21d | 1 | 0.75mi |
| 1852 E Northside Dr Fort Worth, TX | 1.0 | 1.0 | 691 | $1,600 | $2.32 | 44d | 1 | 0.75mi |
| 100 Harding St Fort Worth, TX | 2.0 | 1.0–2.0 | 869 | $2,665 | $3.06 | 2d | 68 | 0.78mi |
| 701 E Bluff St Fort Worth, TX | 2.0 | 1.0–2.5 | 975 | $2,440 | $2.50 | 2d | 44 | 0.78mi |
| 1401 Oakhurst Scenic Dr Fort Worth, TX | 1.0 | 1.0 | 691 | $1,194 | $1.73 | 44d | 1 | 0.79mi |
| 301 Nichols St Fort Worth, TX | 2.0 | 1.0 | 610 | $2,057 | $3.37 | 6d | 4 | 0.79mi |
| 329 Blandin St Unit 1514811P Fort Worth, TX | 1.0 | 1.0 | 699 | $2,815 | $4.03 | 3d | 1 | 0.92mi |
| 447 N Main St Fort Worth, TX | 1.0–2.0 | 1.0–2.0 | 955 | $2,383 | $2.50 | 3d | 12 | 0.99mi |
| 2900 Race St Fort Worth, TX | 2.0 | 1.0–2.0 | 959 | $1,899 | $1.98 | 2d | 21 | 1.02mi |
| 555 Elm St Fort Worth, TX | 2.0 | 1.0–2.0 | 893 | $2,390 | $2.67 | 3d | 28 | 1.03mi |
| 901 Commerce St Fort Worth, TX | 1.0 | 1.0 | 681 | $894 | $1.31 | 44d | 1 | 1.31mi |
| 969 Commerce St Fort Worth, TX | 1.0–3.0 | 1.0–3.0 | 1425 | $5,514 | $3.87 | 1d | 68 | 1.32mi |
| 910 Houston St #301 Fort Worth, TX | 1.0 | 1.0 | 637 | $1,600 | $2.51 | 5d | 1 | 1.43mi |
| 410 W 7th St Unit 461 Fort Worth, TX | 1.0 | 1.0 | 659 | $1,142 | $1.73 | 44d | 1 | 1.46mi |
| 410 W 7th St Unit 431 Fort Worth, TX | 1.0 | 1.0 | 659 | $1,147 | $1.74 | 14d | 1 | 1.46mi |
| 410 W 7th St Fort Worth, TX | 1.0 | 1.0 | 659 | $1,142 | $1.73 | 14d | 1 | 1.46mi |
| 410 W 7th St Unit 425 Fort Worth, TX | 1.0 | 1.0 | 611 | $1,442 | $2.36 | 3d | 1 | 1.46mi |
Listing history 20 events
-
2026-05-11status Pending
-
2026-04-21historical Active Option Contract
-
2026-03-25$124,950 Active
-
2023-05-09soldstatus
-
2023-03-30soldstatus
-
2019-05-07soldstatus Sold 454-char remark
Show marketing remark (454 chars)
Uptown Greenway- home is in the newly developed area of Greenway Place, 1.5 miles from Downtown. Walk-bike to Top Golf, Panther Island, Coyote Drive-In, Martin House Brewery via the Trinity Trails! Owner financing available; owner is flexible and willing to work with developers. One of more than 20 lots coming available in the immediate subdivision. Home needs work but a good fit for someone who can fix it up themselves or looking for a starter home.
-
2019-05-07soldstatus
Show marketing remark (454 chars)
Uptown Greenway- home is in the newly developed area of Greenway Place, 1.5 miles from Downtown. Walk-bike to Top Golf, Panther Island, Coyote Drive-In, Martin House Brewery via the Trinity Trails! Owner financing available; owner is flexible and willing to work with developers. One of more than 20 lots coming available in the immediate subdivision. Home needs work but a good fit for someone who can fix it up themselves or looking for a starter home.
-
2019-05-01status Pending 454-char remark
Show marketing remark (454 chars)
Uptown Greenway- home is in the newly developed area of Greenway Place, 1.5 miles from Downtown. Walk-bike to Top Golf, Panther Island, Coyote Drive-In, Martin House Brewery via the Trinity Trails! Owner financing available; owner is flexible and willing to work with developers. One of more than 20 lots coming available in the immediate subdivision. Home needs work but a good fit for someone who can fix it up themselves or looking for a starter home.
-
2019-04-24historical Active Option Contract 454-char remark
Show marketing remark (454 chars)
Uptown Greenway- home is in the newly developed area of Greenway Place, 1.5 miles from Downtown. Walk-bike to Top Golf, Panther Island, Coyote Drive-In, Martin House Brewery via the Trinity Trails! Owner financing available; owner is flexible and willing to work with developers. One of more than 20 lots coming available in the immediate subdivision. Home needs work but a good fit for someone who can fix it up themselves or looking for a starter home.
-
2019-03-20$84,900 Active 454-char remark
Show marketing remark (454 chars)
Uptown Greenway- home is in the newly developed area of Greenway Place, 1.5 miles from Downtown. Walk-bike to Top Golf, Panther Island, Coyote Drive-In, Martin House Brewery via the Trinity Trails! Owner financing available; owner is flexible and willing to work with developers. One of more than 20 lots coming available in the immediate subdivision. Home needs work but a good fit for someone who can fix it up themselves or looking for a starter home.
-
2017-05-09soldstatus Sold 317-char remark
Show marketing remark (317 chars)
Roomy 3 bedroom 1 bath home with large backyard. Garage conversion for additional square footage that does not reflect in tax records. Driveway to backyard offers plenty of off street parking. Real close to 35 S Freeway. Minutes from downtown Fort Worth. Buyer to verify all info including schools & room sizes.
-
2017-05-02soldstatus
-
2017-04-06status Pending 317-char remark
Show marketing remark (317 chars)
Roomy 3 bedroom 1 bath home with large backyard. Garage conversion for additional square footage that does not reflect in tax records. Driveway to backyard offers plenty of off street parking. Real close to 35 S Freeway. Minutes from downtown Fort Worth. Buyer to verify all info including schools & room sizes.
-
2017-03-27historical Active Option Contract 317-char remark
Show marketing remark (317 chars)
Roomy 3 bedroom 1 bath home with large backyard. Garage conversion for additional square footage that does not reflect in tax records. Driveway to backyard offers plenty of off street parking. Real close to 35 S Freeway. Minutes from downtown Fort Worth. Buyer to verify all info including schools & room sizes.
-
2017-02-13price $69,999 317-char remark
Show marketing remark (317 chars)
Roomy 3 bedroom 1 bath home with large backyard. Garage conversion for additional square footage that does not reflect in tax records. Driveway to backyard offers plenty of off street parking. Real close to 35 S Freeway. Minutes from downtown Fort Worth. Buyer to verify all info including schools & room sizes.
-
2017-01-12$80,000 Active 317-char remark
Show marketing remark (317 chars)
Roomy 3 bedroom 1 bath home with large backyard. Garage conversion for additional square footage that does not reflect in tax records. Driveway to backyard offers plenty of off street parking. Real close to 35 S Freeway. Minutes from downtown Fort Worth. Buyer to verify all info including schools & room sizes.
-
2014-05-05soldstatus
-
2013-06-21soldstatus
-
2002-03-21soldstatus
-
1992-05-05soldstatus
ⓘ Source: listings_history table (triggers on properties + properties_extension) + one-shot
backfill from property_details.listing_events for pre-trigger history.
Tax reassessment forecast TX · Resets to sale price
- Current annual tax
- $3,626 · $302/mo
- Projected year-2 tax
- $3,626 · $302/mo
- Expected delta
- $0/yr ($0/mo · 0.0%)
ⓘ Screening estimate from a state-policy table — verify with the county assessor before closing.
Climate risk First Street
- Flood 6/10 Major FEMA zone X · 27% chance over 30 yrs
- Wildfire 1/10 Low
- Heat 8/10 Severe 7 d/yr ≥109°F today · 23 d/yr by 30 yrs out
- Wind 4/10 Moderate 24% chance of damaging wind over 30 yrs
- Air quality 4/10 Moderate 4 unhealthy d/yr today · 5 by 30 yrs out
Nearby sold comps map
Loading sold comps map…
Walkable amenities ~0.75 mi
Loading nearby amenities…
Taxation est. · year 1
- Rental income
- $22,508
- − Mortgage interest
- −$6,999
- − Property taxes
- −$3,626
- − Insurance
- −$625
- − Repairs & maintenance
- −$1,801
- − Management
- −$1,801
- − Depreciation
- −$3,635
- Taxable income
- $4,022
- Est. tax owed @ 24.0%
- −$965
- After-tax cash flow
- $4,703/yr
For passive investors: Depreciation is non-cash, so a rental often shows a tax loss while cash-flowing — sheltering income. Rental losses are passive: they offset passive income freely, and up to $25,000/yr can offset ordinary (W-2) income if you actively participate and your MAGI is under $100k (phasing out to $0 by $150k); unused losses carry forward. On sale, claimed depreciation is recaptured at up to 25%, and gains may owe capital-gains tax (a 1031 exchange can defer both). Figures are a year-1 estimate at your 24.0% rate — not tax advice; consult a CPA.
Schools (NCES district)
- District
- Fort Worth ISD
- NCES district ID
- 4819700
- Math proficiency
- 18% ▼ -16.00%
- Reading proficiency
- 28% ▼ -6.00%
- Median HH income
- $42,109
- Composite
- 19.61/100
- National rank
- #8753
- State rank
- #742 of 826 in TX
Livability — Fort Worth
- Score
- 80/100
- State rank
- #49
- US rank
- #1954
Category grades
Schools grade is shown separately in the Schools card above.
Census & demographics
- Census place
- Fort Worth, TX
- County
- Tarrant County · 2,033,669 people
- City population
- 911,619
- Metro
- Dallas-Fort Worth-Arlington, TX
- Population (ZIP)
- 11,895
- Household income
- $75,859
- Rent vs Own
- Severe rent burden
- 946.0
Population outlook (Tarrant County) Hauer SSP2
- Today (2025)
- 2,380,417 people
- By 2030
- 2,578,900 · +8.3%
- By 2040
- 2,974,995 · +25.0%
- By 2050
- 3,350,489 · +40.8%
- By 2075
- 4,216,909 · +77.2%
- By 2100
- 4,741,527 · +99.2%
Race, ethnicity, and origin ACS 2023
- Neighborhood character
- Diverse neighborhood (Simpson 0.63)
- Race & ethnicity
- White 54% Black 21% Hispanic / Latino 20% Two or more races 11% Asian 2%
- Hispanic origin (detail)
- Mexican 13% Puerto Rican 1%
- Common ancestry
- Lithuanian 2% Slovak 1% Serbian 1%
- Foreign-born
- 9% · Canada
- Languages at home
- 83% English-only · Spanish 12% Other Indo-European 1% Other Asian/Pacific 1%
Political lean MEDSL · Tarrant
- 2024 margin
- Lean R (+5.1) · D 46.7% · R 51.9% · Other 1.4%
- 2008→2024 swing
- +6.6pp toward D · 2008: -11.7pp · 2024: -5.1pp
- All cycles
- 2024: R+5.1 2020: D+0.2 2016: R+8.7 2012: R+15.7 2008: R+11.7
Not yet ingested
- Civics
- —
Market trends
- HPI YoY
- ▼ -1.40%
- Current HPI
- 207.2261
- Rent YoY
- ▲ 3.82%
- Metro
- Dallas-Fort Worth-Arlington, TX
- State GDP YoY
- ▲ 3.95%
- F500 in state
- 110
Industry mix (Fortune 500 HQ in TX)
| Industry | F500 HQs | Revenue |
|---|---|---|
| Energy | 16 | $1,198B |
|
||
| Technology | 5 | $198B |
|
||
| Engineering / Construction | 4 | $72B |
|
||
| Energy Services | 3 | $60B |
|
||
| Utilities | 3 | $41B |
|
||
| Healthcare | 2 | $330B |
|
||
Price history
+56.2% since first listed20 events — show timeline
- 2026-05-11 Pending — NTREIS
- 2026-04-21 Contingent — NTREIS
- 2026-03-25 Listed $124,950 NTREIS
- 2023-05-09 Sold (Public Records) — Public Records
- 2023-03-30 Sold (Public Records) — Public Records
- 2019-05-07 Sold (Public Records) — Public Records
- 2019-05-07 Sold (MLS) — NTREIS
- 2019-05-01 Pending — NTREIS
- 2019-04-24 Contingent — NTREIS
- 2019-03-20 Listed $84,900 NTREIS
- 2017-05-09 Sold (MLS) — NTREIS
- 2017-05-02 Sold (Public Records) — Public Records
- 2017-04-06 Pending — NTREIS
- 2017-03-27 Contingent — NTREIS
- 2017-02-13 Price Changed $69,999 NTREIS
- 2017-01-12 Listed $80,000 NTREIS
- 2014-05-05 Sold (Public Records) — Public Records
- 2013-06-21 Sold (Public Records) — Public Records
- 2002-03-21 Sold (Public Records) — Public Records
- 1992-05-05 Sold (Public Records) — Public Records
Property tax history
+17.1%/yrLatest (2025): $3,626 · -2.4% YoY. Source: county tax records.
Cash-flow waterfall
monthlySold comps — $/sqft
last 12 mo · ≤1 miLoading sold comps…