 Duplex
715 Spruce St · Piedmont, MO
Flood risk 7/10 · Major
- FEMA flood zone
- X (unshaded)
- Chance of flooding over 30 yrs
- 0.99%
- Est. flood insurance / yr
- $507 – $1,088
Fire risk 5/10 · Moderate
- Est. fire insurance / yr
- $1,054 – $1,958
Heat risk 6/10 · Moderate
- Hot days now (above 107°F)
- 7 days/yr
- Hot days in 30 yrs
- 21 days/yr
Wind risk 2/10 · Minimal
- Chance of severe wind over 30 yrs
- 3.0%
Air-quality risk 1/10 · Minimal
- Unhealthy air days now
- 0 days/yr
- Unhealthy air days in 30 yrs
- 0 days/yr
Risk factors via First Street. Map © Google.
Why this score? — see what drove the B grade
The composite is a weighted blend of 9 inputs, each scored 0–100. Each bar is that input's sub-score; the figure is the points it added to the 100-point composite (weight × sub-score).
- Cash flow +30.0/30.0
- 1% rule +10.0/10.0
- DSCR +10.0/10.0
- Appreciation +7.9/10.0
- ARV discount +7.5/15.0
- Schools +2.7/10.0
- Livability +2.6/5.0
- Rent growth +2.5/5.0
- Condition / age +1.0/5.0
$74,900
🖨 Deal sheet 📄 Offer letter ✓ Due diligence
Multi-family units
County records classify this as Multi-Family (2-4 Unit). Listing-text estimate: 2 units. confirmed
Listing remarks MLS
Investment Opportunity – Duplex with Strong Income Potential Great opportunity to add to your rental portfolio! This duplex features two spacious 2-bedroom units, each offering approximately 916 sq ft of living space. Each unit currently rents for $400/month Total current income: $800/month Well-sized layouts with solid rental potential. Even better, the seller also has 3 additional duplexes available and is willing to offer a package deal for all properties, making this an excellent opportunity for investors looking to scale quickly. Don’t miss your chance to secure multiple income-producing properties in one deal!
Key facts
- 7,840 sq ft lot
- Built 1940
- Listed 91 days
Neighborhood map
What this means for you Summary
Snapshot
- This is a 2 × 2-bed/1.0-bath units multifamily listed at $75k. Condition is rated poor.
Deal economics
- At list price, monthly cash flow is $663 ($8k/yr) — positive. Per door: $331/mo.
- The deal already cash-flows at list — no discount required.
- Meets the 1% rule at list price ($2k rent vs $75k).
- Recommended offer: $68k (9.0% below list) — sets the bar for market timing.
- Cap rate 18.0% vs local median 4.3% in Piedmont — top-decile yield for the area; either an underpriced asset or a hidden risk that comps aren't pricing in. Stress-test before assuming the spread holds.
Location & tenants
- Location reads 52/100 on livability (#854 in MO) — a working-class tenant base; expect higher turnover. Strengths: cost of living A+, housing A+; Watch: schools F, crime F, amenities F.
- Clearwater R-I (rural): math 33% / reading 33% proficiency, ranked #255 of 324 in MO (top 79%) — families likely to look elsewhere, expect single-tenant / working-renter base with shorter leases; 62% free/reduced lunch — lower-income household profile, screen leases tightly.
- Market conditions: 69 active listings in the ZIP.
Forward outlook
- In year one you build about $5k of equity ($518 loan paydown + $4k appreciation (5.9% local appreciation)).
- Wayne County population projected to shrink 9% by 2050 — rents likely to lag national; underwrite the cash flow, not the appreciation.
- At projected returns (5.9% appreciation + 3.0% rent growth), your $21k cash investment doubles in ~2 years — after that, you're playing with house money.
- By year 7, paydown + projected appreciation supports a ~$32k cash-out refi (75% LTV) — recoverable capital for the next deal without selling this one.
Negotiation context
- It's been on market 92 days — a 9% lower offer ($68k) is reasonable based on typical stale-listing flexibility.
Risks & watch-outs
- Watch-outs: flood insurance adds $66/mo; built in 1940 — expect roof / HVAC / electrical / plumbing capex.
- Climate carrying-cost: major flood risk; moderate wildfire risk; extreme-heat days projected 7→21/yr by 2055 (HVAC capex compounding) — expect insurance premiums to compound above CPI over the hold.
Questions for the listing agent
- It's been on market 92 days. Have you received any prior offers? Is the seller open to a 9% concession, seller financing, or rate buy-down credit?
- Can we see the unit-by-unit rent roll, current vacancy, and any below-market leases? What's the average tenancy length?
- What capital expenditures (roof, boiler, parking lot, exteriors) have been made in the last 5 years, and what's planned in the next 2?
- Have any recent inspections been done? Can we get a copy of the seller's disclosures and any deferred-maintenance estimates?
- Built in 1940 — when were the roof, HVAC, electrical panel, plumbing, and water heater last replaced?
- What's the actual annual flood-insurance premium (NFIP or private), and is the property in a SFHA with mandatory coverage?
- Why hasn't it sold? Are there any deal-killer items the seller is aware of (foundation, flood, title, zoning, code violations)?
- Is there a deadline driving the sale (1031 exchange, divorce, estate, relocation)? That informs how much negotiation room exists.
- Schools are F-rated, which usually means shorter tenancies and higher turnover. Who's the typical renter profile here, and what's been the actual vacancy rate?
- Crime grade is F in this area — have there been break-ins, vandalism, or insurance claims at this property in the last 3 years? What carrier currently insures it and at what premium?
- What's the average days-on-market for RENTAL listings here right now (not sales)? A rising rental-DOM trend means longer vacancies and softer asking-rent achievability than the comps imply.
- What's the recent tenant-quality profile in this submarket — average credit score on applications, eviction rate, late-payment / NSF rate, and stable-employment percentage? A property-management company in the area should have these aggregated.
- How much new apartment / multifamily construction is in the pipeline within 1–3 miles? Heavy new supply (>2% of stock underway) typically softens rents 12–24 months out; light construction supports rent growth.
Investment metrics
- 1% rule
- 2.11% ✓
- Cap rate
- 17.97%
- Cash-on-cash
- 41.71%
- DSCR
- 2.86
- GRM
- 4.0
CMA / ARV
No comps found within radius.
Projected returns pro-forma
5.89% appreciation · 3.0% rent growth · sell at horizon
- IRR
- 47.7%
- Equity multiple
- 4.02×
- Total profit
- $63,416
- Equity at exit
- $46,583
- IRR
- 44.8%
- Equity multiple
- 8.33×
- Total profit
- $153,747
- Equity at exit
- $84,046
Cash invested: $20,972 (down + closing). Projections, not guarantees.
Landlord ↔ Tenant lean methodology
- Overall (STATE)
- 81 Strongly Landlord-Friendly
- State Missouri
- 81 Strongly Landlord-Friendly · R+10
- County
- — inherits STATE
- City
- — inherits STATE
ZIP-level market 63957
- Home prices YoY
- 3.7%
- Active inventory
- 69
- Price-to-rent
- 7.9×
Monthly cashflow live
- Estimated rent
- $1,578 medium interval (Pro) →
- Mortgage (P&I)
- −$393
- Tax est. 1.5%
- −$94 /mo · $1,124/yr
- Insurance
- −$31
- Flood insurance flood zone
- −$66 /mo · $798/yr
- HOA
- −$0
- Vacancy / Maint / Mgmt
- −$331
- Net cashflow
- $663
Break-even live
2-unit breakdown (identical units grouped — click to expand)
| Units | Beds | Baths | Est. rent |
|---|---|---|---|
| 2× units | 2 | 1 | $1,578 |
| #1 | 2 | 1 | $789 |
| #2 | 2 | 1 | $789 |
| Total (2 units) | $1,578 | ||
UW: 25.0% down · 7.5% · 30yr · 1.5% tax · 5.0% vac · 8.0% maint · 8.0% mgmt
Financing live
Cash to close
- Down payment
- $18,725
- Closing costs
- $2,247
- Reserves months
- —
- Total cash needed
- —
Loan-product check · same deal, 3 products live
Conventional
25% down · 7.5% · 30yr
- Down + closing
- —
- Monthly P&I
- —
- Monthly cashflow
- —
- DSCR
- —
- Eligible?
- —
Personal DTI + credit; lowest rate.
DSCR
20% down · 8.5% · 30yr
- Down + closing
- —
- Monthly P&I
- —
- Monthly cashflow
- —
- DSCR
- —
- Eligible?
- —
No personal income docs; deal must DSCR.
Hard money
10% down · 12.0% · 12mo
- Down + closing
- —
- Monthly P&I
- —
- Monthly cashflow
- —
- DSCR
- —
- Eligible?
- —
Short-term bridge; refi at stabilization.
Listing history 15 events
-
2026-06-18days on market $74,900 Active 92 DOM
-
2026-06-17days on market $74,900 Active 91 DOM
-
2026-06-16days on market $74,900 Active 90 DOM
-
2026-06-15days on market $74,900 Active 89 DOM
-
2026-06-13days on market $74,900 Active 87 DOM
-
2026-06-12days on market $74,900 Active 86 DOM
-
2026-06-09days on market $74,900 Active 83 DOM
-
2026-06-08days on market $74,900 Active 82 DOM
-
2026-06-07days on market $74,900 Active 81 DOM
-
2026-06-07days on market $74,900 Active 80 DOM
-
2026-06-04days on market $74,900 Active 77 DOM
-
2026-06-02days on market $74,900 Active 76 DOM
-
2026-06-01days on market $74,900 Active 75 DOM
-
2026-05-31days on market $74,900 Active 74 DOM
-
2026-03-18$74,900 Active 635-char remark
Show marketing remark (635 chars)
Investment Opportunity – Duplex with Strong Income Potential Great opportunity to add to your rental portfolio! This duplex features two spacious 2-bedroom units, each offering approximately 916 sq ft of living space. Each unit currently rents for $400/month Total current income: $800/month Well-sized layouts with solid rental potential. Even better, the seller also has 3 additional duplexes available and is willing to offer a package deal for all properties, making this an excellent opportunity for investors looking to scale quickly. Don’t miss your chance to secure multiple income-producing properties in one deal!
ⓘ Source: listings_history table (triggers on properties + properties_extension) + one-shot
backfill from property_details.listing_events for pre-trigger history.
Climate risk First Street
- Flood 7/10 Severe FEMA zone X (unshaded) · 99% chance over 30 yrs
- Wildfire 5/10 Major
- Heat 6/10 Major 7 d/yr ≥107°F today · 21 d/yr by 30 yrs out
- Wind 2/10 Low 3% chance of damaging wind over 30 yrs
- Air quality 1/10 Low 0 unhealthy d/yr today · 0 by 30 yrs out
Nearby sold comps map
Loading sold comps map…
Walkable amenities ~0.75 mi
Loading nearby amenities…
Taxation est. · year 1
- Rental income
- $18,936
- − Mortgage interest
- −$4,196
- − Property taxes
- −$1,124
- − Insurance
- −$1,172
- − Repairs & maintenance
- −$1,515
- − Management
- −$1,515
- − Depreciation
- −$2,179
- Taxable income
- $7,236
- Est. tax owed @ 24.0%
- −$1,737
- After-tax cash flow
- $6,214/yr
For passive investors: Depreciation is non-cash, so a rental often shows a tax loss while cash-flowing — sheltering income. Rental losses are passive: they offset passive income freely, and up to $25,000/yr can offset ordinary (W-2) income if you actively participate and your MAGI is under $100k (phasing out to $0 by $150k); unused losses carry forward. On sale, claimed depreciation is recaptured at up to 25%, and gains may owe capital-gains tax (a 1031 exchange can defer both). Figures are a year-1 estimate at your 24.0% rate — not tax advice; consult a CPA.
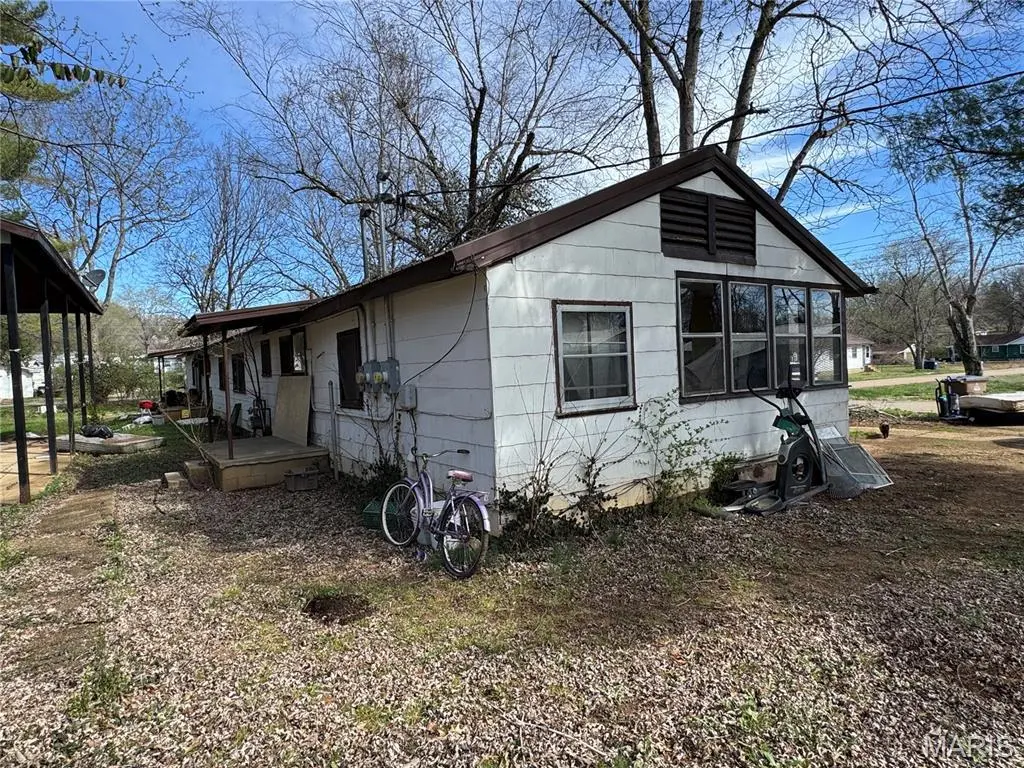
Condition & rehab AI · 7 photos
This property is in poor condition with significant repairs and maintenance needed, including a new roof, exterior siding, landscaping, and windows and doors. Immediate action is required to improve the property's value and attract buyers and renters.
Repairs flagged
- Major roof — The roof appears to be in poor condition with visible damage and possible leaks.
- Major exterior siding — The exterior siding is peeling and in poor condition, with visible damage and discoloration.
- Major landscaping — The landscaping is overgrown and unkempt, with debris and trash scattered around the property.
- Major fencing — The fencing is in poor condition and appears to be falling apart.
- Major windows — The windows are broken and need immediate repair.
- Major doors — The doors are missing and need immediate repair.
Value-add opportunities
- Both repair and replace roof — A new roof will significantly improve the property's appearance and functionality, attracting more buyers and renters.
- Both repair and replace exterior siding — A new exterior siding will improve the property's appearance and functionality, attracting more buyers and renters.
- Both landscaping and debris removal — A well-maintained and aesthetically pleasing landscape will improve the property's curb appeal and attract more buyers and renters.
- Both repair and replace windows and doors — New windows and doors will improve the property's functionality and appearance, attracting more buyers and renters.
Renovation cost estimate screening
| Repair item | Severity | Est. cost |
|---|---|---|
| roof · The roof appears to be in poor condition with visible damage and possible leaks. | Major | $15,000–50,000 |
| exterior siding · The exterior siding is peeling and in poor condition, with visible damage and discoloration. | Major | $15,000–50,000 |
| landscaping · The landscaping is overgrown and unkempt, with debris and trash scattered around the property. | Major | $15,000–50,000 |
| fencing · The fencing is in poor condition and appears to be falling apart. | Major | $15,000–50,000 |
| windows · The windows are broken and need immediate repair. | Major | $15,000–50,000 |
| doors · The doors are missing and need immediate repair. | Major | $15,000–50,000 |
| Total estimated repair cost · 6 items | $90,000–300,000 |
Value-add ROI direction
- Both repair and replace roof — A new roof will significantly improve the property's appearance and functionality, attracting more buyers and renters. ↑
- Both repair and replace exterior siding — A new exterior siding will improve the property's appearance and functionality, attracting more buyers and renters. ↑
- Both landscaping and debris removal — A well-maintained and aesthetically pleasing landscape will improve the property's curb appeal and attract more buyers and renters. ↑
- Both repair and replace windows and doors — New windows and doors will improve the property's functionality and appearance, attracting more buyers and renters. ↑
ⓘ Cost ranges are severity-bucket heuristics (US national rule-of-thumb). Get contractor quotes + a written scope before underwriting a rehab budget.
Schools (NCES district)
- District
- Clearwater R-I
- NCES district ID
- 2909750
- Math proficiency
- 33% ▲ 1.00%
- Reading proficiency
- 33% ▼ -6.00%
- Median HH income
- $31,119
- Composite
- 26.89/100
- National rank
- #7095
- State rank
- #255 of 324 in MO
Livability — Piedmont
- Score
- 52/100
- State rank
- #854
- US rank
- #24925
Category grades
Schools grade is shown separately in the Schools card above.
Census & demographics
- Census place
- Piedmont, MO
- Population (ZIP)
- 5,068
Population outlook (Wayne County) Hauer SSP2
- Today (2025)
- 13,005 people
- By 2030
- 12,767 · -1.8%
- By 2040
- 12,319 · -5.3%
- By 2050
- 11,828 · -9.1%
- By 2075
- 10,806 · -16.9%
- By 2100
- 9,610 · -26.1%
Race, ethnicity, and origin ACS 2023
- Neighborhood character
- Predominantly White (96%)
- Race & ethnicity
- White 96% Two or more races 3%
- Common ancestry
- Italian 2% Slovak 2% Lithuanian 1%
- Foreign-born
- 0%
Political lean MEDSL · Wayne
- 2024 margin
- Solid R (+72.6) · D 13.4% · R 86.0%
- 2008→2024 swing
- -47.6pp toward R · 2008: -25.0pp · 2024: -72.6pp
- All cycles
- 2024: R+72.6 2020: R+70.5 2016: R+64.4 2012: R+34.6 2008: R+25.0
Not yet ingested
- Civics
- —
Market trends
- HPI YoY
- ▲ 5.89%
- Current HPI
- 165.6832
- Rent YoY
- —
- Metro
- —
- State GDP YoY
- ▲ 1.84%
- F500 in state
- 20
Industry mix (Fortune 500 HQ in MO)
| Industry | F500 HQs | Revenue |
|---|---|---|
| Healthcare | 1 | $163B |
|
||
| Insurance | 1 | $21B |
|
||
| Industrial Technology | 1 | $17B |
|
||
| Retail | 1 | $16B |
|
||
| Industrial Distribution | 1 | $10B |
|
||
| Utilities | 1 | $9B |
|
||
Price history
1 event — show timeline
- 2026-03-18 Listed $74,900 MARIS as Distributed by MLS Grid
Cash-flow waterfall
monthlySold comps — $/sqft
last 12 mo · ≤1 miLoading sold comps…