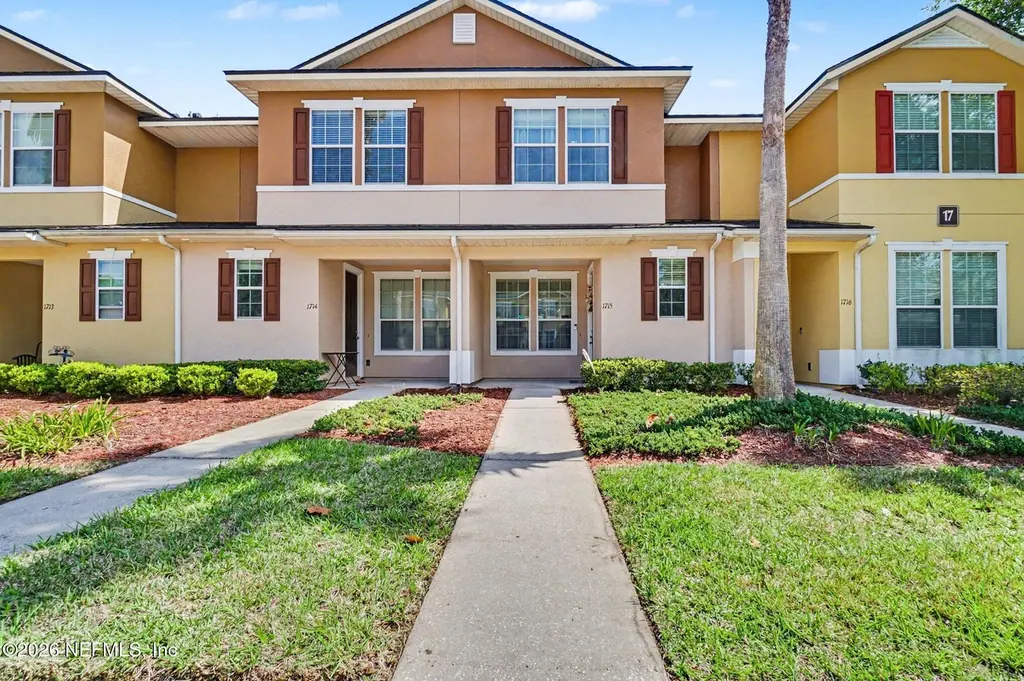
4220 Plantation Oaks Blvd #1715 · Oakleaf Plantation, FL
Flood risk 1/10 · Minimal
- FEMA flood zone
- X (unshaded)
- Chance of flooding over 30 yrs
- 0.0%
- Est. flood insurance / yr
- $507 – $1,088
Fire risk 6/10 · Moderate
- Est. fire insurance / yr
- $947 – $1,759
Heat risk 9/10 · Severe
- Hot days now (above 107°F)
- 7 days/yr
- Hot days in 30 yrs
- 19 days/yr
Wind risk 9/10 · Severe
- Chance of severe wind over 30 yrs
- 99.0%
Air-quality risk 3/10 · Minor
- Unhealthy air days now
- 3 days/yr
- Unhealthy air days in 30 yrs
- 4 days/yr
Risk factors via First Street. Map © Google.
Why this score? — see what drove the D+ grade
The composite is a weighted blend of 9 inputs, each scored 0–100. Each bar is that input's sub-score; the figure is the points it added to the 100-point composite (weight × sub-score).
- ARV discount +15.0/15.0
- Cash flow +11.1/30.0
- 1% rule +5.5/10.0
- Schools +5.1/10.0
- Livability +3.5/5.0
- Rent growth +3.4/5.0
- DSCR +3.2/10.0
- Condition / age +2.5/5.0
- Appreciation +0.0/10.0
$190,000
🖨 Deal sheet (PDF) 📄 Offer letter ✓ Due diligence
Listing remarks
Well-maintained 3-bedroom, 2.5-bath town home in Plantation Oaks offers a functional layout and low-maintenance living in a highly convenient location making this townhome one of the best values around. The main level features durable LVP flooring across the entry, dining, and living areas, stainless steel appliances, creating a functional and easy-to-maintain space. The layout flows naturally into the living area for everyday use or entertaining. Upstairs includes all three bedrooms, including a private primary suite. AC replaced just 1 year ago, offering comfort and peace of mind. Located minutes from Blanding Blvd, shopping, dining, and I-295 for quick access to Jacksonville.
Key facts
- $462 HOA
- Built 2010
- Listed 31 days
Property features AI
Finance
- Financial info: Tax information available
- HOA & community: Has association; Association fee $462 monthly; CDD fee applies
Exterior
- Parking: Assigned parking; On-street parking
- Utilities: Public sewer; Electricity available; Sewer available; Water available
- Home design: Townhouse; Attached property
- Construction: Shingle roof
- Exterior features: Private road frontage; Asphalt road surface
Interior
- Kitchen: Dishwasher; Electric range; Microwave; Refrigerator
- Bedrooms: 3 bedrooms
- Bathrooms: 2 full bathrooms; 1 half bathroom
- Heating & cooling: Electric heating; Central air conditioning; Electric cooling
- Interior features: Unfurnished; Cable available
- Laundry & utility: Electric water heater
Neighborhood map
What this means for you Summary
Snapshot
- This is a 3-bed/2.5-bath single-family listed at $190k.
Deal economics
- At list price, monthly cash flow is $-76 ($-912/yr) — negative.
- To cash-flow at today's rent, offer at most $177k (7.1% below list).
- Meets the 1% rule at list price ($2k rent vs $190k).
- Recommended offer: $177k (7.1% below list) — sets the bar for cash-flow.
- Cap rate 5.8% vs local median 4.0% in Oakleaf Plantation — top-decile yield for the area; either an underpriced asset or a hidden risk that comps aren't pricing in. Stress-test before assuming the spread holds.
Location & tenants
- Location reads 70/100 on livability (#446 in FL) — a middle-class / working-renter tenant base. Strengths: employment A+, housing A+, crime B+; Watch: amenities F, commute F, health & safety F.
- Clay (suburban): math 58% / reading 59% proficiency, ranked #14 of 73 in FL (top 19%) — acceptable for families but not a draw, mixed tenant base, ~2y average lease.
- Zoned schools: Plantation Oaks Elementary School (math 60% / reading 61%, grade B-, #664 of 2,144 statewide, top 32%, 938 students, 48% FRL); Oakleaf Junior High (math 50% / reading 54%, grade C+, #217 of 571 statewide, top 40%, 1,118 students, 46% FRL); Oakleaf High School (math 47% / reading 53%, grade D+, #175 of 667 statewide, top 27%, 2,371 students, 36% FRL).
- Market conditions: Rents rising (+3.7%/yr); 209 active listings in the ZIP; 24 comparable units currently listed for rent nearby; rentals leasing fast (median 7d on market — plan ~1-2 weeks tenant-placement turnaround); solid renter incomes; 1,876 units permitted in Clay County in 2024 (14 in 5+ unit buildings).
Forward outlook
- Local home prices are declining (-3.0%/yr); year-one equity from $1k of loan paydown is wiped out by about $6k of value loss. Plan a longer hold.
- Clay County population projected at +19% by 2050 — long-run rental-demand tailwind backs the buy-and-hold thesis.
Negotiation context
- It's been on market 31 days — a 3% lower offer ($184k) is reasonable based on typical stale-listing flexibility.
Risks & watch-outs
- Watch-outs: HOA is 23% of rent.
- Climate carrying-cost: severe wind risk, 99% chance of damaging wind over 30y; major wildfire risk; extreme-heat days projected 7→19/yr by 2055 (HVAC capex compounding) — expect insurance premiums to compound above CPI over the hold.
Questions for the listing agent
- What do current leases actually rent for vs. the listed asking? Can we see a recent rent roll and the last 12 months of T-12 income?
- It's been on market 31 days. Have you received any prior offers? Is the seller open to a 7% concession, seller financing, or rate buy-down credit?
- What does the HOA fee cover, when was the last increase, and are there any pending special assessments or reserve-fund shortfalls?
- Is there a deadline driving the sale (1031 exchange, divorce, estate, relocation)? That informs how much negotiation room exists.
- The area grade is low — what's the realistic commute time and amenity access for the typical tenant pool here? Any planned neighborhood developments (good or bad) we should know about?
- What's the average days-on-market for RENTAL listings here right now (not sales)? A rising rental-DOM trend means longer vacancies and softer asking-rent achievability than the comps imply.
- What's the recent tenant-quality profile in this submarket — average credit score on applications, eviction rate, late-payment / NSF rate, and stable-employment percentage? A property-management company in the area should have these aggregated.
- How much new for-sale + rental construction is in the pipeline within 1–3 miles? Heavy new supply typically softens prices + rents 12–24 months out; constrained supply supports both.
Investment metrics
- 1% rule
- 1.05% ✓
- Cap rate
- 5.81%
- Cash-on-cash
- -1.72%
- DSCR
- 0.92
- GRM
- 8.0
CMA / ARV
- ARV (on-the-fly)
- $289,380
- Comps found
- 12
Show comp detail 12 sales within ~0.75 mi
| Address | Dist | Beds/Ba | Sqft | Sold | Price | $/sf | Match |
|---|---|---|---|---|---|---|---|
| 441 Sunstone Ct | 0.40mi | 3/2.5 | 1,440 (-3%) | 22mo | $230,000 | $160 | 58 |
| 477 Glendale Ln | 0.55mi | 3/2.0 | 1,535 (+3%) | 19mo | $301,500 | $196 | 50 |
| 890 Misty Oak St | 0.53mi | 3/2.0 | 1,686 (+14%) | 1mo | $350,000 | $208 | 50 |
| 3686 Hawks View Dr | 0.72mi | 3/2.0 | 1,461 (-2%) | 15mo | $290,000 | $198 | 49 |
| 551 Glendale Ln | 0.65mi | 3/2.0 | 1,540 (+4%) | 15mo | $300,000 | $195 | 49 |
| 4112 Grayfield Ln | 0.30mi | 3/2.0 | 1,661 (+12%) | 22mo | $295,000 | $178 | 46 |
| 874 Glendale Ln | 0.67mi | 3/2.0 | 1,677 (+13%) | 1mo | $329,900 | $197 | 44 |
| 586 Drysdale Dr | 0.57mi | 3/2.0 | 1,661 (+12%) | 9mo | $305,000 | $184 | 44 |
| 351 Saint James Way | 0.58mi | 3/2.0 | 1,690 (+14%) | 11mo | $315,000 | $186 | 38 |
| 3610 Old Village Dr | 0.59mi | 4/2.0 (+1) | 1,686 (+14%) | 8mo | $285,000 | $169 | 36 |
| 3575 Old Village Dr | 0.58mi | 3/2.0 | 1,695 (+14%) | 14mo | $316,000 | $186 | 35 |
| 826 Glendale Ln | 0.72mi | 3/2.0 | 1,294 (-13%) | 22mo | $305,800 | $236 | 24 |
Match score weights: distance 35% · size 25% · config 20% · recency 20%. Top-matched comps best support the ARV.
Projected returns pro-forma
-3.0% appreciation · 3.73% rent growth · sell at horizon
- IRR
- -17.9%
- Equity multiple
- 0.36×
- Total profit
- $-33,921
- Equity at exit
- $28,330
- IRR
- -8.2%
- Equity multiple
- 0.46×
- Total profit
- $-28,675
- Equity at exit
- $16,428
Cash invested: $53,200 (down + closing). Projections, not guarantees.
Landlord ↔ Tenant lean methodology
- Overall (STATE)
- 87 Strongly Landlord-Friendly
- State Florida
- 87 Strongly Landlord-Friendly · R+3
- County
- — inherits STATE
- City
- — inherits STATE
ZIP-level market 32065
- Home prices YoY
- -25.6%
- Rents YoY
- 3.7%
- Active inventory
- 209
- Price-to-rent
- 8.0×
Monthly cashflow live
- Estimated rent
- $1,992 high interval (Pro) →
- Mortgage (P&I)
- −$996
- Tax from tax record
- −$112 /mo · $1,342/yr
- Insurance
- −$79
- HOA
- −$462
- Vacancy / Maint / Mgmt
- −$418
- Net cashflow
- $-76
Break-even live
Sensitivity live
| Price | -10% $32 | -5% $-22 | +0% $-76 | +5% $-130 | +10% $-184 |
|---|---|---|---|---|---|
| Rent | -10% $-233 | -5% $-155 | +0% $-76 | +5% $3 | +10% $81 |
| Rate | -1.0pp $20 | -0.5pp $-28 | base $-76 | +0.5pp $-125 | +1.0pp $-175 |
UW: 25.0% down · 7.5% · 30yr · 1.5% tax · 5.0% vac · 8.0% maint · 8.0% mgmt
Financing live
Cash to close
- Down payment
- $47,500
- Closing costs
- $5,700
- Reserves months
- —
- Total cash needed
- —
Loan-product check · same deal, 3 products live
Conventional
25% down · 7.5% · 30yr
- Down + closing
- —
- Monthly P&I
- —
- Monthly cashflow
- —
- DSCR
- —
- Eligible?
- —
Personal DTI + credit; lowest rate.
DSCR
20% down · 8.5% · 30yr
- Down + closing
- —
- Monthly P&I
- —
- Monthly cashflow
- —
- DSCR
- —
- Eligible?
- —
No personal income docs; deal must DSCR.
Hard money
10% down · 12.0% · 12mo
- Down + closing
- —
- Monthly P&I
- —
- Monthly cashflow
- —
- DSCR
- —
- Eligible?
- —
Short-term bridge; refi at stabilization.
Rent comps 24 comps
| Address | Beds | Baths | Sqft | Rent | $/sqft | DOM | Units | Dist |
|---|---|---|---|---|---|---|---|---|
| 4220 Plantation Oaks Blvd #2016 Orange Park, FL | 3.0 | 2.5 | 1516 | $1,850 | $1.22 | 25d | 1 | 0.01mi |
| 448 Running Woods St Unit 1 Orange Park, FL | 3.0 | 2.5 | 1333 | $1,850 | $1.39 | 25d | 1 | 0.14mi |
| 3972 Village View Ln Orange Park, FL | 2.0 | 2.5 | 1109 | $1,695 | $1.53 | 25d | 1 | 0.16mi |
| 3996 Village View Ln Orange Park, FL | 2.0 | 2.0 | 918 | $1,524 | $1.66 | 6d | 1 | 0.17mi |
| 3740 Creswick Cir #8 Orange Park, FL | 3.0 | 2.5 | 1824 | $1,950 | $1.07 | 0d | 1 | 0.17mi |
| 513 Spanish Oaks Way Orange Park, FL | 2.0 | 2.5 | 1109 | $1,600 | $1.44 | 19d | 1 | 0.24mi |
| 3978 Oak Mill Rd Orange Park, FL | 2.0 | 2.5 | 1109 | $1,595 | $1.44 | 25d | 1 | 0.25mi |
| 607 Crystal Way Orange Park, FL | 3.0 | 2.5 | 1440 | $1,725 | $1.20 | 6d | 1 | 0.29mi |
| 575 Oakleaf Plantation Pkwy Orange Park, FL | 1.0–2.0 | 1.0–2.0 | 1016 | $2,300 | $2.26 | 4d | 7 | 0.31mi |
| 575 Oakleaf Plantation Pkwy Orange Park, FL | 1.0–2.0 | 1.0–2.0 | 1016 | $2,300 | $2.26 | 0d | 5 | 0.31mi |
| 575 Oakleaf Plantation Pkwy Orange Park, FL | 1.0–2.0 | 1.0–2.0 | 969 | $2,300 | $2.37 | 25d | 6 | 0.31mi |
| 396 Forest Meadow Ln Orange Park, FL | 3.0 | 2.0 | 1677 | $1,826 | $1.09 | 23d | 1 | 0.42mi |
| 785 Oakleaf Plantation Pkwy Orange Park, FL | 2.0–3.0 | 2.0 | 1430 | $1,800 | $1.26 | 4d | 2 | 0.53mi |
| 785 Oakleaf Plantation Pkwy Orange Park, FL | 2.0–3.0 | 2.0 | 1430 | $1,800 | $1.26 | 25d | 1 | 0.53mi |
| 630 Glendale Ln Orange Park, FL | 4.0 | 2.0 | 1798 | $2,150 | $1.20 | 19d | 1 | 0.76mi |
| 630 Glendale Ln Orange Park, FL | 4.0 | 2.0 | 1798 | $2,150 | $1.20 | 0d | 1 | 0.76mi |
| 670 Grover Ln Orange Park, FL | 3.0 | 2.5 | 1704 | $2,100 | $1.23 | 25d | 1 | 0.77mi |
| 3886 Pebble Brooke Cir Orange Park, FL | 3.0 | 2.0 | 1502 | $1,850 | $1.23 | 25d | 1 | 1.05mi |
| 3875 Pebble Brooke Cir Orange Park, FL | 3.0 | 2.5 | 1874 | $2,366 | $1.26 | 0d | 1 | 1.07mi |
| 3800 Pebble Brooke Cir Orange Park, FL | 3.0 | 2.0 | 1353 | $1,900 | $1.40 | 0d | 1 | 1.08mi |
| 3899 Pebble Brooke Cir Orange Park, FL | 3.0 | 2.0 | 1502 | $1,990 | $1.32 | 6d | 1 | 1.08mi |
| 3750 Silver Bluff Blvd Orange Park, FL | 2.0–3.0 | 2.0–3.0 | 1862 | $1,850 | $0.99 | 4d | 2 | 1.11mi |
| 4123 Pebble Brooke Cir Orange Park, FL | 3.0 | 2.0 | 1334 | $2,045 | $1.53 | 4d | 1 | 1.11mi |
| 250 Cherry Ridge Dr Jacksonville, FL | 1.0–3.0 | 1.0–2.0 | 1088 | $1,753 | $1.61 | 5d | 14 | 1.16mi |
HOA detail
- Monthly dues
- $462 · $5,544/yr
Listing history 2 events
-
2026-05-01status Pending
-
2026-03-30$190,000 Active
ⓘ Source: listings_history table (triggers on properties + properties_extension) + one-shot
backfill from property_details.listing_events for pre-trigger history.
Tax reassessment forecast FL · Resets to sale price
- Current annual tax
- $1,342 · $112/mo
- Projected year-2 tax
- $1,577 · $131/mo
- Expected delta
- +$235/yr (+$20/mo · 17.5%)
ⓘ Screening estimate from a state-policy table — verify with the county assessor before closing.
Climate risk First Street
- Flood 1/10 Low FEMA zone X (unshaded) · 0% chance over 30 yrs
- Wildfire 6/10 Major
- Heat 9/10 Extreme 7 d/yr ≥107°F today · 19 d/yr by 30 yrs out
- Wind 9/10 Extreme 99% chance of damaging wind over 30 yrs
- Air quality 3/10 Moderate 3 unhealthy d/yr today · 4 by 30 yrs out
Nearby sold comps map
Loading sold comps map…
Walkable amenities ~0.75 mi
Loading nearby amenities…
Taxation est. · year 1
- Rental income
- $23,899
- − Mortgage interest
- −$10,643
- − Property taxes
- −$1,342
- − Insurance
- −$950
- − Repairs & maintenance
- −$1,912
- − Management
- −$1,912
- − HOA
- −$5,544
- − Depreciation
- −$5,527
- Taxable loss
- −$3,931
- Est. tax savings @ 24.0%
- +$943
- After-tax cash flow
- $31/yr
For passive investors: Depreciation is non-cash, so a rental often shows a tax loss while cash-flowing — sheltering income. Rental losses are passive: they offset passive income freely, and up to $25,000/yr can offset ordinary (W-2) income if you actively participate and your MAGI is under $100k (phasing out to $0 by $150k); unused losses carry forward. On sale, claimed depreciation is recaptured at up to 25%, and gains may owe capital-gains tax (a 1031 exchange can defer both). Figures are a year-1 estimate at your 24.0% rate — not tax advice; consult a CPA.
Schools (NCES district)
- District
- Clay
- NCES district ID
- 1200300
- Math proficiency
- 58% ▼ -8.00%
- Reading proficiency
- 59% ▼ -3.00%
- Median HH income
- $59,379
- Composite
- 50.73/100
- National rank
- #1815
- State rank
- #14 of 73 in FL
Livability — Oakleaf Plantation
- Score
- 70/100
- State rank
- #446
- US rank
- #8083
Category grades
Schools grade is shown separately in the Schools card above.
Census & demographics
- Census place
- Oakleaf Plantation, FL
- County
- Clay County · 208,450 people
- City population
- 40,366
- Metro
- Jacksonville, FL
- Population (ZIP)
- 41,578
- Household income
- $97,455
- Rent vs Own
- Severe rent burden
- 1129.0
Population outlook (Clay County) Hauer SSP2
- Today (2025)
- 230,495 people
- By 2030
- 242,427 · +5.2%
- By 2040
- 262,244 · +13.8%
- By 2050
- 275,148 · +19.4%
- By 2075
- 295,397 · +28.2%
- By 2100
- 287,592 · +24.8%
Race, ethnicity, and origin ACS 2023
- Neighborhood character
- Diverse neighborhood (Simpson 0.67)
- Race & ethnicity
- White 51% Black 20% Hispanic / Latino 15% Two or more races 15% Asian 6%
- Hispanic origin (detail)
- Mexican 3% Puerto Rican 5% Cuban 3%
- Common ancestry
- Lithuanian 4% Romanian 2% Portuguese 2%
- Foreign-born
- 8% · Canada, China
- Languages at home
- 88% English-only · Spanish 7% Tagalog/Filipino 3% Other Asian/Pacific 1%
Political lean MEDSL · Clay
- 2024 margin
- Solid R (+39.3) · D 29.9% · R 69.2%
- 2008→2024 swing
- +3.6pp toward D · 2008: -42.8pp · 2024: -39.3pp
- All cycles
- 2024: R+39.3 2020: R+37.1 2016: R+44.3 2012: R+45.8 2008: R+42.8
Not yet ingested
- Civics
- —
Market trends
- HPI YoY
- ▼ -95.13%
- Current HPI
- 276.5987
- Rent YoY
- ▲ 3.73%
- Metro
- Jacksonville, FL
- State GDP YoY
- ▲ 3.28%
- F500 in state
- 36
Industry mix (Fortune 500 HQ in FL)
| Industry | F500 HQs | Revenue |
|---|---|---|
| Industrial Technology | 2 | $29B |
|
||
| Insurance | 2 | $17B |
|
||
| Retail | 1 | $60B |
|
||
| Technology Distribution | 1 | $58B |
|
||
| Homebuilding | 1 | $35B |
|
||
| Technology Manufacturing | 1 | $35B |
|
||
Price history
2 events — show timeline
- 2026-05-01 Pending — realMLS
- 2026-03-30 Listed $190,000 realMLS
Property tax history
-4.2%/yrLatest (2025): $1,342 · -0.6% YoY. Source: county tax records.
Cash-flow waterfall
monthlySold comps — $/sqft
last 12 mo · ≤1 miLoading sold comps…