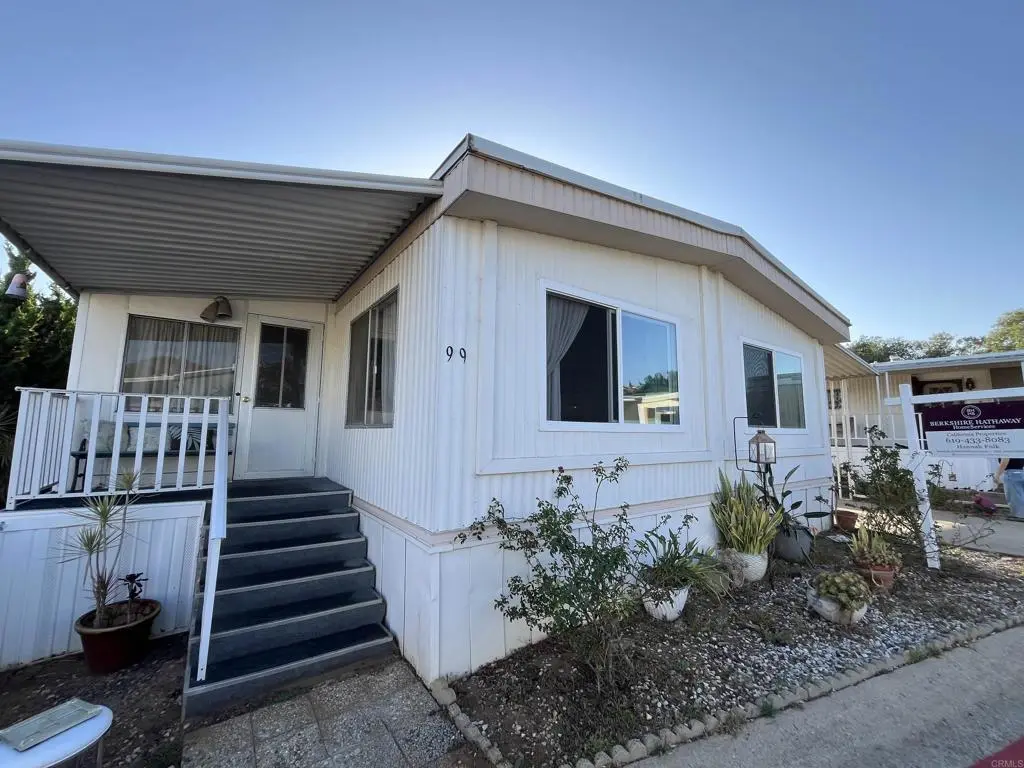
1810 Hillsdale Rd #99 · Rancho San Diego, CA
Flood risk 1/10 · Minimal
- FEMA flood zone
- X (unshaded)
- Chance of flooding over 30 yrs
- 0.0%
- Est. flood insurance / yr
- $507 – $1,088
Fire risk 6/10 · Moderate
- Est. fire insurance / yr
- $659 – $1,223
Heat risk 5/10 · Moderate
- Hot days now (above 97°F)
- 7 days/yr
- Hot days in 30 yrs
- 20 days/yr
Wind risk 1/10 · Minimal
- Chance of severe wind over 30 yrs
- —
Air-quality risk 4/10 · Minor
- Unhealthy air days now
- 6 days/yr
- Unhealthy air days in 30 yrs
- 7 days/yr
Risk factors via First Street. Map © Google.
Why this score? — see what drove the B- grade
The composite is a weighted blend of 9 inputs, each scored 0–100. Each bar is that input's sub-score; the figure is the points it added to the 100-point composite (weight × sub-score).
- Cash flow +30.0/30.0
- 1% rule +10.0/10.0
- DSCR +10.0/10.0
- ARV discount +7.5/15.0
- Schools +4.0/10.0
- Livability +3.2/5.0
- Condition / age +2.5/5.0
- Rent growth +1.8/5.0
- Appreciation +0.0/10.0
$165,000
🖨 Deal sheet 📄 Offer letter ✓ Due diligence
Listing remarks
Location, location, location!!! Extremely clean 3-bedroom, 2 full bath mobile home in excellent original condition, perfectly nestled in a quiet family park in Rancho San Diego. This spacious, well-maintained 1,152-square-foot home offers ample room for comfortable family living and plenty of inside storage. The home includes a convenient shed for extra storage, a private backyard area with a peaceful view of an open field, and a covered carport accommodating two vehicles. This park has one of the most affordable space rents in El Cajon at $1,245 per month. Community amenities include a refreshing pool and a clubhouse, making it an ideal place to relax and socialize. Great location near sch
Key facts
- Clubhouse
- Refreshing pool
- 14.25 acre lot
Tags
Property features AI
Finance
- Other: Manager approval required for rental/occupancy; Pets allowed with size and number limits (dogs and cats OK)
- Financial info: Land lease of $1,245 (land lease property)
- HOA & community: Located in Singing Hills Mobile Estates; Suburban community
Exterior
- Parking: Attached carport with space for 2 vehicles; Has parking
- Utilities: Public sewer
- Home design: Single-story mobile home (Skyline model, 24' x 48'); Has a view
- Construction: Year built per assessor; Double-wide mobile home
- Exterior features: Community pool within a fenced area; Lot is level/flat and backs to a greenbelt; One shed on the property; Mobile home remains on the lot
Interior
- Bathrooms: 2 full bathrooms
- Heating & cooling: Cooling available (see remarks)
- Interior features: One-level home with front-door entry; Entry level is the first floor
- Laundry & utility: Washer hookup available; Washer/dryer details noted in remarks
Neighborhood map
What this means for you Summary
Snapshot
- This is a 3-bed/2.0-bath manufactured listed at $165k.
Deal economics
- At list price, monthly cash flow is $1k ($18k/yr) — positive.
- The deal already cash-flows at list — no discount required.
- Meets the 1% rule at list price ($3k rent vs $165k).
- Cap rate 17.2% vs local median 2.6% in Rancho San Diego — top-decile yield for the area; either an underpriced asset or a hidden risk that comps aren't pricing in. Stress-test before assuming the spread holds.
Location & tenants
- Location reads 65/100 on livability (#395 in CA) — a middle-class / working-renter tenant base. Strengths: employment A+, commute A-, schools B+; Watch: amenities F, cost of living F, health & safety F.
- Grossmont Union High (suburban): math 31% / reading 60% proficiency, ranked #173 of 517 in CA (top 34%) — families likely to look elsewhere, expect single-tenant / working-renter base with shorter leases; only 17% free/reduced lunch — higher-income household profile.
- Market conditions: Rents soft (-2.6%/yr); 137 active listings in the ZIP; 11 comparable units currently listed for rent nearby; rentals leasing fast (median 2d on market — plan ~1-2 weeks tenant-placement turnaround); solid renter incomes; 11,759 units permitted in San Diego County in 2024 (7,244 in 5+ unit buildings).
- This rent runs 37% of the median local income ($102k/yr) — at the standard rent-burdened threshold; future hikes will face affordability resistance.
Forward outlook
- Local home prices are declining (-3.0%/yr); year-one equity from $1k of loan paydown is wiped out by about $5k of value loss. Plan a longer hold.
- San Diego County population projected at +20% by 2050 — long-run rental-demand tailwind backs the buy-and-hold thesis.
- At projected returns (-3.0% appreciation + 0.0% rent growth), your $46k cash investment doubles in ~4 years — after that, you're playing with house money.
Negotiation context
- Only 13 days on market — expect competitive offers; lowballing is unlikely to land.
Risks & watch-outs
- Climate carrying-cost: major wildfire risk; extreme-heat days projected 7→20/yr by 2055 (HVAC capex compounding) — expect insurance premiums to compound above CPI over the hold.
Questions for the listing agent
- Built in 1977 — when were the roof, HVAC, electrical panel, plumbing, and water heater last replaced?
- Is there a deadline driving the sale (1031 exchange, divorce, estate, relocation)? That informs how much negotiation room exists.
- Schools are B-rated — typically a magnet for longer-tenancy family renters. What's the average tenant stay here, and is there a school-zone premium baked into asking?
- What's the average days-on-market for RENTAL listings here right now (not sales)? A rising rental-DOM trend means longer vacancies and softer asking-rent achievability than the comps imply.
- What's the recent tenant-quality profile in this submarket — average credit score on applications, eviction rate, late-payment / NSF rate, and stable-employment percentage? A property-management company in the area should have these aggregated.
- How much new for-sale + rental construction is in the pipeline within 1–3 miles? Heavy new supply typically softens prices + rents 12–24 months out; constrained supply supports both.
Investment metrics
- 1% rule
- 1.89% ✓
- Cap rate
- 17.16%
- Cash-on-cash
- 38.82%
- DSCR
- 2.73
- GRM
- 4.4
CMA / ARV
No comps found within radius.
Projected returns pro-forma
-3.0% appreciation · 0.0% rent growth · sell at horizon
- IRR
- 31.8%
- Equity multiple
- 2.28×
- Total profit
- $59,274
- Equity at exit
- $24,602
- IRR
- 37.3%
- Equity multiple
- 4.00×
- Total profit
- $138,696
- Equity at exit
- $14,266
Cash invested: $46,200 (down + closing). Projections, not guarantees.
Landlord ↔ Tenant lean methodology
- Overall (STATE)
- 18 Strongly Tenant-Friendly
- State California
- 18 Strongly Tenant-Friendly · D+13
- County
- — inherits STATE
- City
- — inherits STATE
ZIP-level market 92019
- Rents YoY
- -2.6%
- Active inventory
- 137
- Price-to-rent
- 4.4×
Monthly cashflow live
- Estimated rent
- $3,112 high interval (Pro) →
- Mortgage (P&I)
- −$865
- Tax from tax record
- −$30 /mo · $359/yr
- Insurance
- −$69
- HOA
- −$0
- Vacancy / Maint / Mgmt
- −$654
- Net cashflow
- $1,495
Break-even live
UW: 25.0% down · 7.5% · 30yr · 1.5% tax · 5.0% vac · 8.0% maint · 8.0% mgmt
Financing live
Cash to close
- Down payment
- $41,250
- Closing costs
- $4,950
- Reserves months
- —
- Total cash needed
- —
Loan-product check · same deal, 3 products live
Conventional
25% down · 7.5% · 30yr
- Down + closing
- —
- Monthly P&I
- —
- Monthly cashflow
- —
- DSCR
- —
- Eligible?
- —
Personal DTI + credit; lowest rate.
DSCR
20% down · 8.5% · 30yr
- Down + closing
- —
- Monthly P&I
- —
- Monthly cashflow
- —
- DSCR
- —
- Eligible?
- —
No personal income docs; deal must DSCR.
Hard money
10% down · 12.0% · 12mo
- Down + closing
- —
- Monthly P&I
- —
- Monthly cashflow
- —
- DSCR
- —
- Eligible?
- —
Short-term bridge; refi at stabilization.
Rent comps 11 comps
| Address | Beds | Baths | Sqft | Rent | $/sqft | DOM | Units | Dist |
|---|---|---|---|---|---|---|---|---|
| 12090 Calle de Montana #254 El Cajon, CA | 2.0 | 2.0 | 1139 | $3,200 | $2.81 | 1d | 1 | 0.85mi |
| 12083 Calle De Montana Unit 219A El Cajon, CA | 2.0 | 1.0 | 913 | $2,699 | $2.96 | 1d | 1 | 0.87mi |
| 12022 Calle de Montana #290 El Cajon, CA | 2.0 | 2.5 | 1220 | $2,950 | $2.42 | 10d | 1 | 0.97mi |
| 12367 Calle Albara El Cajon, CA | 1.0–2.0 | 1.0–2.0 | 850 | $2,874 | $3.38 | 1d | 2 | 0.98mi |
| 1627 Woodrun Pl El Cajon, CA | 3.0 | 3.0 | 1294 | $4,000 | $3.09 | 2d | 1 | 0.99mi |
| 1451 Brabham St El Cajon, CA | 1.0–2.0 | 1.0–2.0 | 1005 | $2,880 | $2.86 | 1d | 8 | 1.17mi |
| 2450 Hilton Head Pl El Cajon, CA | 1.0–3.0 | 1.0–2.0 | 882 | $3,034 | $3.44 | 1d | 46 | 1.32mi |
| 1676 Raynell Way Unit 1465005P El Cajon, CA | 4.0 | 2.0 | 1227 | $9,166 | $7.47 | 21d | 1 | 1.37mi |
| 1536 Gustavo St Unit D El Cajon, CA | 2.0 | 1.0 | 945 | $2,800 | $2.96 | 24d | 1 | 1.40mi |
| 11424 Via Rancho San Diego #92 El Cajon, CA | 2.0 | 2.0 | 866 | $2,975 | $3.44 | 19d | 1 | 1.44mi |
| 1535 Granite Hills Dr El Cajon, CA | 2.0 | 2.0 | 825 | $2,400 | $2.91 | 1d | 1 | 1.49mi |
Listing history 10 events
-
2026-06-18days on market $165,000 Active 13 DOM
-
2026-06-17days on market $165,000 Active 12 DOM
-
2026-06-16days on market $165,000 Active 11 DOM
-
2026-06-15days on market $165,000 Active 10 DOM
-
2026-06-13days on market $165,000 Active 8 DOM
-
2026-06-13days on market $165,000 Active 7 DOM
-
2026-06-09days on market $165,000 Active 4 DOM
-
2026-06-08days on market $165,000 Active 3 DOM
-
2026-06-07remarks 699-char remark
-
2026-06-07$165,000 Active 2 DOM
ⓘ Source: listings_history table (triggers on properties + properties_extension) + one-shot
backfill from property_details.listing_events for pre-trigger history.
Tax reassessment forecast CA · Resets to sale price
- Current annual tax
- $359 · $30/mo
- Projected year-2 tax
- $1,254 · $104/mo
- Expected delta
- +$895/yr (+$75/mo · 249.3%)
ⓘ Screening estimate from a state-policy table — verify with the county assessor before closing.
Climate risk First Street
- Flood 1/10 Low FEMA zone X (unshaded) · 0% chance over 30 yrs
- Wildfire 6/10 Major
- Heat 5/10 Major 7 d/yr ≥97°F today · 20 d/yr by 30 yrs out
- Wind 1/10 Low
- Air quality 4/10 Moderate 6 unhealthy d/yr today · 7 by 30 yrs out
Nearby sold comps map
Loading sold comps map…
Walkable amenities ~0.75 mi
Loading nearby amenities…
Taxation est. · year 1
- Rental income
- $37,345
- − Mortgage interest
- −$9,243
- − Property taxes
- −$359
- − Insurance
- −$825
- − Repairs & maintenance
- −$2,988
- − Management
- −$2,988
- − Depreciation
- −$4,800
- Taxable income
- $16,144
- Est. tax owed @ 24.0%
- −$3,874
- After-tax cash flow
- $14,061/yr
For passive investors: Depreciation is non-cash, so a rental often shows a tax loss while cash-flowing — sheltering income. Rental losses are passive: they offset passive income freely, and up to $25,000/yr can offset ordinary (W-2) income if you actively participate and your MAGI is under $100k (phasing out to $0 by $150k); unused losses carry forward. On sale, claimed depreciation is recaptured at up to 25%, and gains may owe capital-gains tax (a 1031 exchange can defer both). Figures are a year-1 estimate at your 24.0% rate — not tax advice; consult a CPA.
Schools (NCES district)
- District
- Grossmont Union High
- NCES district ID
- 0616230
- Math proficiency
- 31% ▼ -1.00%
- Reading proficiency
- 60% ▲ 5.00%
- Median HH income
- $61,801
- Composite
- 40.07/100
- National rank
- #3810
- State rank
- #173 of 517 in CA
Livability — Rancho San Diego
- Score
- 65/100
- State rank
- #395
- US rank
- #13426
Category grades
Schools grade is shown separately in the Schools card above.
Census & demographics
- Census place
- Rancho San Diego, CA
- County
- San Diego County · 3,178,799 people
- Metro
- San Diego-Chula Vista-Carlsbad, CA
- Population (ZIP)
- 45,351
- Household income
- $101,973
- Rent vs Own
- Severe rent burden
- 1897.0
Population outlook (San Diego County) Hauer SSP2
- Today (2025)
- 3,678,185 people
- By 2030
- 3,856,546 · +4.8%
- By 2040
- 4,171,407 · +13.4%
- By 2050
- 4,421,607 · +20.2%
- By 2075
- 4,831,599 · +31.4%
- By 2100
- 4,832,502 · +31.4%
Race, ethnicity, and origin ACS 2023
- Neighborhood character
- Predominantly White (67%)
- Race & ethnicity
- White 67% Hispanic / Latino 21% Two or more races 15% Asian 3% Black 2%
- Hispanic origin (detail)
- Mexican 19%
- Common ancestry
- Arab 6% Romanian 2% Lithuanian 2%
- Foreign-born
- 22% · Canada, China
- Languages at home
- 69% English-only · Spanish 11% Arabic 10% Other Indo-European 1%
Political lean MEDSL · San Diego
- 2024 margin
- D (+16.8) · D 56.9% · R 40.1% · Other 2.9%
- 2008→2024 swing
- +6.6pp toward D · 2008: 10.2pp · 2024: 16.8pp
- All cycles
- 2024: D+16.8 2020: D+22.8 2016: D+17.8 2012: D+5.1 2008: D+10.2
Not yet ingested
- Civics
- —
Market trends
- HPI YoY
- ▼ -553.81%
- Current HPI
- 349.3085
- Rent YoY
- ▼ -2.61%
- Metro
- San Diego-Chula Vista-Carlsbad, CA
- State GDP YoY
- ▲ 3.21%
- F500 in state
- 116
Industry mix (Fortune 500 HQ in CA)
| Industry | F500 HQs | Revenue |
|---|---|---|
| Technology | 27 | $1,492B |
|
||
| Financial Services | 3 | $174B |
|
||
| Retail | 3 | $44B |
|
||
| Insurance | 3 | $26B |
|
||
| Media / Entertainment | 2 | $115B |
|
||
| Pharmaceuticals / Biotech | 2 | $62B |
|
||
Price history
1 event — show timeline
- 2026-06-05 Listed $165,000 CRMLS
Property tax history
+6.7%/yrLatest (2013): $359 · +5.7% YoY. Source: county tax records.
Cash-flow waterfall
monthlySold comps — $/sqft
last 12 mo · ≤1 miLoading sold comps…