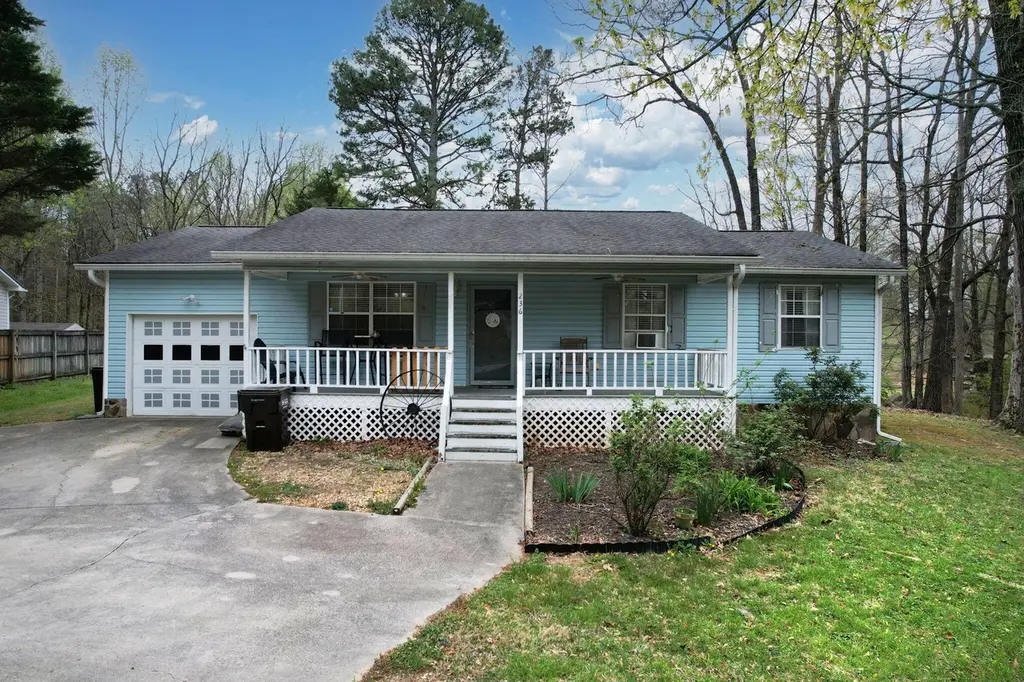
236 Crystal Spring Rd SE · Cleveland, TN
Flood risk 1/10 · Minimal
- FEMA flood zone
- X (unshaded)
- Chance of flooding over 30 yrs
- 0.0%
- Est. flood insurance / yr
- $507 – $1,088
Fire risk 4/10 · Minor
- Est. fire insurance / yr
- $949 – $1,763
Heat risk 5/10 · Moderate
- Hot days now (above 105°F)
- 7 days/yr
- Hot days in 30 yrs
- 18 days/yr
Wind risk 2/10 · Minimal
- Chance of severe wind over 30 yrs
- 4.0%
Air-quality risk 3/10 · Minor
- Unhealthy air days now
- 2 days/yr
- Unhealthy air days in 30 yrs
- 3 days/yr
Risk factors via First Street. Map © Google.
Why this score? — see what drove the D grade
The composite is a weighted blend of 9 inputs, each scored 0–100. Each bar is that input's sub-score; the figure is the points it added to the 100-point composite (weight × sub-score).
- Cash flow +12.6/30.0
- ARV discount +11.1/15.0
- DSCR +3.8/10.0
- Livability +3.5/5.0
- Schools +3.0/10.0
- Rent growth +2.5/5.0
- Condition / age +2.5/5.0
- 1% rule +2.3/10.0
- Appreciation +0.0/10.0
$230,000
🖨 Deal sheet (PDF) 📄 Offer letter ✓ Due diligence
Listing remarks MLS
3 bed, 2 bath home on a level lot with an attached 1-car garage and a separate storage building loaded with potential. The layout works, the lot is easy, and the upside is real. Perfect for an investor, flip, or buyer ready to build equity fast. Opportunities like this don't come around often--come take a look and see the value for yourself.
Key facts
- Garage
- Built 1997
- Listed 46 days
Neighborhood map
What this means for you Summary
Snapshot
- This is a 3-bed/2.5-bath single-family listed at $230k.
Deal economics
- At list price, monthly cash flow is $-29 ($-346/yr) — negative.
- To cash-flow at today's rent, offer at most $225k (2.2% below list).
- To meet the 1% rule (rent ≥ 1% of price), the offer needs to be $169k (26.7% below list).
- Recommended offer: $169k (26.7% below list) — sets the bar for 1% rule.
- Cap rate 6.1% vs local median 3.5% in Cleveland — top-decile yield for the area; either an underpriced asset or a hidden risk that comps aren't pricing in. Stress-test before assuming the spread holds.
Location & tenants
- Location reads 70/100 on livability (#55 in TN) — a middle-class / working-renter tenant base. Strengths: cost of living A+, health & safety A+, housing A; Watch: employment D, crime F, amenities F.
- Bradley County (other): math 35% / reading 34% proficiency, ranked #33 of 139 in TN (top 24%) — families likely to look elsewhere, expect single-tenant / working-renter base with shorter leases.
- Zoned schools: Oak Grove Elementary School (math 32% / reading 37%, grade F, #319 of 952 statewide, top 37%, 406 students, 0% FRL); Lake Forest Middle School (math 32% / reading 26%, grade F, #110 of 333 statewide, top 34%, 1,127 students, 0% FRL); Bradley Central High School (math 13% / reading 31%, grade F, #163 of 332 statewide, top 51%, 1,677 students, 0% FRL) — zoned schools average 0% FRL vs 46% district-wide (46 pts lower); this property's tenant base skews higher-income than the district average.
- Market conditions: 374 active listings in the ZIP; 1 comparable units currently listed for rent nearby; 768 units permitted in Bradley County in 2024 (0 in 5+ unit buildings).
Forward outlook
- Local home prices are declining (-3.0%/yr); year-one equity from $2k of loan paydown is wiped out by about $7k of value loss. Plan a longer hold.
- Bradley County population projected at +21% by 2050 — long-run rental-demand tailwind backs the buy-and-hold thesis.
Negotiation context
- It's been on market 46 days — a 3% lower offer ($223k) is reasonable based on typical stale-listing flexibility.
- 10 sale attempts since 12y ago with the ask held roughly flat each time — persistent listings suggest the price (not the market) is what's stuck; bring a comps-based counter.
- Current owner paid $150k; list at $230k implies a 53% gain — meaningful room to come down on a strong offer.
Risks & watch-outs
- Climate carrying-cost: extreme-heat days projected 7→18/yr by 2055 (HVAC capex compounding) — expect insurance premiums to compound above CPI over the hold.
Questions for the listing agent
- What do current leases actually rent for vs. the listed asking? Can we see a recent rent roll and the last 12 months of T-12 income?
- It's been on market 46 days. Have you received any prior offers? Is the seller open to a 27% concession, seller financing, or rate buy-down credit?
- Is there a deadline driving the sale (1031 exchange, divorce, estate, relocation)? That informs how much negotiation room exists.
- Schools are D-rated, which usually means shorter tenancies and higher turnover. Who's the typical renter profile here, and what's been the actual vacancy rate?
- Crime grade is F in this area — have there been break-ins, vandalism, or insurance claims at this property in the last 3 years? What carrier currently insures it and at what premium?
- The area grade is low — what's the realistic commute time and amenity access for the typical tenant pool here? Any planned neighborhood developments (good or bad) we should know about?
- What's the average days-on-market for RENTAL listings here right now (not sales)? A rising rental-DOM trend means longer vacancies and softer asking-rent achievability than the comps imply.
- What's the recent tenant-quality profile in this submarket — average credit score on applications, eviction rate, late-payment / NSF rate, and stable-employment percentage? A property-management company in the area should have these aggregated.
- How much new for-sale + rental construction is in the pipeline within 1–3 miles? Heavy new supply typically softens prices + rents 12–24 months out; constrained supply supports both.
Investment metrics
- 1% rule
- 0.73% ✗
- Cap rate
- 6.14%
- Cash-on-cash
- -0.54%
- DSCR
- 0.98
- GRM
- 11.4
CMA / ARV
- ARV (median comp)
- $249,756
- List price
- $230,000
- Delta
- -7.91%
- Verdict
- FAIR
- Comps
- 20 within 1.0 mi
Show comp detail 7 sales within ~0.75 mi
| Address | Dist | Beds/Ba | Sqft | Sold | Price | $/sf | Match |
|---|---|---|---|---|---|---|---|
| 236 Crystal Spring Rd SE | 0.00mi | 3/2.0 | 1,198 (0%) | 1mo | $220,000 | $184 | 98 |
| 145 Burkeridge Dr SE | 0.10mi | 3/2.0 | 1,250 (+4%) | 7mo | $270,000 | $216 | 80 |
| 139 Fox Farm Trl SE | 0.48mi | 3/2.0 | 1,152 (-4%) | 3mo | $225,000 | $195 | 67 |
| 188 Crystal Springs Rd SE | 0.10mi | 3/2.0 | 1,040 (-13%) | 13mo | $270,000 | $260 | 61 |
| 215 Geren Dr NE | 0.73mi | 3/1.0 | 1,134 (-5%) | 3mo | $185,000 | $163 | 49 |
| 185 Hidden Forest Dr | 0.62mi | 3/1.5 | 1,270 (+6%) | 19mo | $289,900 | $228 | 41 |
| 246 Lyles Rd SE | 0.72mi | 3/2.0 | 1,313 (+10%) | 13mo | $215,200 | $164 | 37 |
Match score weights: distance 35% · size 25% · config 20% · recency 20%. Top-matched comps best support the ARV.
Projected returns pro-forma
-3.0% appreciation · 3.0% rent growth · sell at horizon
- IRR
- -17.3%
- Equity multiple
- 0.39×
- Total profit
- $-39,221
- Equity at exit
- $34,294
- IRR
- -9.3%
- Equity multiple
- 0.43×
- Total profit
- $-36,984
- Equity at exit
- $19,886
Cash invested: $64,400 (down + closing). Projections, not guarantees.
Landlord ↔ Tenant lean methodology
- Overall (STATE)
- 87 Strongly Landlord-Friendly
- State Tennessee
- 87 Strongly Landlord-Friendly · R+13
- County
- — inherits STATE
- City
- — inherits STATE
ZIP-level market 37323
- Home prices YoY
- -23.5%
- Active inventory
- 374
- Price-to-rent
- 11.4×
Monthly cashflow live
- Estimated rent
- $1,686 medium interval (Pro) →
- Mortgage (P&I)
- −$1,206
- Tax from tax record
- −$59 /mo · $710/yr
- Insurance
- −$96
- HOA
- −$0
- Vacancy / Maint / Mgmt
- −$354
- Net cashflow
- $-29
Break-even live
Sensitivity live
| Price | -10% $101 | -5% $36 | +0% $-29 | +5% $-94 | +10% $-159 |
|---|---|---|---|---|---|
| Rent | -10% $-162 | -5% $-95 | +0% $-29 | +5% $38 | +10% $104 |
| Rate | -1.0pp $87 | -0.5pp $30 | base $-29 | +0.5pp $-88 | +1.0pp $-149 |
UW: 25.0% down · 7.5% · 30yr · 1.5% tax · 5.0% vac · 8.0% maint · 8.0% mgmt
Financing live
Cash to close
- Down payment
- $57,500
- Closing costs
- $6,900
- Reserves months
- —
- Total cash needed
- —
Loan-product check · same deal, 3 products live
Conventional
25% down · 7.5% · 30yr
- Down + closing
- —
- Monthly P&I
- —
- Monthly cashflow
- —
- DSCR
- —
- Eligible?
- —
Personal DTI + credit; lowest rate.
DSCR
20% down · 8.5% · 30yr
- Down + closing
- —
- Monthly P&I
- —
- Monthly cashflow
- —
- DSCR
- —
- Eligible?
- —
No personal income docs; deal must DSCR.
Hard money
10% down · 12.0% · 12mo
- Down + closing
- —
- Monthly P&I
- —
- Monthly cashflow
- —
- DSCR
- —
- Eligible?
- —
Short-term bridge; refi at stabilization.
Rent comps 1 comps
| Address | Beds | Baths | Sqft | Rent | $/sqft | DOM | Units | Dist |
|---|---|---|---|---|---|---|---|---|
| 350 Matt Cir SE Cleveland, TN | 3.0 | 1.0 | 912 | $1,350 | $1.48 | 45d | 1 | 1.05mi |
Listing history 24 events
-
2026-05-18status Pending 343-char remark
Show marketing remark (343 chars)
3 bed, 2 bath home on a level lot with an attached 1-car garage and a separate storage building loaded with potential. The layout works, the lot is easy, and the upside is real. Perfect for an investor, flip, or buyer ready to build equity fast. Opportunities like this don't come around often--come take a look and see the value for yourself.
-
2026-04-02$230,000 Active 343-char remark
Show marketing remark (343 chars)
3 bed, 2 bath home on a level lot with an attached 1-car garage and a separate storage building loaded with potential. The layout works, the lot is easy, and the upside is real. Perfect for an investor, flip, or buyer ready to build equity fast. Opportunities like this don't come around often--come take a look and see the value for yourself.
-
2025-12-03historical
-
2025-12-03$225,000
-
2023-01-14$225,000
-
2018-03-09soldstatus $149,900
-
2018-03-09soldstatus $149,900
-
2018-03-09soldstatus $149,900
-
2018-03-09soldstatus $149,900
-
2018-01-18$149,900
-
2018-01-16$149,900
-
2015-07-01soldstatus $116,000
-
2015-06-29soldstatus $116,000
-
2015-06-29soldstatus $116,000
-
2015-06-29soldstatus $116,000
-
2015-04-30$116,000
-
2014-08-01$118,000
-
2014-08-01$116,000
-
2014-07-29$116,000
-
2001-08-08soldstatus $82,900
-
2001-07-11soldstatus $65,451
-
1997-02-04soldstatus $78,000
ⓘ Source: listings_history table (triggers on properties + properties_extension) + one-shot
backfill from property_details.listing_events for pre-trigger history.
Tax reassessment forecast TN · Resets to sale price
- Current annual tax
- $710 · $59/mo
- Projected year-2 tax
- $1,633 · $136/mo
- Expected delta
- +$923/yr (+$77/mo · 130.0%)
ⓘ Screening estimate from a state-policy table — verify with the county assessor before closing.
Climate risk First Street
- Flood 1/10 Low FEMA zone X (unshaded) · 0% chance over 30 yrs
- Wildfire 4/10 Moderate
- Heat 5/10 Major 7 d/yr ≥105°F today · 18 d/yr by 30 yrs out
- Wind 2/10 Low 4% chance of damaging wind over 30 yrs
- Air quality 3/10 Moderate 2 unhealthy d/yr today · 3 by 30 yrs out
Nearby sold comps map
Loading sold comps map…
Walkable amenities ~0.75 mi
Loading nearby amenities…
Taxation est. · year 1
- Rental income
- $20,238
- − Mortgage interest
- −$12,884
- − Property taxes
- −$710
- − Insurance
- −$1,150
- − Repairs & maintenance
- −$1,619
- − Management
- −$1,619
- − Depreciation
- −$6,691
- Taxable loss
- −$4,435
- Est. tax savings @ 24.0%
- +$1,064
- After-tax cash flow
- $718/yr
For passive investors: Depreciation is non-cash, so a rental often shows a tax loss while cash-flowing — sheltering income. Rental losses are passive: they offset passive income freely, and up to $25,000/yr can offset ordinary (W-2) income if you actively participate and your MAGI is under $100k (phasing out to $0 by $150k); unused losses carry forward. On sale, claimed depreciation is recaptured at up to 25%, and gains may owe capital-gains tax (a 1031 exchange can defer both). Figures are a year-1 estimate at your 24.0% rate — not tax advice; consult a CPA.
Schools (NCES district)
- District
- Bradley County
- NCES district ID
- 4700330
- Math proficiency
- 35% ▼ -5.00%
- Reading proficiency
- 34% ▼ -2.00%
- Median HH income
- $45,807
- Composite
- 29.54/100
- National rank
- #6494
- State rank
- #33 of 139 in TN
Livability — Cleveland
- Score
- 70/100
- State rank
- #55
- US rank
- #7689
Category grades
Schools grade is shown separately in the Schools card above.
Census & demographics
- County
- Bradley County · 99,337 people
- City population
- 99,337
- Metro
- Cleveland, TN
- Population (ZIP)
- 31,948
- Household income
- $68,768
- Rent vs Own
- Severe rent burden
- 371.0
Population outlook (Bradley County) Hauer SSP2
- Today (2025)
- 114,901 people
- By 2030
- 120,137 · +4.6%
- By 2040
- 130,125 · +13.2%
- By 2050
- 139,257 · +21.2%
- By 2075
- 161,664 · +40.7%
- By 2100
- 179,767 · +56.5%
Race, ethnicity, and origin ACS 2023
- Neighborhood character
- Predominantly White (88%)
- Race & ethnicity
- White 88% Hispanic / Latino 7% Two or more races 6% Black 1%
- Hispanic origin (detail)
- Mexican 4% Puerto Rican 1%
- Common ancestry
- Lithuanian 2% Subsaharan African 2% Italian 1%
- Foreign-born
- 4% · Canada
- Languages at home
- 93% English-only · Spanish 5% Russian/Polish/Slavic 2%
Political lean MEDSL · Bradley
- 2024 margin
- Solid R (+58.9) · D 20.0% · R 78.9% · Other 1.1%
- 2008→2024 swing
- -9.2pp toward R · 2008: -49.7pp · 2024: -58.9pp
- All cycles
- 2024: R+58.9 2020: R+55.3 2016: R+59.1 2012: R+53.9 2008: R+49.7
Not yet ingested
- Civics
- —
Market trends
- HPI YoY
- ▼ -88.38%
- Current HPI
- 287.3643
- Rent YoY
- —
- Metro
- Cleveland, TN
- State GDP YoY
- ▲ 2.78%
- F500 in state
- 22
Industry mix (Fortune 500 HQ in TN)
| Industry | F500 HQs | Revenue |
|---|---|---|
| Healthcare | 3 | $91B |
|
||
| Retail | 3 | $72B |
|
||
| Transportation / Logistics | 1 | $88B |
|
||
| Paper / Packaging | 1 | $19B |
|
||
| Insurance | 1 | $13B |
|
||
| Energy | 1 | $12B |
|
||
Price history
+194.9% since first listed24 events — show timeline
- 2026-05-18 Pending — RCAOR
- 2026-05-18 Pending — GCAR
- 2026-04-02 Listed $230,000 GCAR
- 2026-04-02 Listed $230,000 RCAOR
- 2025-12-03 Listing Removed — REALTRACS as Distributed by MLS Grid
- 2025-12-03 Listed $225,000 REALTRACS as Distributed by MLS Grid
- 2023-01-14 Listed $225,000 RCAOR
- 2018-03-09 Sold (Public Records) $149,900 Public Records
- 2018-03-09 Sold (MLS) $149,900 GCAR
- 2018-03-09 Sold (MLS) $149,900 RCAOR
- 2018-03-09 Sold (MLS) $149,900 REALTRACS as Distributed by MLS Grid
- 2018-01-18 Listed $149,900 RCAOR
- 2018-01-16 Listed $149,900 GCAR
- 2015-07-01 Sold (Public Records) $116,000 Public Records
- 2015-06-29 Sold (MLS) $116,000 REALTRACS as Distributed by MLS Grid
- 2015-06-29 Sold (MLS) $116,000 RCAOR
- 2015-06-29 Sold (MLS) $116,000 GCAR
- 2015-04-30 Listed $116,000 REALTRACS as Distributed by MLS Grid
- 2014-08-01 Listed $116,000 GCAR
- 2014-08-01 Listed $118,000 Knoxville MLS
- 2014-07-29 Listed $116,000 RCAOR
- 2001-08-08 Sold (Public Records) $82,900 Public Records
- 2001-07-11 Sold (Public Records) $65,451 Public Records
- 1997-02-04 Sold (Public Records) $78,000 Public Records
Property tax history
-0.6%/yrLatest (2025): $710 · +11.5% YoY. Source: county tax records.
Cash-flow waterfall
monthlySold comps — $/sqft
last 12 mo · ≤1 miLoading sold comps…