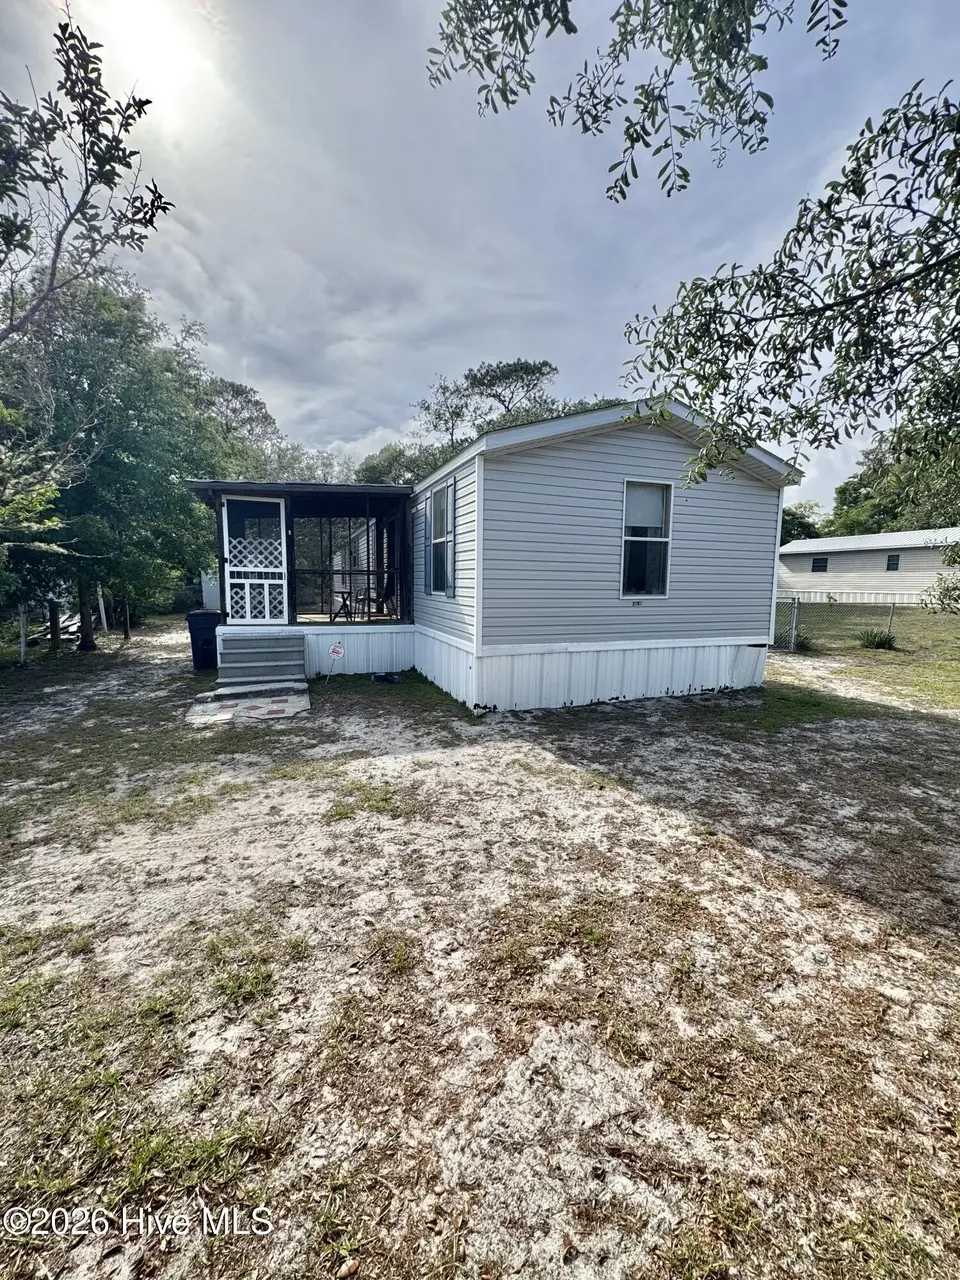
2109 N Tanglewood Dr SW · Holden Beach, NC
Flood risk 1/10 · Minimal
- FEMA flood zone
- X (unshaded)
- Chance of flooding over 30 yrs
- 0.0%
- Est. flood insurance / yr
- $507 – $1,088
Fire risk 5/10 · Moderate
- Est. fire insurance / yr
- $906 – $1,684
Heat risk 9/10 · Severe
- Hot days now (above 104°F)
- 7 days/yr
- Hot days in 30 yrs
- 19 days/yr
Wind risk 9/10 · Severe
- Chance of severe wind over 30 yrs
- 99.0%
Air-quality risk 2/10 · Minimal
- Unhealthy air days now
- 1 days/yr
- Unhealthy air days in 30 yrs
- 1 days/yr
Risk factors via First Street. Map © Google.
Why this score? — see what drove the B grade
The composite is a weighted blend of 9 inputs, each scored 0–100. Each bar is that input's sub-score; the figure is the points it added to the 100-point composite (weight × sub-score).
- Cash flow +29.1/30.0
- ARV discount +15.0/15.0
- DSCR +10.0/10.0
- 1% rule +8.1/10.0
- Schools +3.9/10.0
- Livability +3.2/5.0
- Rent growth +2.5/5.0
- Condition / age +2.5/5.0
- Appreciation +0.0/10.0
$129,900
🖨 Deal sheet 📄 Offer letter ✓ Due diligence
Listing remarks
Welcome to 2109 N Tanglewood Drive, an affordable opportunity just minutes from Holden Beach! This 2 bedroom, 2 bathroom home features a screened porch perfect for relaxing and enjoying the coastal breeze, plus a storage shed for additional storage space. Being sold fully furnished, this property could make an ideal primary residence, beach getaway, or investment opportunity. Inside, the home offers a spacious primary bathroom complete with a soaking tub and separate shower. Optional membership to the Tanglewood POA provides access to the community fishing pier and waterway access. Enjoy peaceful coastal living with convenient access to beaches, boating, fishing, local seafood, and all that
Key facts
- Storage shed
- Screened porch
- Waterway access
Tags
Property features AI
Exterior
- Parking: On-site parking
- Utilities: Water available
- Home design: Manufactured home (Residential); One-story; Entry level: 1
- Construction: Vinyl siding; Other foundation
- Exterior features: Screened porch; Front porch; Partial chain link fencing; Shingle roof; Has view; Paved road access
Interior
- Bedrooms: Total rooms: 5
- Bathrooms: 2 full bathrooms
- Heating & cooling: Central air conditioning; Floor furnace and electric heating
- Interior features: Walk-in closets; Furnished
Neighborhood map
What this means for you Summary
Snapshot
- This is a 2-bed/2.0-bath manufactured listed at $130k.
Deal economics
- At list price, monthly cash flow is $447 ($5k/yr) — positive.
- The deal already cash-flows at list — no discount required.
- Meets the 1% rule at list price ($2k rent vs $130k).
- Recommended offer: $128k (1.5% below list) — sets the bar for market timing.
- Cap rate 10.4% vs local median 3.1% in Holden Beach — top-decile yield for the area; either an underpriced asset or a hidden risk that comps aren't pricing in. Stress-test before assuming the spread holds.
Location & tenants
- Location reads 65/100 on livability (#334 in NC) — a middle-class / working-renter tenant base. Strengths: employment A+, crime A, housing A; Watch: cost of living D, health & safety D, amenities F.
- Brunswick County Schools (rural): math 45% / reading 47% proficiency, ranked #82 of 178 in NC (top 46%) — families likely to look elsewhere, expect single-tenant / working-renter base with shorter leases.
- Zoned schools: Supply Elementary (math 46% / reading 39%, grade F, #625 of 1,410 statewide, top 45%, 539 students, 99% FRL); Cedar Grove Middle (math 30% / reading 36%, grade F, #305 of 475 statewide, top 65%, 434 students, 99% FRL); West Brunswick High (math 50% / reading 56%, grade C-, #281 of 535 statewide, top 53%, 1,526 students, 100% FRL) — zoned schools average 100% FRL vs 53% district-wide (46 pts higher); higher-poverty schools than district average — tighter screening recommended.
- Market conditions: 506 active listings in the ZIP; 1 comparable units currently listed for rent nearby; 6,112 units permitted in Brunswick County in 2024 (990 in 5+ unit buildings).
- This rent runs 34% of the median local income ($60k/yr) — at the standard rent-burdened threshold; future hikes will face affordability resistance.
Forward outlook
- Local home prices are declining (-3.0%/yr); year-one equity from $898 of loan paydown is wiped out by about $4k of value loss. Plan a longer hold.
- Brunswick County population projected at +36% by 2050 — long-run rental-demand tailwind backs the buy-and-hold thesis.
- At projected returns (-3.0% appreciation + 3.0% rent growth), your $36k cash investment doubles in ~8 years — after that, you're playing with house money.
Negotiation context
- It's been on market 24 days — a 2% lower offer ($128k) is reasonable based on typical stale-listing flexibility.
Risks & watch-outs
- Climate carrying-cost: severe wind risk, 99% chance of damaging wind over 30y; moderate wildfire risk; extreme-heat days projected 7→19/yr by 2055 (HVAC capex compounding) — expect insurance premiums to compound above CPI over the hold.
Questions for the listing agent
- Is there a deadline driving the sale (1031 exchange, divorce, estate, relocation)? That informs how much negotiation room exists.
- What's the average days-on-market for RENTAL listings here right now (not sales)? A rising rental-DOM trend means longer vacancies and softer asking-rent achievability than the comps imply.
- What's the recent tenant-quality profile in this submarket — average credit score on applications, eviction rate, late-payment / NSF rate, and stable-employment percentage? A property-management company in the area should have these aggregated.
- How much new for-sale + rental construction is in the pipeline within 1–3 miles? Heavy new supply typically softens prices + rents 12–24 months out; constrained supply supports both.
Investment metrics
- 1% rule
- 1.31% ✓
- Cap rate
- 10.42%
- Cash-on-cash
- 14.75%
- DSCR
- 1.66
- GRM
- 6.4
CMA / ARV
- ARV (on-the-fly)
- $195,776
- Comps found
- 12
Show comp detail 12 sales within ~0.75 mi
| Address | Dist | Beds/Ba | Sqft | Sold | Price | $/sf | Match |
|---|---|---|---|---|---|---|---|
| 2094 N Tanglewood Dr SW | 0.05mi | 3/2.0 (+1) | 1,054 (-1%) | 10mo | $203,400 | $193 | 83 |
| 2367 Randy St SW | 0.49mi | 3/2.0 (+1) | 1,050 (-1%) | 0mo | $175,000 | $167 | 70 |
| 2255 W Tanglewood Dr SW | 0.25mi | 3/2.0 (+1) | 1,178 (+11%) | 1mo | $255,000 | $216 | 65 |
| 2219 Ontario St | 0.18mi | 3/2.0 (+1) | 968 (-9%) | 9mo | $115,000 | $119 | 64 |
| 2910 Jeremy St SW | 0.61mi | 3/2.0 (+1) | 1,080 (+2%) | 2mo | $169,000 | $156 | 62 |
| 2382 Summer Place Dr SW | 0.48mi | 2/2.0 | 1,178 (+11%) | 6mo | $225,500 | $191 | 55 |
| 2361 Lake Paula Dr SW | 0.34mi | 2/2.0 | 924 (-13%) | 11mo | $188,000 | $203 | 53 |
| 2333 Randy St SW | 0.44mi | 3/2.0 (+1) | 990 (-7%) | 20mo | $150,000 | $152 | 46 |
| 2387 Jolly Roger Dr SW | 0.68mi | 2/2.0 | 938 (-12%) | 4mo | $115,000 | $123 | 45 |
| 2340 E Tanglewood Dr SW | 0.40mi | 2/2.0 | 952 (-10%) | 23mo | $175,000 | $184 | 45 |
| 3206 Waterview Dr SW | 0.52mi | 2/2.0 | 923 (-13%) | 20mo | $224,100 | $243 | 37 |
| 2325 Blackbeard Dr SW | 0.72mi | 3/2.0 (+1) | 954 (-10%) | 14mo | $145,000 | $152 | 32 |
Match score weights: distance 35% · size 25% · config 20% · recency 20%. Top-matched comps best support the ARV.
Projected returns pro-forma
-3.0% appreciation · 3.0% rent growth · sell at horizon
- IRR
- 5.3%
- Equity multiple
- 1.20×
- Total profit
- $7,445
- Equity at exit
- $19,369
- IRR
- 14.7%
- Equity multiple
- 2.19×
- Total profit
- $43,246
- Equity at exit
- $11,231
Cash invested: $36,372 (down + closing). Projections, not guarantees.
Landlord ↔ Tenant lean methodology
- Overall (STATE)
- 85 Strongly Landlord-Friendly
- State North Carolina
- 85 Strongly Landlord-Friendly · R+3
- County
- — inherits STATE
- City
- — inherits STATE
ZIP-level market 28462
- Active inventory
- 506
- Price-to-rent
- 6.4×
Monthly cashflow live
- Estimated rent
- $1,702 medium interval (Pro) →
- Mortgage (P&I)
- −$681
- Tax est. 1.5%
- −$162 /mo · $1,948/yr
- Insurance
- −$54
- HOA
- −$0
- Vacancy / Maint / Mgmt
- −$357
- Net cashflow
- $447
Break-even live
UW: 25.0% down · 7.5% · 30yr · 1.5% tax · 5.0% vac · 8.0% maint · 8.0% mgmt
Financing live
Cash to close
- Down payment
- $32,475
- Closing costs
- $3,897
- Reserves months
- —
- Total cash needed
- —
Loan-product check · same deal, 3 products live
Conventional
25% down · 7.5% · 30yr
- Down + closing
- —
- Monthly P&I
- —
- Monthly cashflow
- —
- DSCR
- —
- Eligible?
- —
Personal DTI + credit; lowest rate.
DSCR
20% down · 8.5% · 30yr
- Down + closing
- —
- Monthly P&I
- —
- Monthly cashflow
- —
- DSCR
- —
- Eligible?
- —
No personal income docs; deal must DSCR.
Hard money
10% down · 12.0% · 12mo
- Down + closing
- —
- Monthly P&I
- —
- Monthly cashflow
- —
- DSCR
- —
- Eligible?
- —
Short-term bridge; refi at stabilization.
Rent comps 1 comps
| Address | Beds | Baths | Sqft | Rent | $/sqft | DOM | Units | Dist |
|---|---|---|---|---|---|---|---|---|
| 2272 Dolphin Shores Dr SW Unit 404 Supply, NC | 2.0 | 2.0 | 1216 | $1,650 | $1.36 | 14d | 1 | 0.46mi |
Listing history 17 events
-
2026-06-18days on market $129,900 Active 24 DOM
-
2026-06-17days on market $129,900 Active 23 DOM
-
2026-06-16days on market $129,900 Active 22 DOM
-
2026-06-15days on market $129,900 Active 21 DOM
-
2026-06-14days on market $129,900 Active 19 DOM
-
2026-06-13days on market $129,900 Active 18 DOM
-
2026-06-10days on market $129,900 Active 16 DOM
-
2026-06-09days on market $129,900 Active 15 DOM
-
2026-06-08days on market $129,900 Active 14 DOM
-
2026-06-07days on market $129,900 Active 13 DOM
-
2026-06-05days on market $129,900 Active 10 DOM
-
2026-06-03days on market $129,900 Active 9 DOM
-
2026-06-02days on market $129,900 Active 8 DOM
-
2026-06-01days on market $129,900 Active 7 DOM
-
2026-05-31days on market $129,900 Active 6 DOM
-
2026-05-30days on market $129,900 Active 5 DOM
-
2026-05-25$129,900 Active
ⓘ Source: listings_history table (triggers on properties + properties_extension) + one-shot
backfill from property_details.listing_events for pre-trigger history.
Climate risk First Street
- Flood 1/10 Low FEMA zone X (unshaded) · 0% chance over 30 yrs
- Wildfire 5/10 Major
- Heat 9/10 Extreme 7 d/yr ≥104°F today · 19 d/yr by 30 yrs out
- Wind 9/10 Extreme 99% chance of damaging wind over 30 yrs
- Air quality 2/10 Low 1 unhealthy d/yr today · 1 by 30 yrs out
Nearby sold comps map
Loading sold comps map…
Walkable amenities ~0.75 mi
Loading nearby amenities…
Taxation est. · year 1
- Rental income
- $20,426
- − Mortgage interest
- −$7,276
- − Property taxes
- −$1,948
- − Insurance
- −$650
- − Repairs & maintenance
- −$1,634
- − Management
- −$1,634
- − Depreciation
- −$3,779
- Taxable income
- $3,504
- Est. tax owed @ 24.0%
- −$841
- After-tax cash flow
- $4,523/yr
For passive investors: Depreciation is non-cash, so a rental often shows a tax loss while cash-flowing — sheltering income. Rental losses are passive: they offset passive income freely, and up to $25,000/yr can offset ordinary (W-2) income if you actively participate and your MAGI is under $100k (phasing out to $0 by $150k); unused losses carry forward. On sale, claimed depreciation is recaptured at up to 25%, and gains may owe capital-gains tax (a 1031 exchange can defer both). Figures are a year-1 estimate at your 24.0% rate — not tax advice; consult a CPA.
Schools (NCES district)
- District
- Brunswick County Schools
- NCES district ID
- 3700420
- Math proficiency
- 45% ▲ 4.00%
- Reading proficiency
- 47% ▲ 4.00%
- Median HH income
- $47,494
- Composite
- 39.23/100
- National rank
- #4011
- State rank
- #82 of 178 in NC
Livability — Holden Beach
- Score
- 65/100
- State rank
- #334
- US rank
- #13586
Category grades
Schools grade is shown separately in the Schools card above.
Census & demographics
- County
- Brunswick County · 131,536 people
- Metro
- Myrtle Beach-Conway-North Myrtle Beach, SC-NC
- Population (ZIP)
- 12,340
- Household income
- $60,349
- Rent vs Own
- Severe rent burden
- 269.0
Population outlook (Brunswick County) Hauer SSP2
- Today (2025)
- 152,111 people
- By 2030
- 165,705 · +8.9%
- By 2040
- 188,494 · +23.9%
- By 2050
- 206,228 · +35.6%
- By 2075
- 237,876 · +56.4%
- By 2100
- 251,451 · +65.3%
Race, ethnicity, and origin ACS 2023
- Neighborhood character
- Predominantly White (87%)
- Race & ethnicity
- White 87% Black 7% Two or more races 5% Hispanic / Latino 2%
- Common ancestry
- Slovak 4% Lithuanian 4% Serbian 2%
- Foreign-born
- 1% · Canada
- Languages at home
- 99% English-only · Spanish 1%
Political lean MEDSL · Brunswick
- 2024 margin
- Strong R (+24.9) · D 37.2% · R 62.0%
- 2008→2024 swing
- -6.9pp toward R · 2008: -17.9pp · 2024: -24.9pp
- All cycles
- 2024: R+24.9 2020: R+25.0 2016: R+28.7 2012: R+22.2 2008: R+17.9
Not yet ingested
- Civics
- —
Market trends
- HPI YoY
- ▼ -259.44%
- Current HPI
- 144.2462
- Rent YoY
- —
- Metro
- Myrtle Beach-Conway-North Myrtle Beach, SC-NC
- State GDP YoY
- ▲ 3.28%
- F500 in state
- 26
Industry mix (Fortune 500 HQ in NC)
| Industry | F500 HQs | Revenue |
|---|---|---|
| Financial Services | 2 | $213B |
|
||
| Retail | 2 | $95B |
|
||
| Industrial Conglomerate | 1 | $38B |
|
||
| Metals / Steel | 1 | $35B |
|
||
| Utilities | 1 | $30B |
|
||
| Industrial Machinery | 1 | $19B |
|
||
Price history
1 event — show timeline
- 2026-05-25 Listed $129,900 Hive MLS
Property tax history
+2.4%/yrLatest (2025): $167 · -2.4% YoY. Source: county tax records.
Cash-flow waterfall
monthlySold comps — $/sqft
last 12 mo · ≤1 miLoading sold comps…