540 Broken Arrow Ln #538 · Kyle, TX
Flood risk No data
- FEMA flood zone
- —
- Chance of flooding over 30 yrs
- —
- Est. flood insurance / yr
- —
Fire risk No data
- Est. fire insurance / yr
- —
Heat risk No data
- Hot days now (above threshold)
- —
- Hot days in 30 yrs
- —
Wind risk No data
- Chance of severe wind over 30 yrs
- —
Air-quality risk No data
- Unhealthy air days now
- —
- Unhealthy air days in 30 yrs
- —
Risk factors via First Street. Map © Google.
Why this score? — see what drove the B grade
The composite is a weighted blend of 9 inputs, each scored 0–100. Each bar is that input's sub-score; the figure is the points it added to the 100-point composite (weight × sub-score).
- Cash flow +30.0/30.0
- 1% rule +10.0/10.0
- DSCR +10.0/10.0
- ARV discount +7.5/15.0
- Condition / age +4.0/5.0
- Livability +3.8/5.0
- Schools +3.5/10.0
- Rent growth +2.4/5.0
- Appreciation +0.0/10.0
$109,995
🖨 Deal sheet (PDF) 📄 Offer letter ✓ Due diligence
Listing remarks
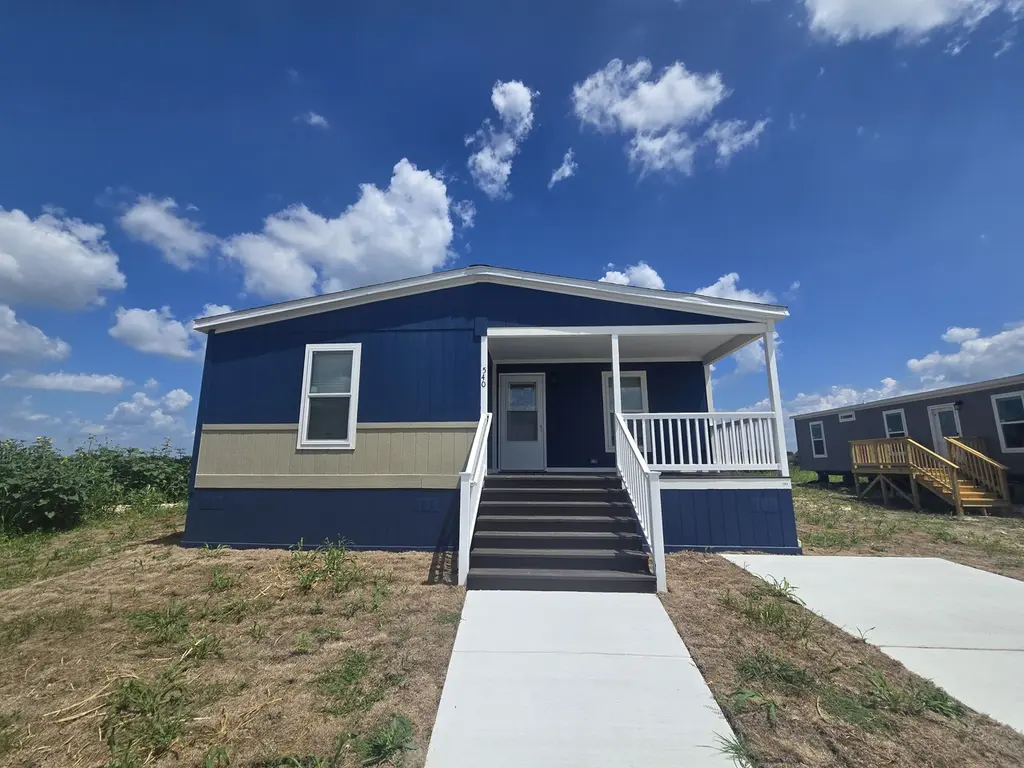
Be the first to live in this brand-new spacious 3-bedroom, 2-bath home with brand new kitchen appliances. Enjoy a large laundry room with washer and dryer hookups, a walk-in pantry, a covered porch, a storage shed, and a 3-car driveway. Spacious bedrooms and a large dining room make this home perfect for everyday living.
Key facts
- Covered porch
- 3-car driveway
- Storage shed
Tags
Property features AI
Finance
- Financial info: List price $109,995
Exterior
- Home design: Single-family style (plan: 540 Broken Arrow Lane); Located at 540 Broken Arrow Ln #538, Kyle, TX 78640
- Exterior features: Living area 1560
Interior
- Bedrooms: 3 bedrooms
- Bathrooms: 2 bathrooms
- Interior features: Spec home (new construction)
Neighborhood map
What this means for you Summary
Snapshot
- This is a 3-bed/2.0-bath manufactured listed at $110k. Condition is rated good.
Deal economics
- At list price, monthly cash flow is $729 ($9k/yr) — positive.
- The deal already cash-flows at list — no discount required.
- Meets the 1% rule at list price ($2k rent vs $110k).
- Recommended offer: $108k (1.5% below list) — sets the bar for market timing.
- Cap rate 14.3% vs local median 3.3% in Kyle — top-decile yield for the area; either an underpriced asset or a hidden risk that comps aren't pricing in. Stress-test before assuming the spread holds.
Location & tenants
- Location reads 75/100 on livability (#138 in TX, #3,993 nationally) — a middle-class / working-renter tenant base. Strengths: housing A+, health & safety A+, employment A; Watch: amenities F, commute F.
- Hays CISD (rural): math 35% / reading 41% proficiency, ranked #390 of 826 in TX (top 47%) — families likely to look elsewhere, expect single-tenant / working-renter base with shorter leases.
- Zoned schools: Tobias El (math 40% / reading 46%, grade F, #1,283 of 4,322 statewide, top 30%, 683 students, 52% FRL); Laura B Wallace Middle (math 31% / reading 34%, grade F, #947 of 1,662 statewide, top 58%, 789 students, 53% FRL); Lehman H S (math 20% / reading 32%, grade F, #1,234 of 1,632 statewide, top 76%, 2,120 students, 59% FRL).
- Market conditions: Rents soft (-0.3%/yr); 1820 active listings in the ZIP; 40 comparable units currently listed for rent nearby; rentals at typical pace (median 19d on market — plan ~3-4 weeks tenant-placement turnaround); solid renter incomes; 5,270 units permitted in Hays County in 2024 (1,464 in 5+ unit buildings).
Forward outlook
- Local home prices are declining (-3.0%/yr); year-one equity from $760 of loan paydown is wiped out by about $3k of value loss. Plan a longer hold.
- Hays County population projected at +93% by 2050 — long-run rental-demand tailwind backs the buy-and-hold thesis.
- At projected returns (-3.0% appreciation + 0.0% rent growth), your $31k cash investment doubles in ~5 years — after that, you're playing with house money.
Negotiation context
- It's been on market 16 days — a 2% lower offer ($108k) is reasonable based on typical stale-listing flexibility.
Questions for the listing agent
- Is there a deadline driving the sale (1031 exchange, divorce, estate, relocation)? That informs how much negotiation room exists.
- Schools are D-rated, which usually means shorter tenancies and higher turnover. Who's the typical renter profile here, and what's been the actual vacancy rate?
- What's the average days-on-market for RENTAL listings here right now (not sales)? A rising rental-DOM trend means longer vacancies and softer asking-rent achievability than the comps imply.
- What's the recent tenant-quality profile in this submarket — average credit score on applications, eviction rate, late-payment / NSF rate, and stable-employment percentage? A property-management company in the area should have these aggregated.
- How much new for-sale + rental construction is in the pipeline within 1–3 miles? Heavy new supply typically softens prices + rents 12–24 months out; constrained supply supports both.
Investment metrics
- 1% rule
- 1.71% ✓
- Cap rate
- 14.25%
- Cash-on-cash
- 28.42%
- DSCR
- 2.26
- GRM
- 4.9
CMA / ARV
No comps found within radius.
Projected returns pro-forma
-3.0% appreciation · 0.0% rent growth · sell at horizon
- IRR
- 19.2%
- Equity multiple
- 1.75×
- Total profit
- $23,140
- Equity at exit
- $16,401
- IRR
- 25.4%
- Equity multiple
- 2.91×
- Total profit
- $58,736
- Equity at exit
- $9,510
Cash invested: $30,799 (down + closing). Projections, not guarantees.
Landlord ↔ Tenant lean methodology
- Overall (STATE)
- 87 Strongly Landlord-Friendly
- State Texas
- 87 Strongly Landlord-Friendly · R+5
- County
- — inherits STATE
- City
- — inherits STATE
ZIP-level market 78640
- Home prices YoY
- -33.8%
- Rents YoY
- -0.3%
- Active inventory
- 1820
- Price-to-rent
- 4.9×
Monthly cashflow live
- Estimated rent
- $1,886 high interval (Pro) →
- Mortgage (P&I)
- −$577
- Tax est. 1.5%
- −$137 /mo · $1,650/yr
- Insurance
- −$46
- HOA
- −$0
- Vacancy / Maint / Mgmt
- −$396
- Net cashflow
- $729
Break-even live
Sensitivity live
| Price | -10% $806 | -5% $767 | +0% $729 | +5% $691 | +10% $653 |
|---|---|---|---|---|---|
| Rent | -10% $581 | -5% $655 | +0% $729 | +5% $804 | +10% $878 |
| Rate | -1.0pp $785 | -0.5pp $757 | base $729 | +0.5pp $701 | +1.0pp $672 |
UW: 25.0% down · 7.5% · 30yr · 1.5% tax · 5.0% vac · 8.0% maint · 8.0% mgmt
Financing live
Cash to close
- Down payment
- $27,499
- Closing costs
- $3,300
- Reserves months
- —
- Total cash needed
- —
Loan-product check · same deal, 3 products live
Conventional
25% down · 7.5% · 30yr
- Down + closing
- —
- Monthly P&I
- —
- Monthly cashflow
- —
- DSCR
- —
- Eligible?
- —
Personal DTI + credit; lowest rate.
DSCR
20% down · 8.5% · 30yr
- Down + closing
- —
- Monthly P&I
- —
- Monthly cashflow
- —
- DSCR
- —
- Eligible?
- —
No personal income docs; deal must DSCR.
Hard money
10% down · 12.0% · 12mo
- Down + closing
- —
- Monthly P&I
- —
- Monthly cashflow
- —
- DSCR
- —
- Eligible?
- —
Short-term bridge; refi at stabilization.
Rent comps 40 comps
| Address | Beds | Baths | Sqft | Rent | $/sqft | DOM | Units | Dist |
|---|---|---|---|---|---|---|---|---|
| 140 Plum Path Kyle, TX | 4.0 | 2.5 | 1945 | $2,149 | $1.10 | 3d | 1 | 0.24mi |
| 1685 Twin Cv Kyle, TX | 3.0 | 2.0 | 1740 | $2,200 | $1.26 | 45d | 1 | 0.29mi |
| 526 Harvest Moon Pkwy Kyle, TX | 3.0–4.0 | 2.0–3.0 | 1624 | $1,399 | $0.86 | 3d | 1 | 0.29mi |
| 205 Beech Dr Kyle, TX | 3.0 | 2.0 | 1359 | $1,795 | $1.32 | 6d | 1 | 0.32mi |
| 205 Beech Dr Kyle, TX | 3.0 | 2.0 | 1359 | $1,825 | $1.34 | 45d | 1 | 0.32mi |
| 850 Bunton Reserve Blvd Kyle, TX | 3.0 | 2.0 | 1109 | $1,800 | $1.62 | 25d | 1 | 0.36mi |
| 120 Beech Dr Kyle, TX | 3.0 | 2.5 | 2058 | $1,945 | $0.95 | 19d | 1 | 0.41mi |
| 1579 Violet Ln Kyle, TX | 3.0 | 2.5 | 1426 | $1,750 | $1.23 | 25d | 1 | 0.41mi |
| 410 Tower Dr Kyle, TX | 3.0 | 2.5 | 1665 | $1,795 | $1.08 | 45d | 1 | 0.43mi |
| 273 Tower Dr Kyle, TX | 3.0 | 2.0 | 1252 | $1,795 | $1.43 | 19d | 1 | 0.44mi |
| 1477 Treeta Trl Kyle, TX | 3.0 | 2.0 | 1560 | $1,759 | $1.13 | 23d | 1 | 0.45mi |
| 1469 Breanna Ln Kyle, TX | 3.0 | 2.0 | 1329 | $1,650 | $1.24 | 19d | 1 | 0.47mi |
| 1437 Treeta Trl Kyle, TX | 3.0 | 2.0 | 1262 | $1,895 | $1.50 | 45d | 1 | 0.49mi |
| 510 New Bridge Dr Kyle, TX | 4.0 | 2.0 | 1359 | $1,695 | $1.25 | 45d | 1 | 0.57mi |
| 187 Rummel Dr Kyle, TX | 3.0 | 2.0 | 1240 | $1,795 | $1.45 | 45d | 1 | 0.60mi |
| 270 Sheep Trail Dr Kyle, TX | 3.0 | 2.0 | 1584 | $1,785 | $1.13 | 45d | 1 | 0.60mi |
| 130 Peach Tree Pass Kyle, TX | 3.0 | 2.5 | 2198 | $1,900 | $0.86 | 19d | 1 | 0.63mi |
| 240 New Country Rd Kyle, TX | 3.0 | 2.0 | 1106 | $1,650 | $1.49 | 3d | 1 | 0.63mi |
| 240 New Country Rd Kyle, TX | 3.0 | 2.0 | 1106 | $1,650 | $1.49 | 12d | 1 | 0.63mi |
| 185 Creekside Villa Dr Kyle, TX | 3.0 | 2.5 | 1463 | $1,700 | $1.16 | 16d | 1 | 0.65mi |
| 155 Creekside Villa Dr Kyle, TX | 3.0 | 2.0 | 1266 | $1,695 | $1.34 | 6d | 1 | 0.66mi |
| 155 Creekside Villa Dr Kyle, TX | 3.0 | 2.0 | 1266 | $1,495 | $1.18 | 16d | 1 | 0.66mi |
| 155 Creekside Villa Dr Kyle, TX | 3.0 | 2.0 | 1266 | $1,695 | $1.34 | 25d | 1 | 0.66mi |
| 149 Creekside Villa Dr Kyle, TX | 3.0 | 2.0 | 1266 | $1,495 | $1.18 | 16d | 1 | 0.67mi |
| 521 Bunton Reserve Blvd Kyle, TX | 3.0–4.0 | 2.0–3.0 | 1870 | $1,935 | $1.03 | 0d | 15 | 0.68mi |
| 261 New Bridge Dr Kyle, TX | 4.0 | 2.0 | 1368 | $1,849 | $1.35 | 45d | 1 | 0.68mi |
| 106 Lakeview Ct Kyle, TX | 3.0 | 2.5 | 1765 | $1,795 | $1.02 | 19d | 1 | 0.75mi |
| 112 Lakeview Ct Kyle, TX | 3.0 | 2.5 | 1765 | $1,795 | $1.02 | 6d | 1 | 0.76mi |
| 1187 Amy Dr Kyle, TX | 4.0 | 2.0 | 1904 | $2,100 | $1.10 | 19d | 1 | 0.77mi |
| 1628 Arbor Knot Dr Kyle, TX | 3.0 | 2.0 | 1620 | $2,180 | $1.35 | 45d | 1 | 0.78mi |
| 1561 Arbor Knot Dr Kyle, TX | 2.0 | 2.0 | 1195 | $1,750 | $1.46 | 4d | 1 | 0.83mi |
| 131 Connor Elkins Dr Kyle, TX | 3.0 | 2.0 | 2015 | $2,000 | $0.99 | 6d | 1 | 0.86mi |
| 125 Chesterfield Dr Kyle, TX | 4.0 | 2.0 | 1995 | $2,350 | $1.18 | 45d | 1 | 0.89mi |
| 2681 Winding Creek Rd Kyle, TX | 3.0 | 2.0 | 1754 | $1,875 | $1.07 | 45d | 1 | 0.91mi |
| 1180 Arbor Knot Dr Kyle, TX | 4.0 | 2.0 | 1822 | $1,999 | $1.10 | 6d | 1 | 0.93mi |
| 110 Keltic Dr Kyle, TX | 3.0 | 2.0 | 1754 | $1,895 | $1.08 | 16d | 1 | 0.93mi |
| 2721 Winding Creek Rd Kyle, TX | 3.0 | 2.0 | 1937 | $1,995 | $1.03 | 0d | 1 | 0.94mi |
| 117 Keltic Dr Kyle, TX | 3.0 | 2.0 | 1437 | $1,850 | $1.29 | 19d | 1 | 0.94mi |
| 125 Voyager Cv Kyle, TX | 3.0 | 2.0 | 1476 | $1,800 | $1.22 | 45d | 1 | 0.97mi |
| 124 Fabion St Kyle, TX | 4.0 | 2.5 | 2025 | $2,100 | $1.04 | 19d | 1 | 1.00mi |
Listing history 10 events
-
2026-06-21days on market $109,995 Active 16 DOM
-
2026-06-18days on market $109,995 Active 13 DOM
-
2026-06-17days on market $109,995 Active 12 DOM
-
2026-06-16days on market $109,995 Active 11 DOM
-
2026-06-15days on market $109,995 Active 10 DOM
-
2026-06-13days on market $109,995 Active 8 DOM
-
2026-06-09days on market $109,995 Active 4 DOM
-
2026-06-08days on market $109,995 Active 3 DOM
-
2026-06-07remarks 322-char remark
-
2026-06-07$109,995 Active 2 DOM
ⓘ Source: listings_history table (triggers on properties + properties_extension) + one-shot
backfill from property_details.listing_events for pre-trigger history.
Nearby sold comps map
Loading sold comps map…
Walkable amenities ~0.75 mi
Loading nearby amenities…
Taxation est. · year 1
- Rental income
- $22,627
- − Mortgage interest
- −$6,161
- − Property taxes
- −$1,650
- − Insurance
- −$550
- − Repairs & maintenance
- −$1,810
- − Management
- −$1,810
- − Depreciation
- −$3,200
- Taxable income
- $7,446
- Est. tax owed @ 24.0%
- −$1,787
- After-tax cash flow
- $6,967/yr
For passive investors: Depreciation is non-cash, so a rental often shows a tax loss while cash-flowing — sheltering income. Rental losses are passive: they offset passive income freely, and up to $25,000/yr can offset ordinary (W-2) income if you actively participate and your MAGI is under $100k (phasing out to $0 by $150k); unused losses carry forward. On sale, claimed depreciation is recaptured at up to 25%, and gains may owe capital-gains tax (a 1031 exchange can defer both). Figures are a year-1 estimate at your 24.0% rate — not tax advice; consult a CPA.
Condition & rehab AI · 10 photos
This brand-new 3-bedroom, 2-bath home is move-in ready with modern appliances and fixtures. It offers a spacious layout and a covered porch, making it perfect for everyday living.
Value-add opportunities
- Both Painting exterior and interior walls — Enhances curb appeal and interior aesthetics
- Both Upgrading light fixtures — Improves energy efficiency and ambiance
- Both Adding smart home features — Enhances convenience and marketability
Renovation cost estimate screening
Value-add ROI direction
- Both Painting exterior and interior walls — Enhances curb appeal and interior aesthetics ↑
- Both Upgrading light fixtures — Improves energy efficiency and ambiance ↑
- Both Adding smart home features — Enhances convenience and marketability ↑
ⓘ Cost ranges are severity-bucket heuristics (US national rule-of-thumb). Get contractor quotes + a written scope before underwriting a rehab budget.
Schools (NCES district)
- District
- Hays CISD
- NCES district ID
- 4800010
- Math proficiency
- 35% ▼ -15.00%
- Reading proficiency
- 41% ▼ -5.00%
- Median HH income
- $70,570
- Composite
- 34.78/100
- National rank
- #5118
- State rank
- #390 of 826 in TX
Livability — Kyle
- Score
- 75/100
- State rank
- #138
- US rank
- #3993
Category grades
Schools grade is shown separately in the Schools card above.
Census & demographics
- Census place
- Kyle, TX
- County
- Hays County · 280,138 people
- City population
- 77,531
- Metro
- Austin-Round Rock-Georgetown, TX
- Population (ZIP)
- 77,531
- Household income
- $90,075
- Rent vs Own
- Severe rent burden
- 2552.0
Population outlook (Hays County) Hauer SSP2
- Today (2025)
- 286,948 people
- By 2030
- 336,923 · +17.4%
- By 2040
- 441,894 · +54.0%
- By 2050
- 553,462 · +92.9%
- By 2075
- 838,261 · +192.1%
- By 2100
- 1,063,658 · +270.7%
Race, ethnicity, and origin ACS 2023
- Neighborhood character
- Diverse neighborhood (Simpson 0.56)
- Race & ethnicity
- Hispanic / Latino 55% White 36% Two or more races 29% Black 5% Native American 1%
- Hispanic origin (detail)
- Mexican 47% Puerto Rican 1%
- Common ancestry
- Italian 2% Slovak 2% Lithuanian 1%
- Foreign-born
- 13% · Canada
- Languages at home
- 63% English-only · Spanish 35%
Political lean MEDSL · Hays
- 2024 margin
- Lean D (+5.7) · D 52.1% · R 46.5% · Other 1.4%
- 2008→2024 swing
- +7.7pp toward D · 2008: -2.0pp · 2024: 5.7pp
- All cycles
- 2024: D+5.7 2020: D+10.8 2016: R+0.9 2012: R+10.4 2008: R+2.0
Not yet ingested
- Civics
- —
Market trends
- HPI YoY
- ▼ -92.64%
- Current HPI
- 181.7969
- Rent YoY
- ▼ -0.34%
- Metro
- Austin-Round Rock-Georgetown, TX
- State GDP YoY
- ▲ 3.95%
- F500 in state
- 110
Industry mix (Fortune 500 HQ in TX)
| Industry | F500 HQs | Revenue |
|---|---|---|
| Energy | 16 | $1,198B |
|
||
| Technology | 5 | $198B |
|
||
| Engineering / Construction | 4 | $72B |
|
||
| Energy Services | 3 | $60B |
|
||
| Utilities | 3 | $41B |
|
||
| Healthcare | 2 | $330B |
|
||
Cash-flow waterfall
monthlySold comps — $/sqft
last 12 mo · ≤1 miLoading sold comps…